DOWNLOAD A PDF OF THIS REPORT pdf(0.6MB)
Contact
Michael BonnerPartner [email protected] 646-486-9744 Melissa Burek
Founding Partner [email protected] 212-921-9354 Lauren Peek
Partner [email protected] 212-921-9374 Bryan Roberts
[email protected] 212-921-9350
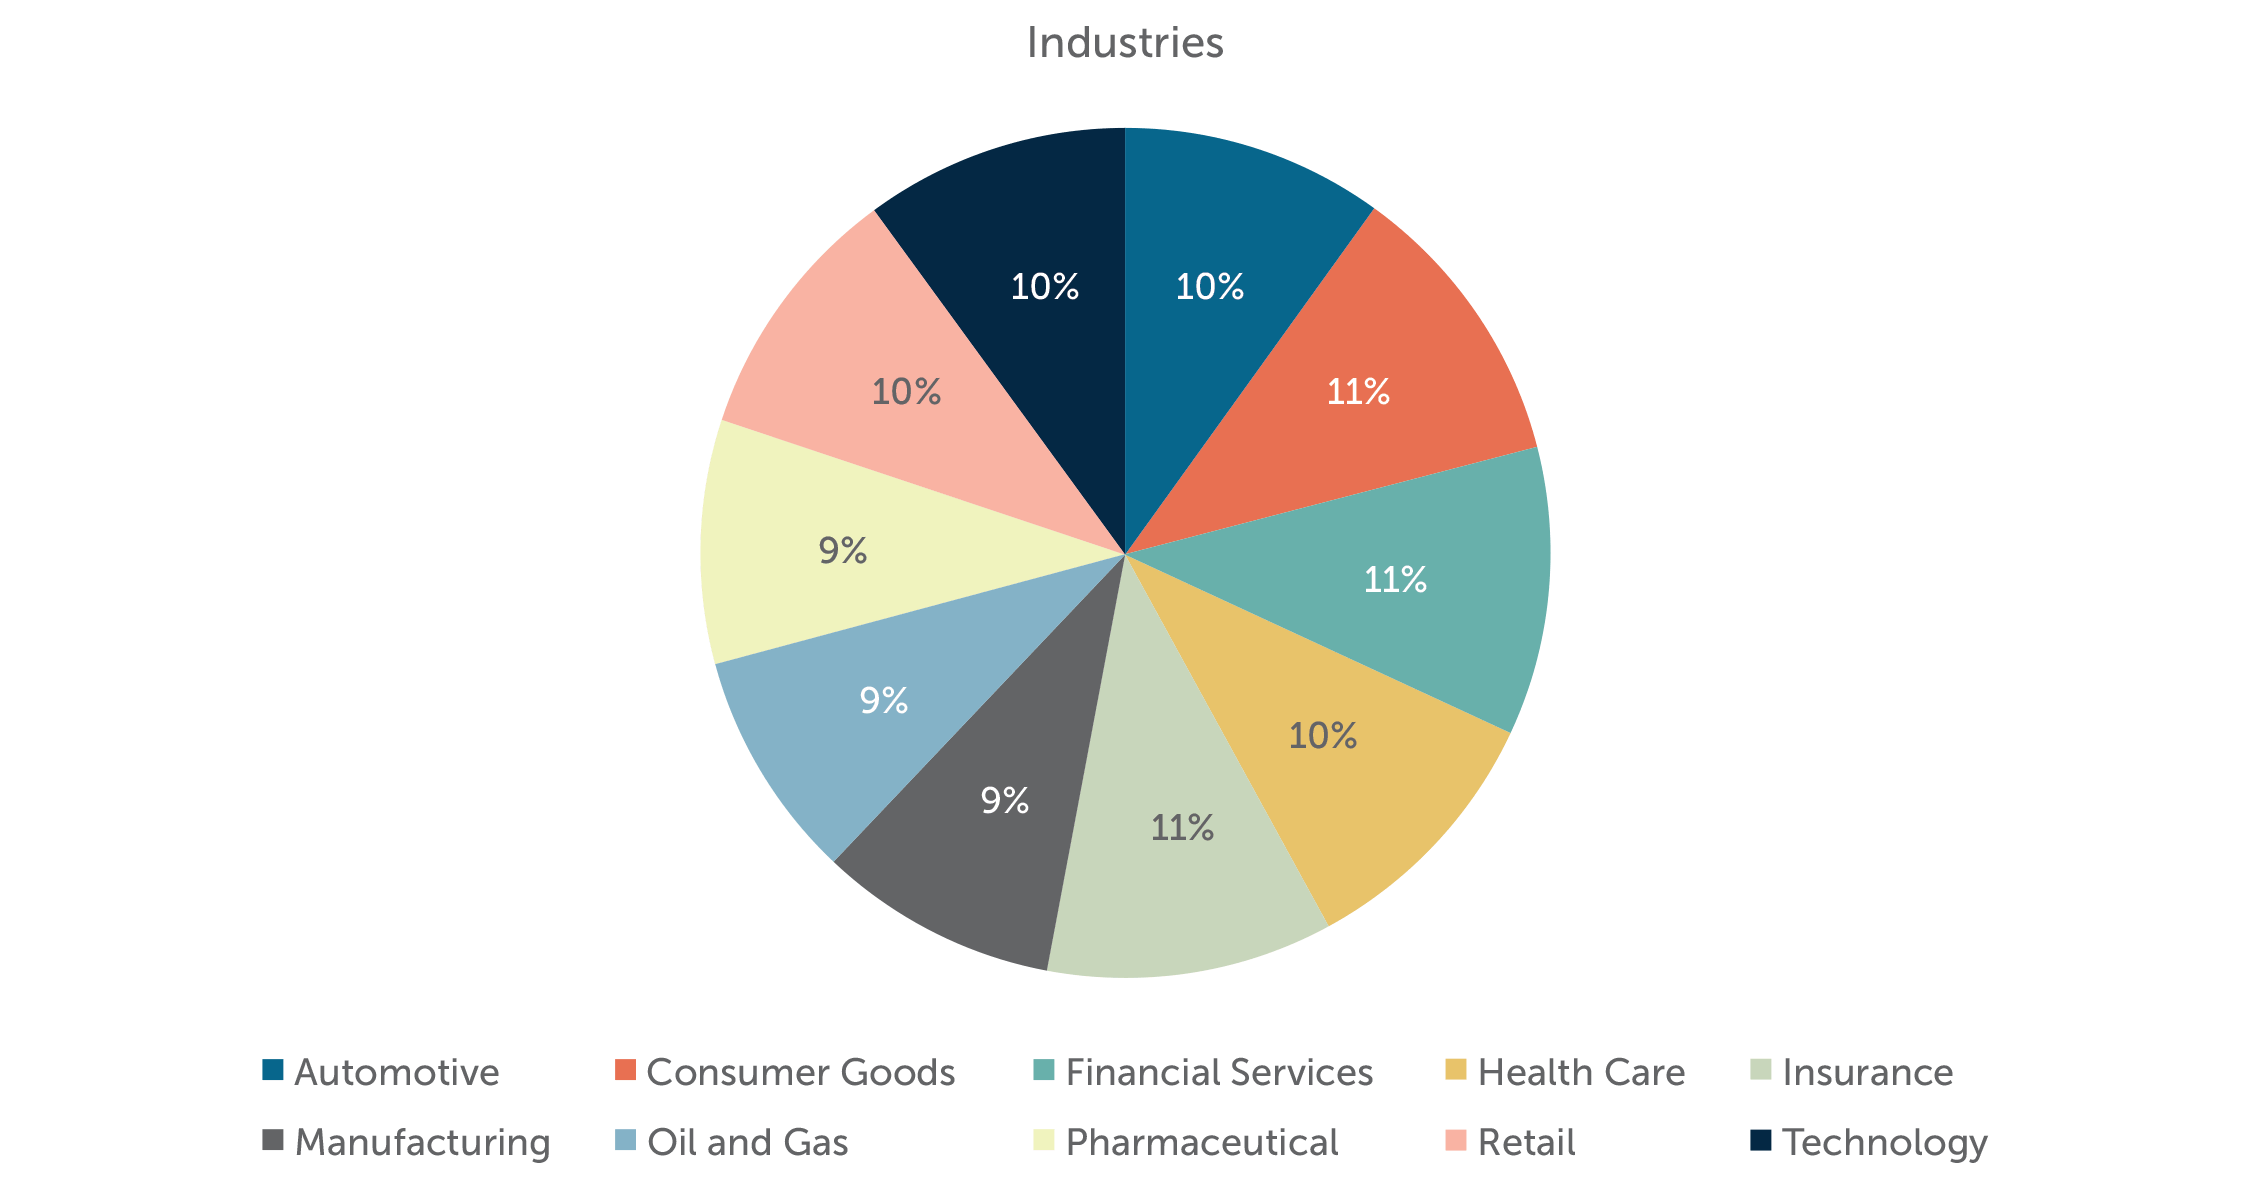
The CAP 100 Company Research consists of 110 companies from 10 industries, selected to provide a broad representation of market practice among large U.S. public companies. In this report, CAP reviewed Pay Strategies, Annual Incentives, Long-Term Incentives, Perquisites, and Shareholder Friendly Provisions of these companies in order to gauge general market practices and trends.
Characteristics of the CAP 100 Company Research Sample
The CAP 100 Research Study now consists of 110 companies selected from ten industries intended to provide a broad representation of market practice among large U.S. public companies. The fiscal year revenues of the companies in our sample range from approximately $5 billion to $500 billion (median revenue $32.2B). The sample is further summarized in the following exhibits.
| Percentile | Revenue | Net Income | Assets | Market
Cap |
Cumulative Total Shareholder Return (TSR) ending on 12/31/2017 | ||
| 1-Year | 3-Year | 5-Year | |||||
| 75th | $66,735 | $5,280 | $178,819 | $136,975 | 104% | 85% | 56% |
| Median | $32,207 | $2,567 | $62,431 | $57,469 | 65% | 62% | 36% |
| 25th | $19,542 | $1,303 | $32,696 | $31,636 | 44% | 39% | 25% |
Note: Financial Data ($mil.)
Pay Strategy
Among companies in the CAP 100 Research, 98% use a peer group of public companies for pay benchmarking purposes. The median number of companies in a peer group is 18 companies.
Approximately one-third (32%) of the companies with a peer group use more than one peer group. Companies with two or more peer groups typically use an industry-specific peer group as well as a general industry peer group for benchmarking purposes. Other companies with two or more peer groups use an industry peer group for benchmarking purposes and a second broader peer group, typically from an index of stocks, for relative performance comparisons.
| Peer Group (n=108) | ||
| % of companies with a disclosed peer group | % of companies with more than one peer group (among companies with a peer group) | Median # of companies in peer group |
| 98% | 32% | 18 |
53% of the companies disclose a target pay philosophy for total compensation. Most of these companies (93%) use median as a benchmark, with only 7% of companies targeting total compensation above the median.
| Target Pay Philosophy (n=58) | |||||
| Element | Base | Bonus | Cash | Long-Term Incentive | Total Compensation |
| % Disclosing | 40% | 30% | 29% | 32% | 53% |
| % Target Below Median Pay | 7% | – | – | – | – |
| % Target Median Pay | 89% | 97% | 97% | 97% | 93% |
| % Target Above Median Pay | 4% | 3% | 3% | 3% | 7% |
Annual Incentive
Award Leverage
CAP reviewed proxy disclosures to understand how companies establish annual incentive (bonus) payout ranges (i.e., threshold payout and maximum payout expressed as a percentage of the target award). Approximately half of companies disclose a threshold bonus payout at a defined level other than zero. A threshold payout of 50% of the target award is most common; in general, the range among our sample was 25% to 50% of target. Other companies start at a 0% payout for threshold performance with payout levels progressing to target.
93 of 110 companies disclose a maximum bonus opportunity. Most companies (75%) have a maximum bonus opportunity of 200% of the target award. The number of companies in our study with maximum payouts above 200% (8 total) decreased by almost one-third compared to last year’s study (11 total).
Annual Incentive Plan Payout Range
|
|
|||||||||||||||||||||||||||||||||||||||
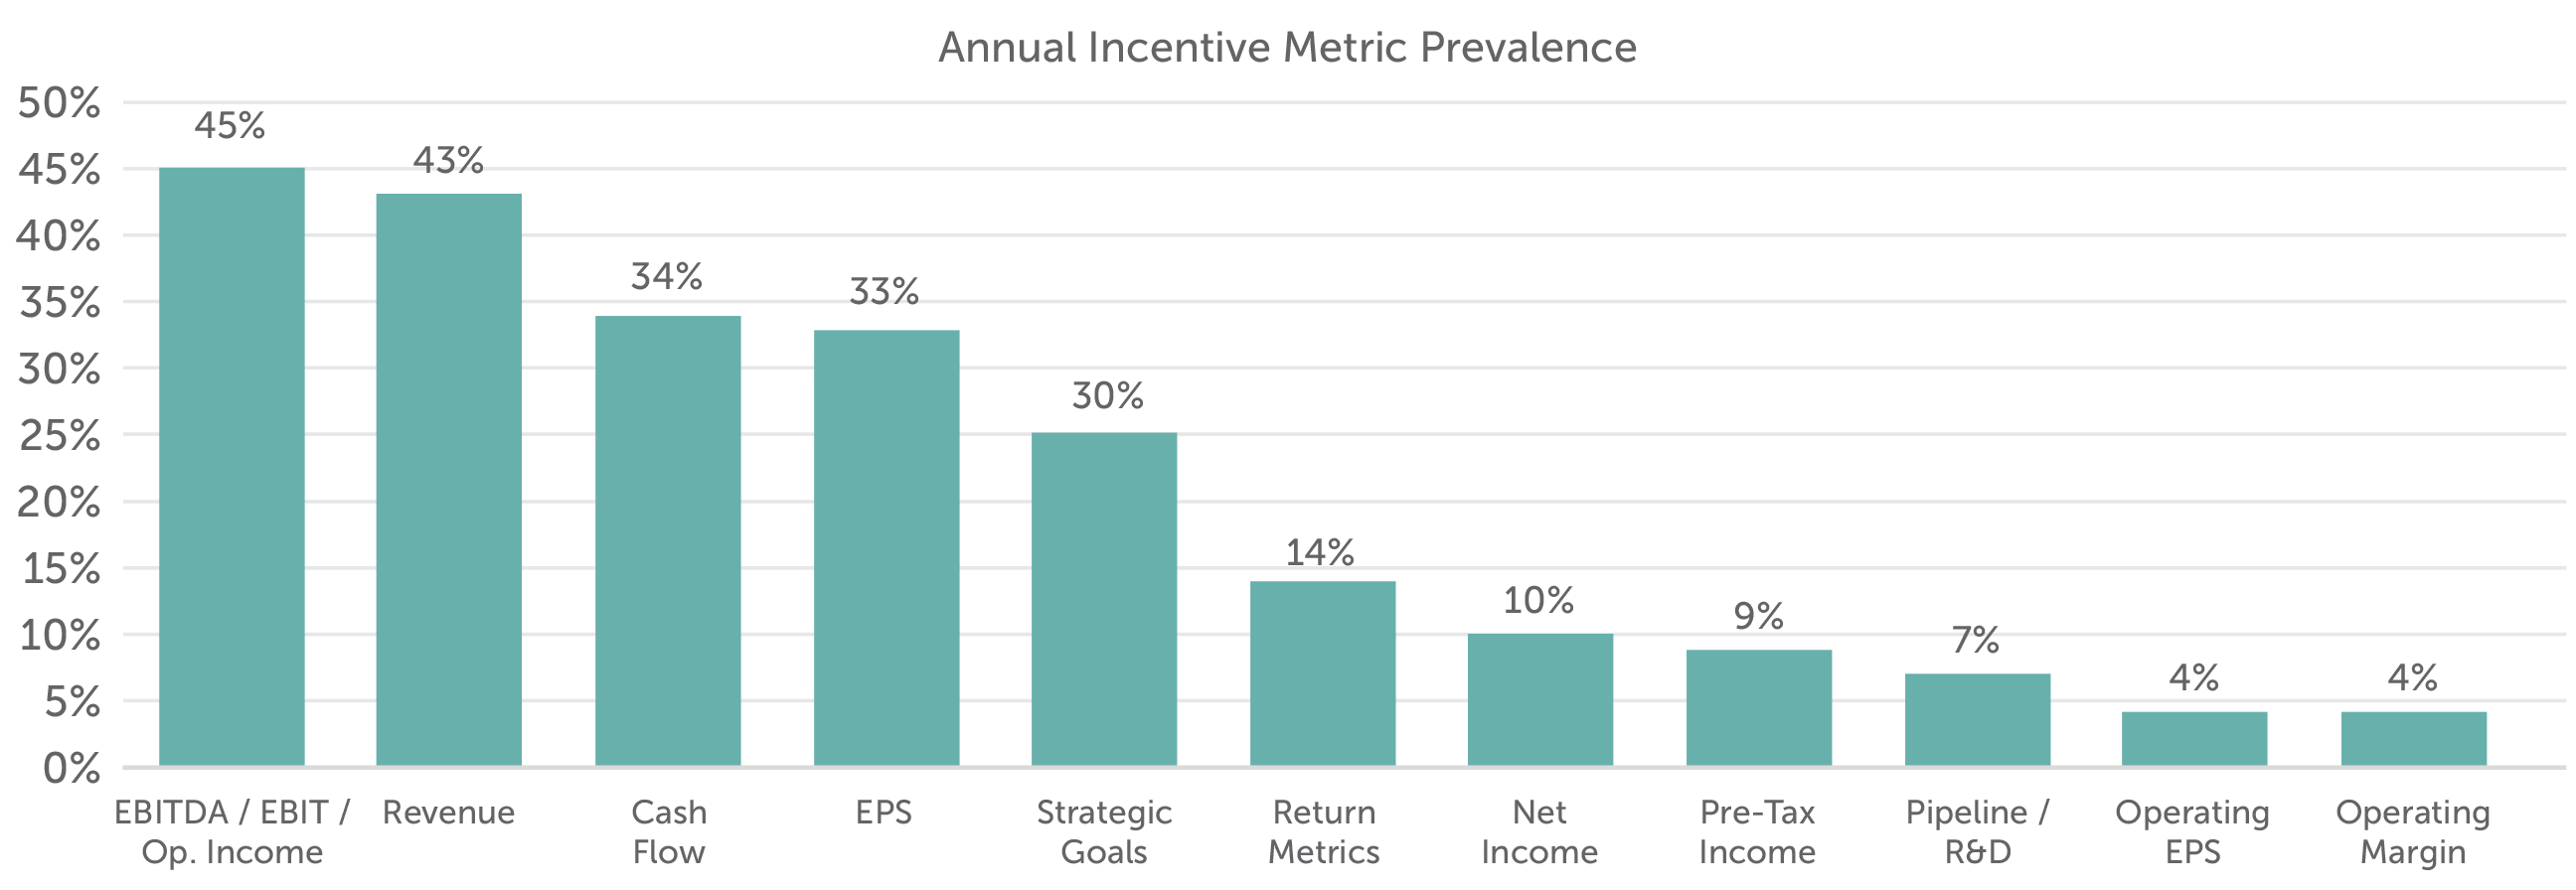
Annual Incentive Plan Metrics
Operating Income (including EBITDA and EBIT), Revenue, Cash Flow, and EPS continue to be the most common metrics used in annual incentive plans. Most companies fund annual incentive plans using two or three metrics. These metrics are typically measured against absolute financial performance targets based on budget. The use of multiple performance metrics allows for annual incentive payouts to be tied more closely to overall company performance in a balanced fashion.

The use of Cash Flow, EPS and Return Metrics all increased slightly (by 3% to 4%) versus 2016. We are also seeing an increased use of strategic measures, more formally, in incentive plans.
The chart below shows the three most common metrics by industry in 2017:
| Industry | Metrics | ||
| Metric #1 | Metric #2 | Metric #3 | |
| Automotive | Cash Flow (73%) | Strategic Goals (55%) | EBIT / Op. Income (45%) |
| Consumer Goods | EPS (67%) | Revenue (58%) | EBIT / Op. Income (42%) |
| Financial Services | EPS (33%) | Return Metrics (17%) | n.m. |
| Health Care | EPS (64%) | Strategic Goals (45%) | Op. Income (36%) |
| Insurance | Op. Income (58%) | Op. EPS (33%) | Op. ROE (25%) |
| Manufacturing | Cash Flow (60%) | EPS (40%) | EBIT / Op. Income (30%) |
| Oil and Gas | Strategic Goals (50%) | Cash Flow (30%) | EPS, EBIT/Op. Income, EBITDA, ROI / ROIC (each 20%) |
| Pharmaceuticals | Revenue (80%) | Pipeline / R&D (70%) | EPS (50%) |
| Retail | Revenue (64%) | Op. Income (36%) | EBIT (27%) Strategic Goals (27%) |
| Technology | Revenue (64%) | Cash Flow (55%) | Op. Income (45%) |
Note: Percentages reflect the prevalence of companies disclosing the metric.
2017 Actual Bonus Payouts
Overall, the median CEO bonus payout for 2017 performance was 118% of target – an increase over the median payout for 2016 performance of 101%. Across the industries, median CEO bonus payouts were the highest in Health Care (140%), Oil and Gas (135%), Technology (129%), and Consumer Goods (126%). None of the ten industries had a median bonus payout of less than 100% of target. Compared to bonuses paid for 2016 performance, the Retail industry showed the greatest increase in payout, year-over-year.
Median CEO bonus payouts for 2017 compared to 2016
| Industry | CEO Bonus Payouts as a Percentage of Target | |||||
| 75th Percentile | Median | 25th Percentile | ||||
| 2017 | 2016 | 2017 | 2016 | 2017 | 2016 | |
| Automotive | 179% | 160% | 125% | 109% | 106% | 76% |
| Consumer Goods | 139% | 149% | 126% | 123% | 84% | 109% |
| Financial Services | 120% | 98% | 107% | 86% | 85% | 81% |
| Health Care | 146% | 129% | 140% | 106% | 71% | 86% |
| Insurance | 170% | 133% | 111% | 100% | 88% | 84% |
| Manufacturing | 144% | 116% | 125% | 99% | 120% | 85% |
| Oil and Gas | 177% | n/a | 135% | n/a | 89% | n/a |
| Pharmaceutical | 139% | 145% | 113% | 125% | 105% | 117% |
| Retail | 162% | 98% | 113% | 57% | 83% | 38% |
| Technology | 140% | 118% | 129% | 100% | 95% | 94% |
| Total Sample | 152% | 131% | 118% | 101% | 90% | 85% |
Note: Most companies in the Financial Services industry do not disclose a target bonus for the CEO. For these companies, three-year average actual bonus was used as a substitute for target.
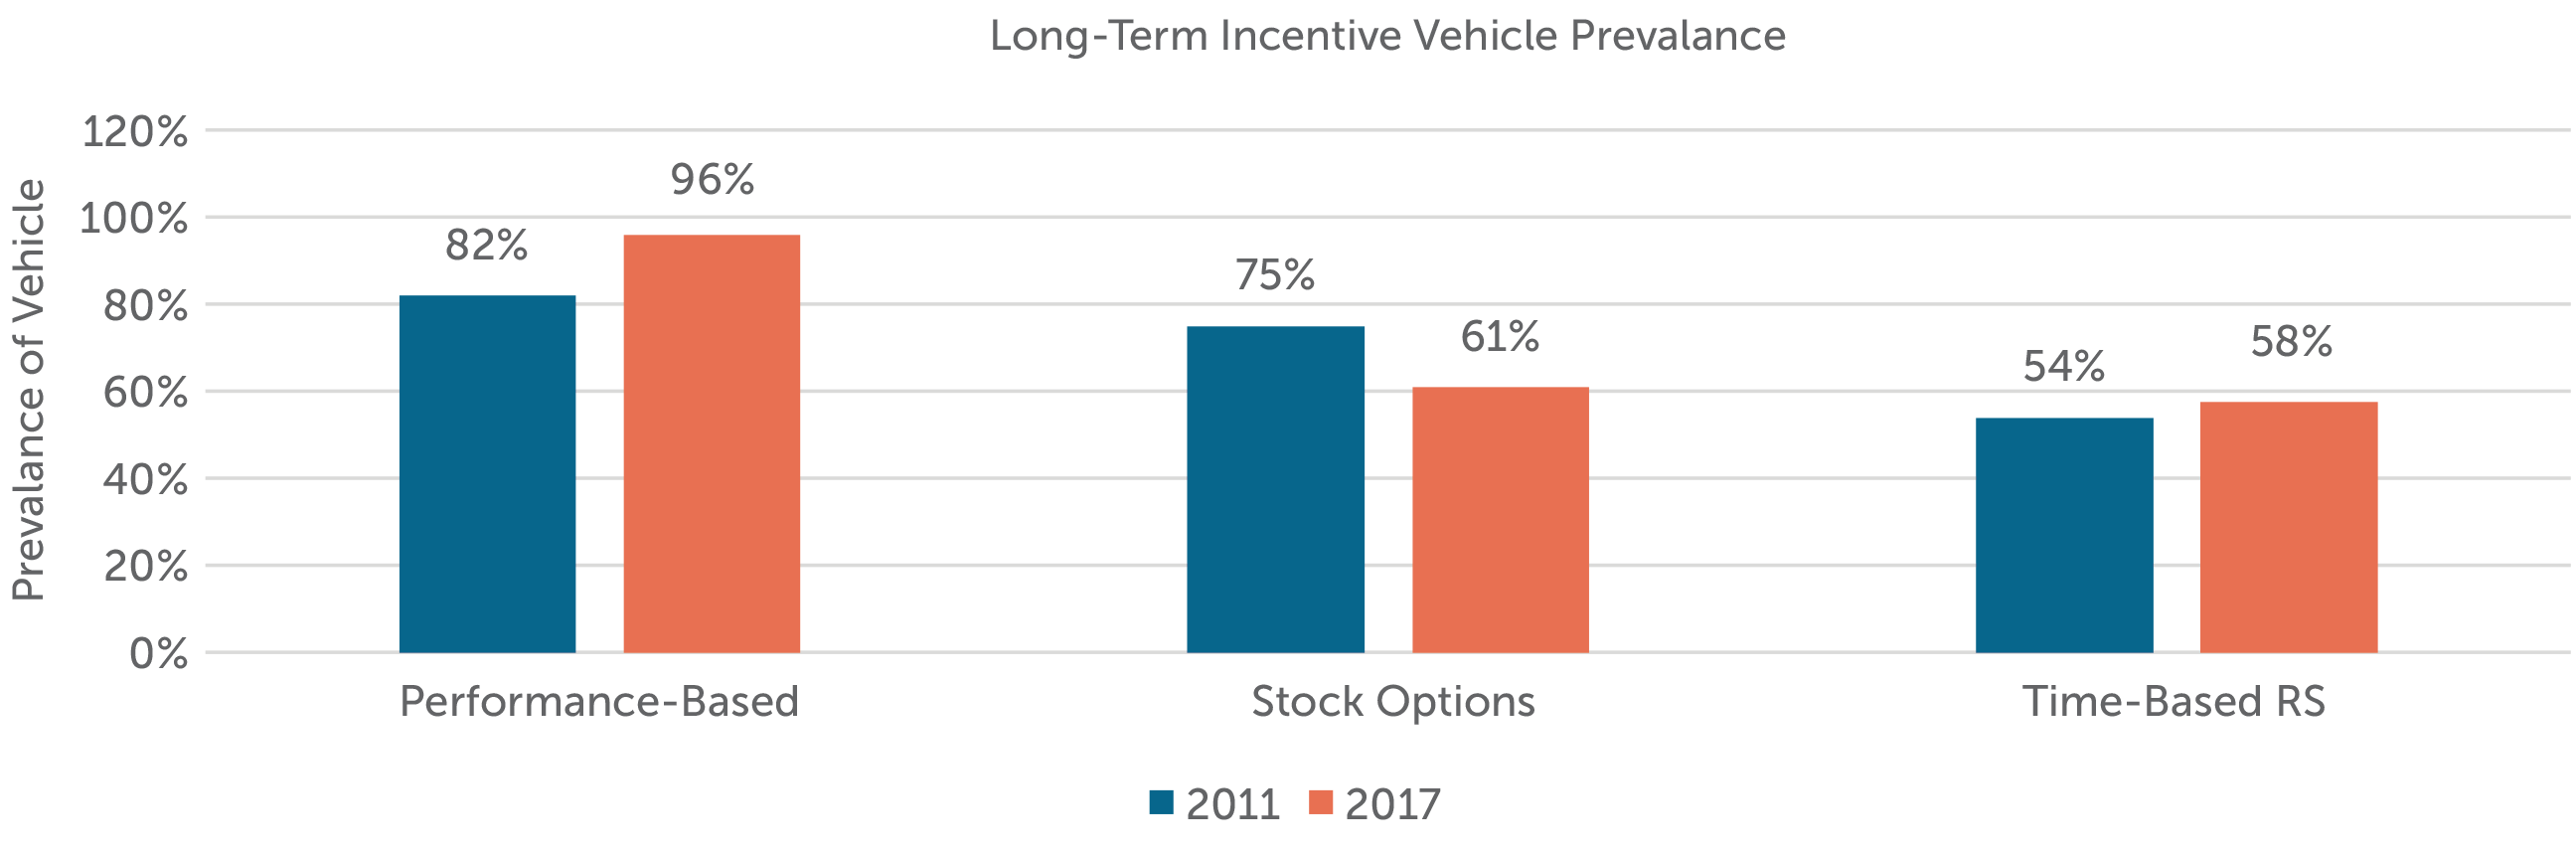
Long-Term Incentives Long-term Incentive Vehicle Prevalence
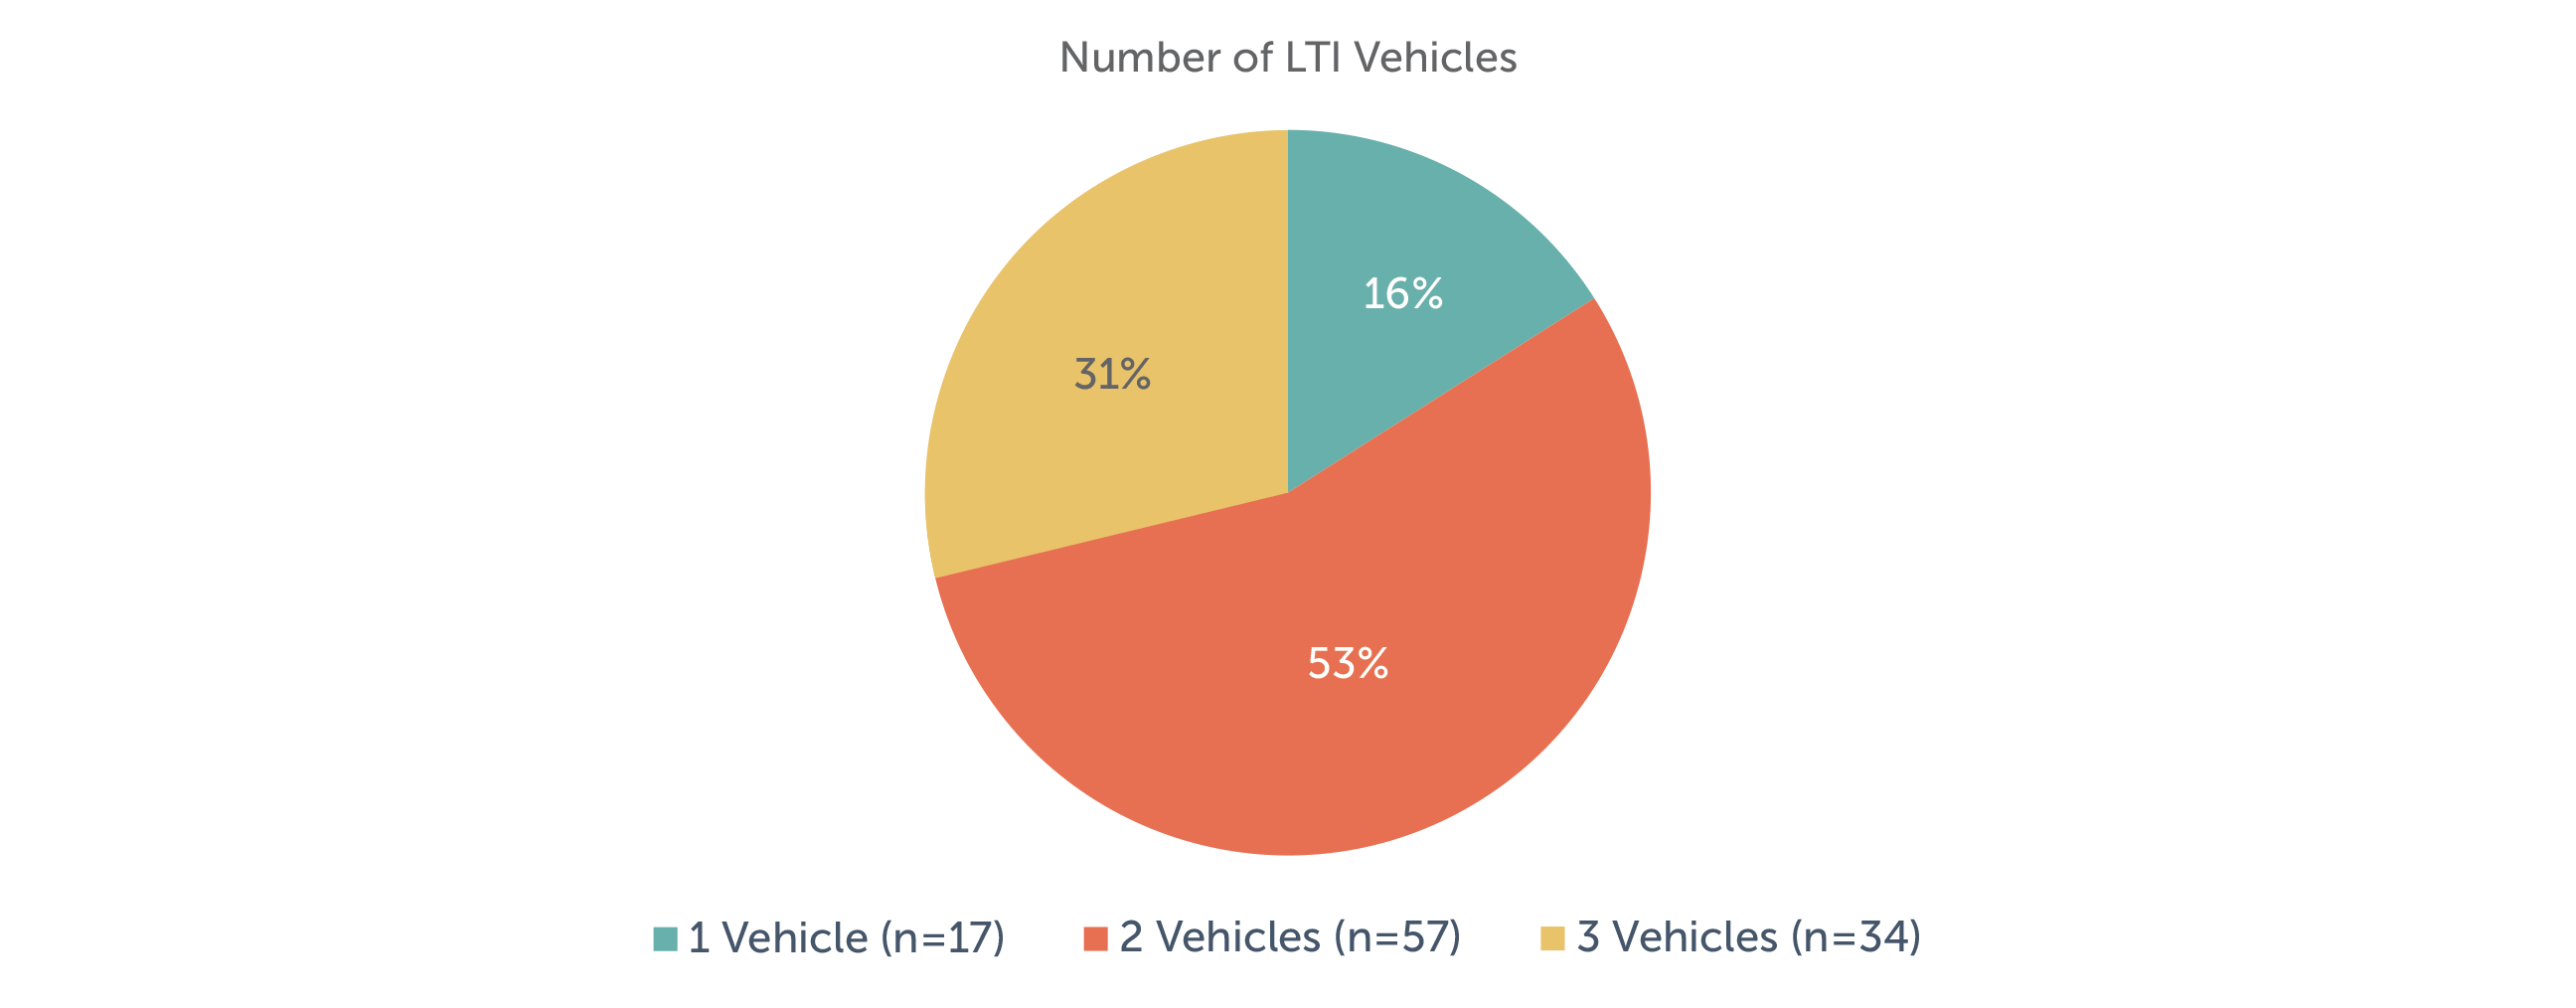
Most companies (84%) use a portfolio approach to long-term incentives based on a combination of long-term vehicles, such as stock options, restricted stock (or RSUs) and/or performance-based plans. Fifty-three percent of the companies in the study use two long-term incentive vehicles. These companies grant a combination of either a long-term performance plan and stock options (55%) or a long-term performance plan and restricted stock/RSUs (45%).
The next most common approach is to use three vehicles (31% of companies), and the least common approach is to use only one vehicle (16% of companies). Among companies using one vehicle, over 75% use a long-term performance plan.
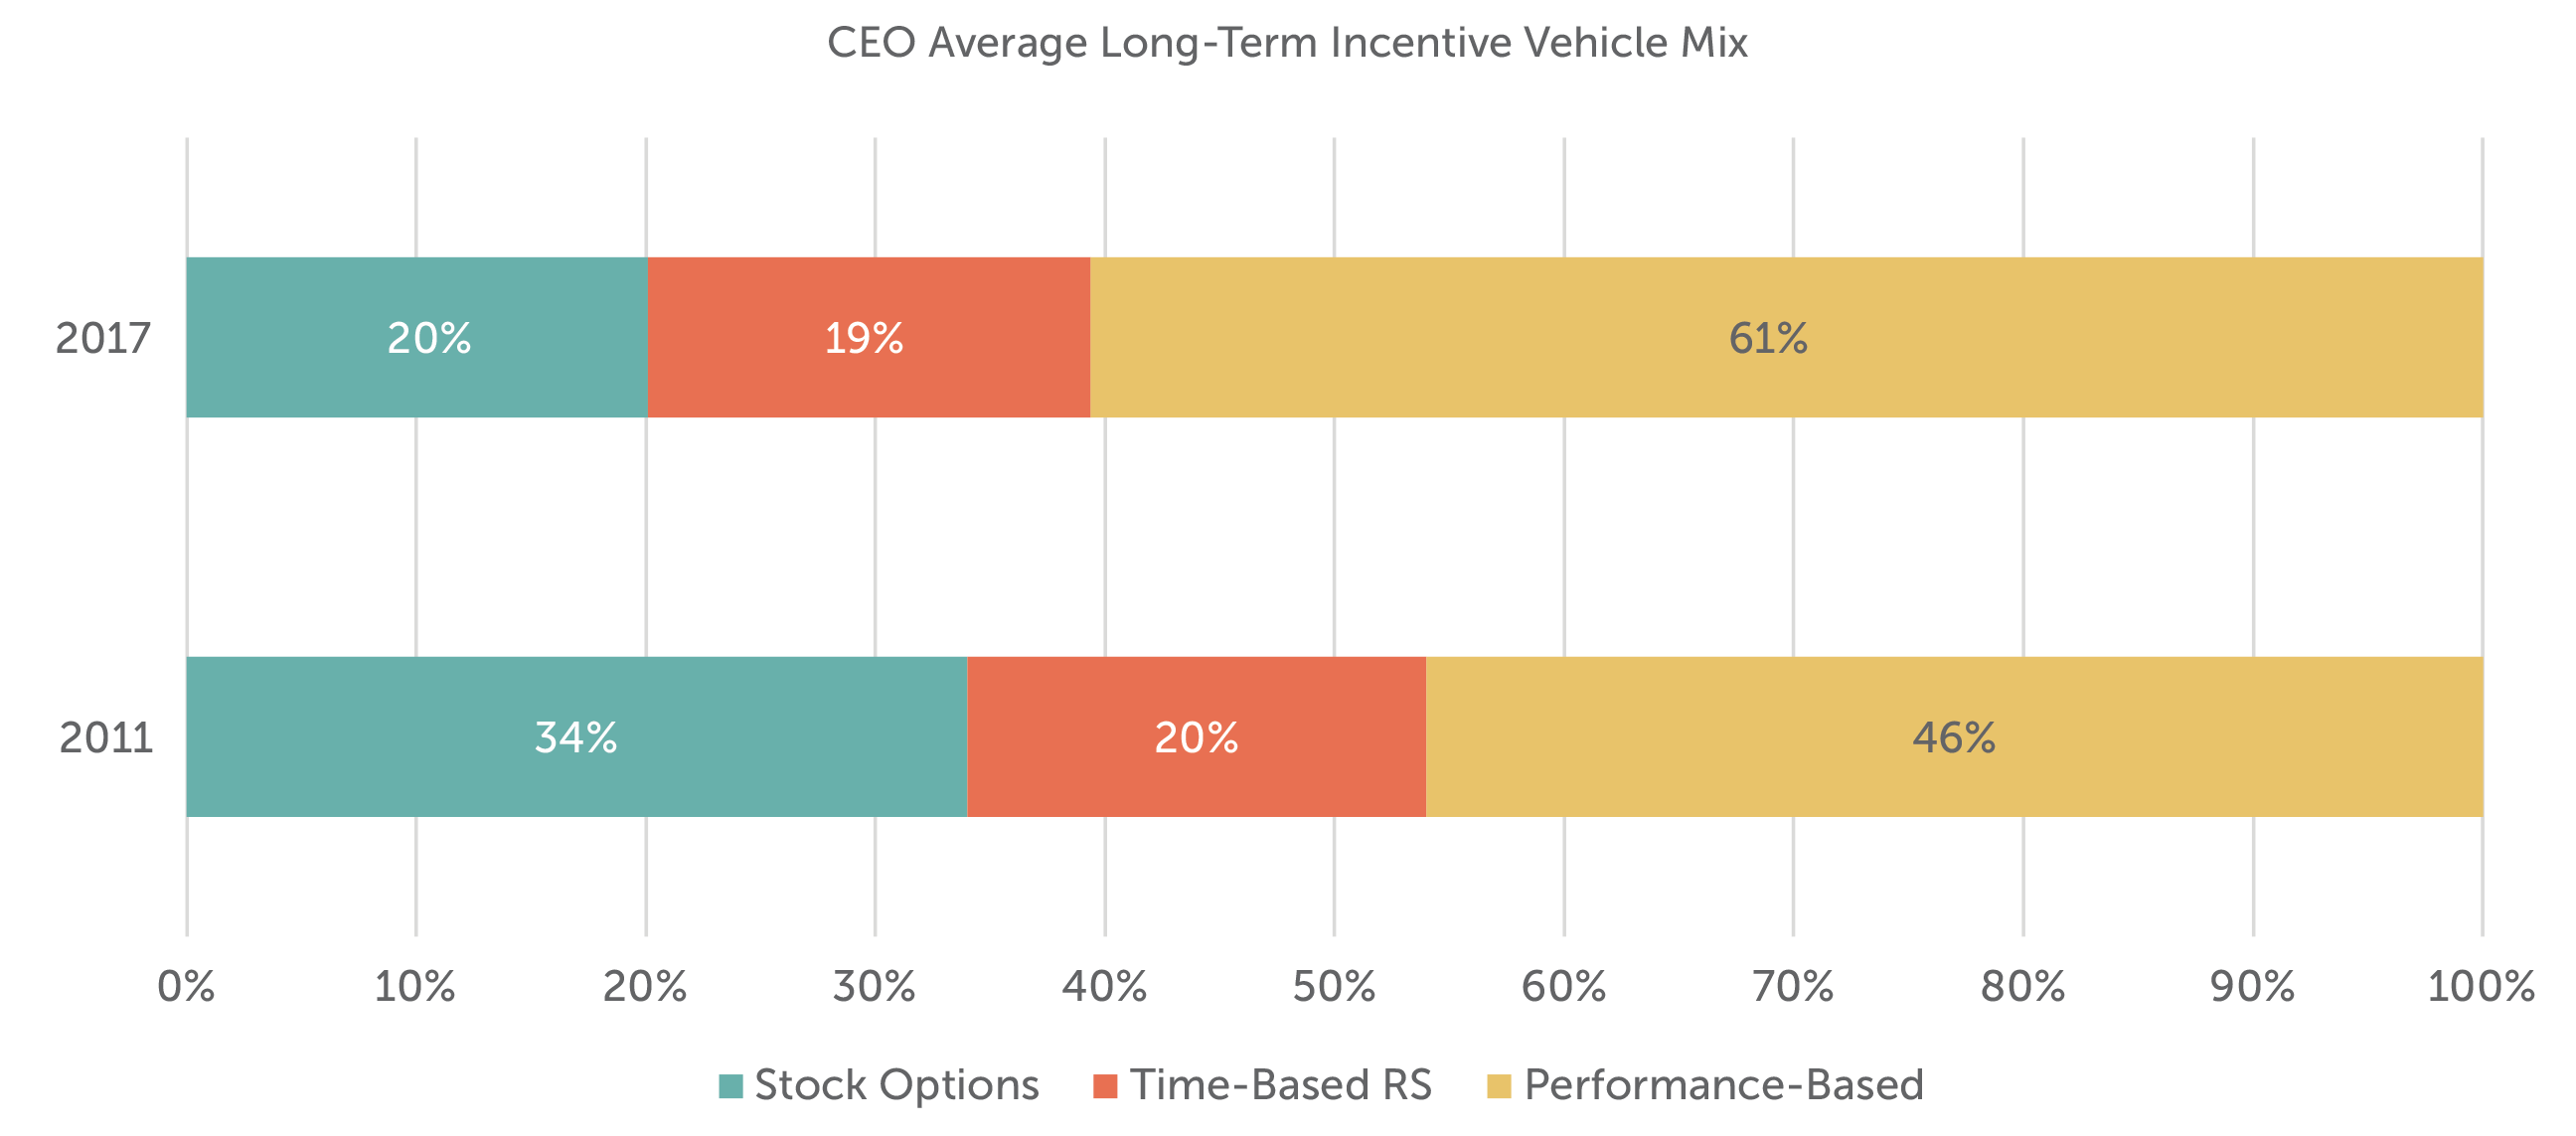
Since 2011, the percentage of companies using stock options declined by 14 percentage points to 61%, while the prevalence of time-based restricted stock/units has remained relatively flat. The bulk of the decline in stock options has transitioned to performance-based awards over time.
LTI Award Mix
While 61% of companies still utilize stock options, its emphasis in the overall CEO long-term incentive mix has declined significantly with the corresponding increase in performance-based long-term incentives.
Restricted Stock / Units (RS/RSU)
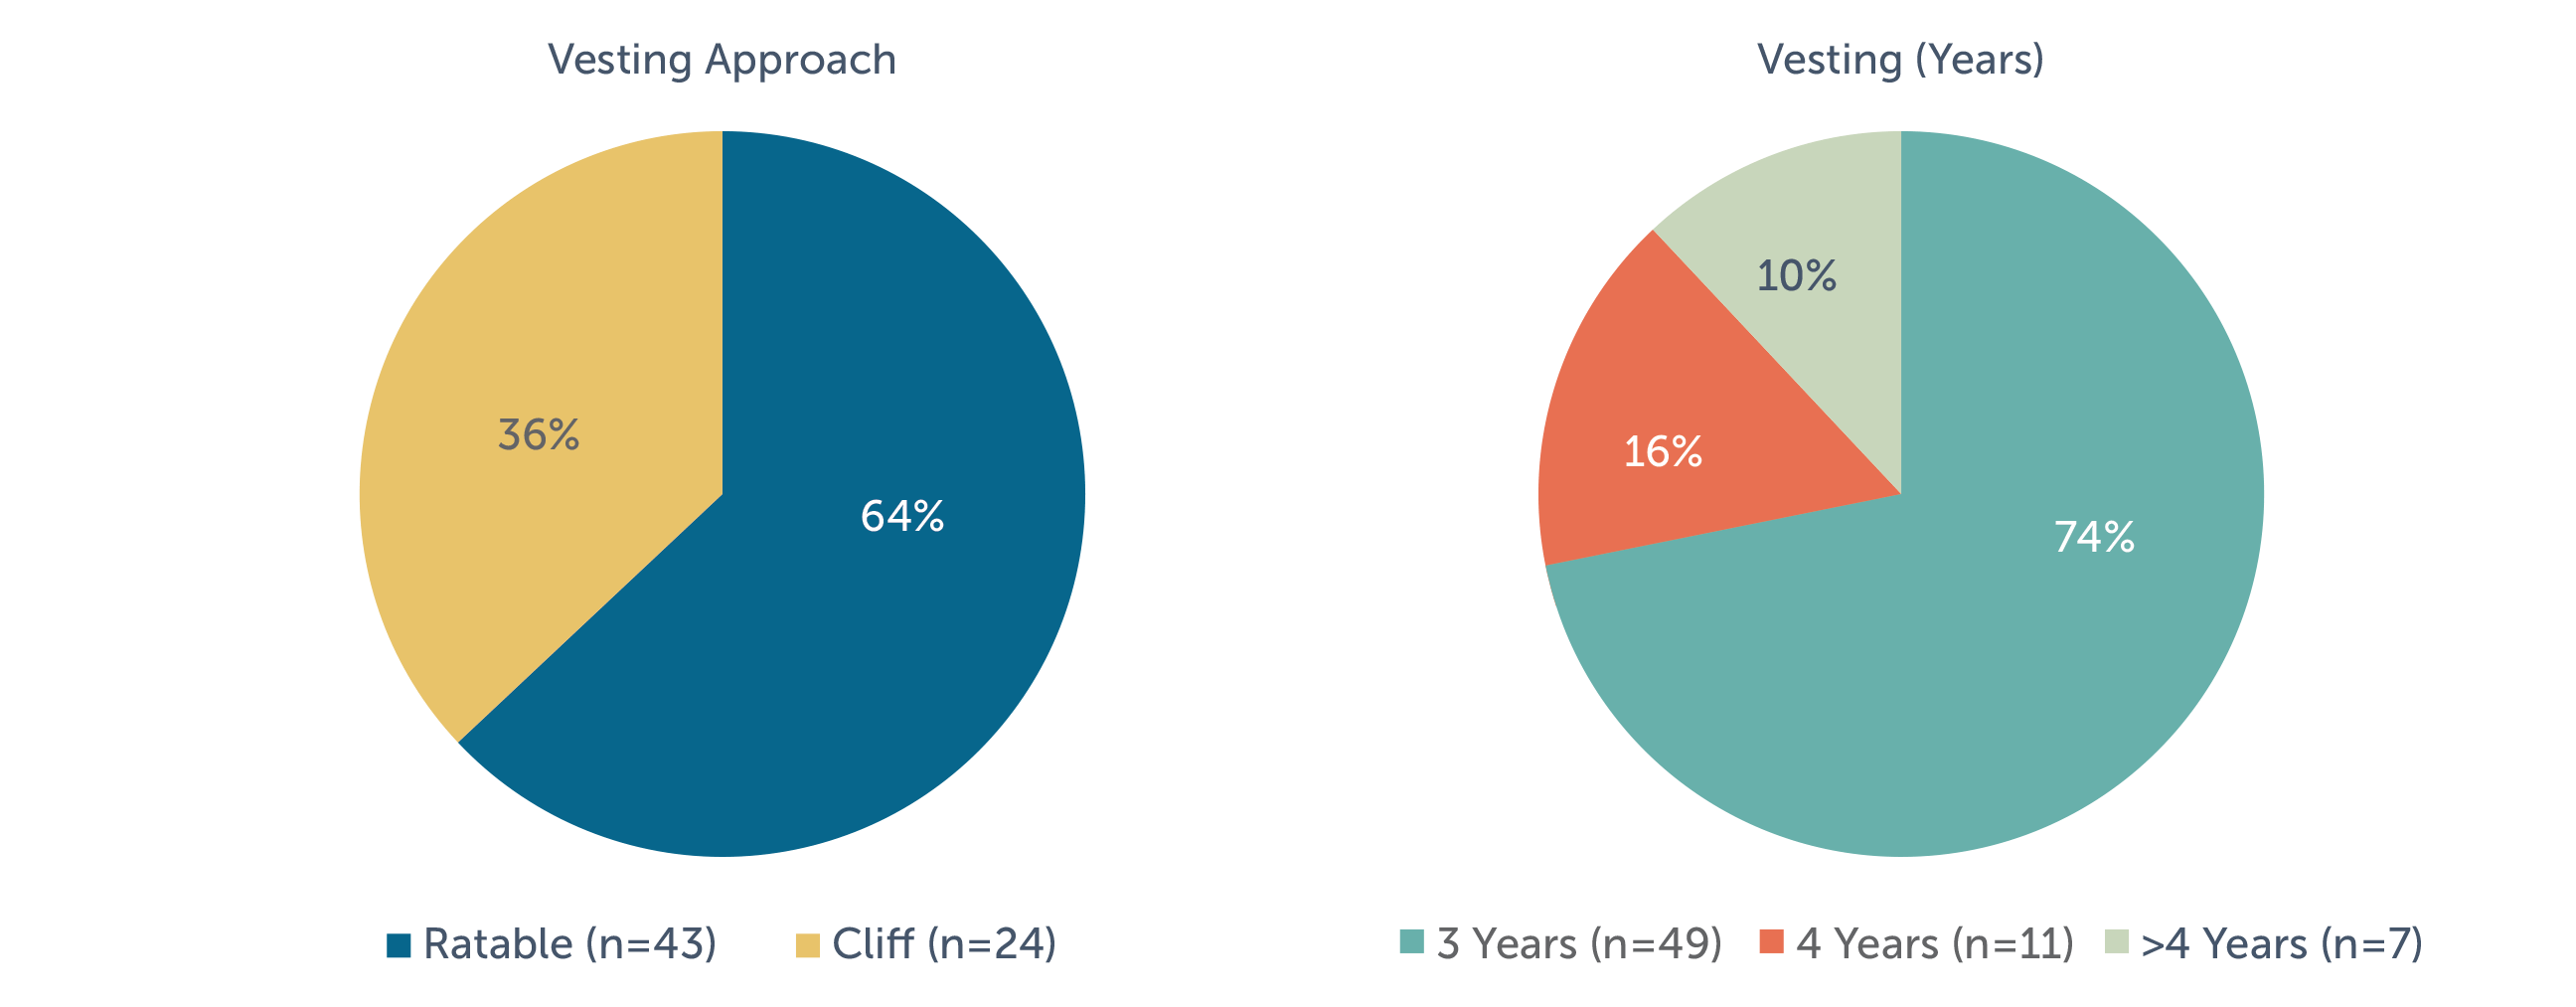
The majority of companies use ratable vesting over a period of three years for time-based RS/RSU awards. Approximately one-quarter of companies require a vesting schedule of four years or more.
| Vesting Approach | Vesting (Years) | |||
| Ratable (n=43) | Cliff (n=24) | 3 (n=49) | 4 (n=11) | > 4 (n=7) |
| 64% | 36% | 74% | 16% | 10% |
Stock Options
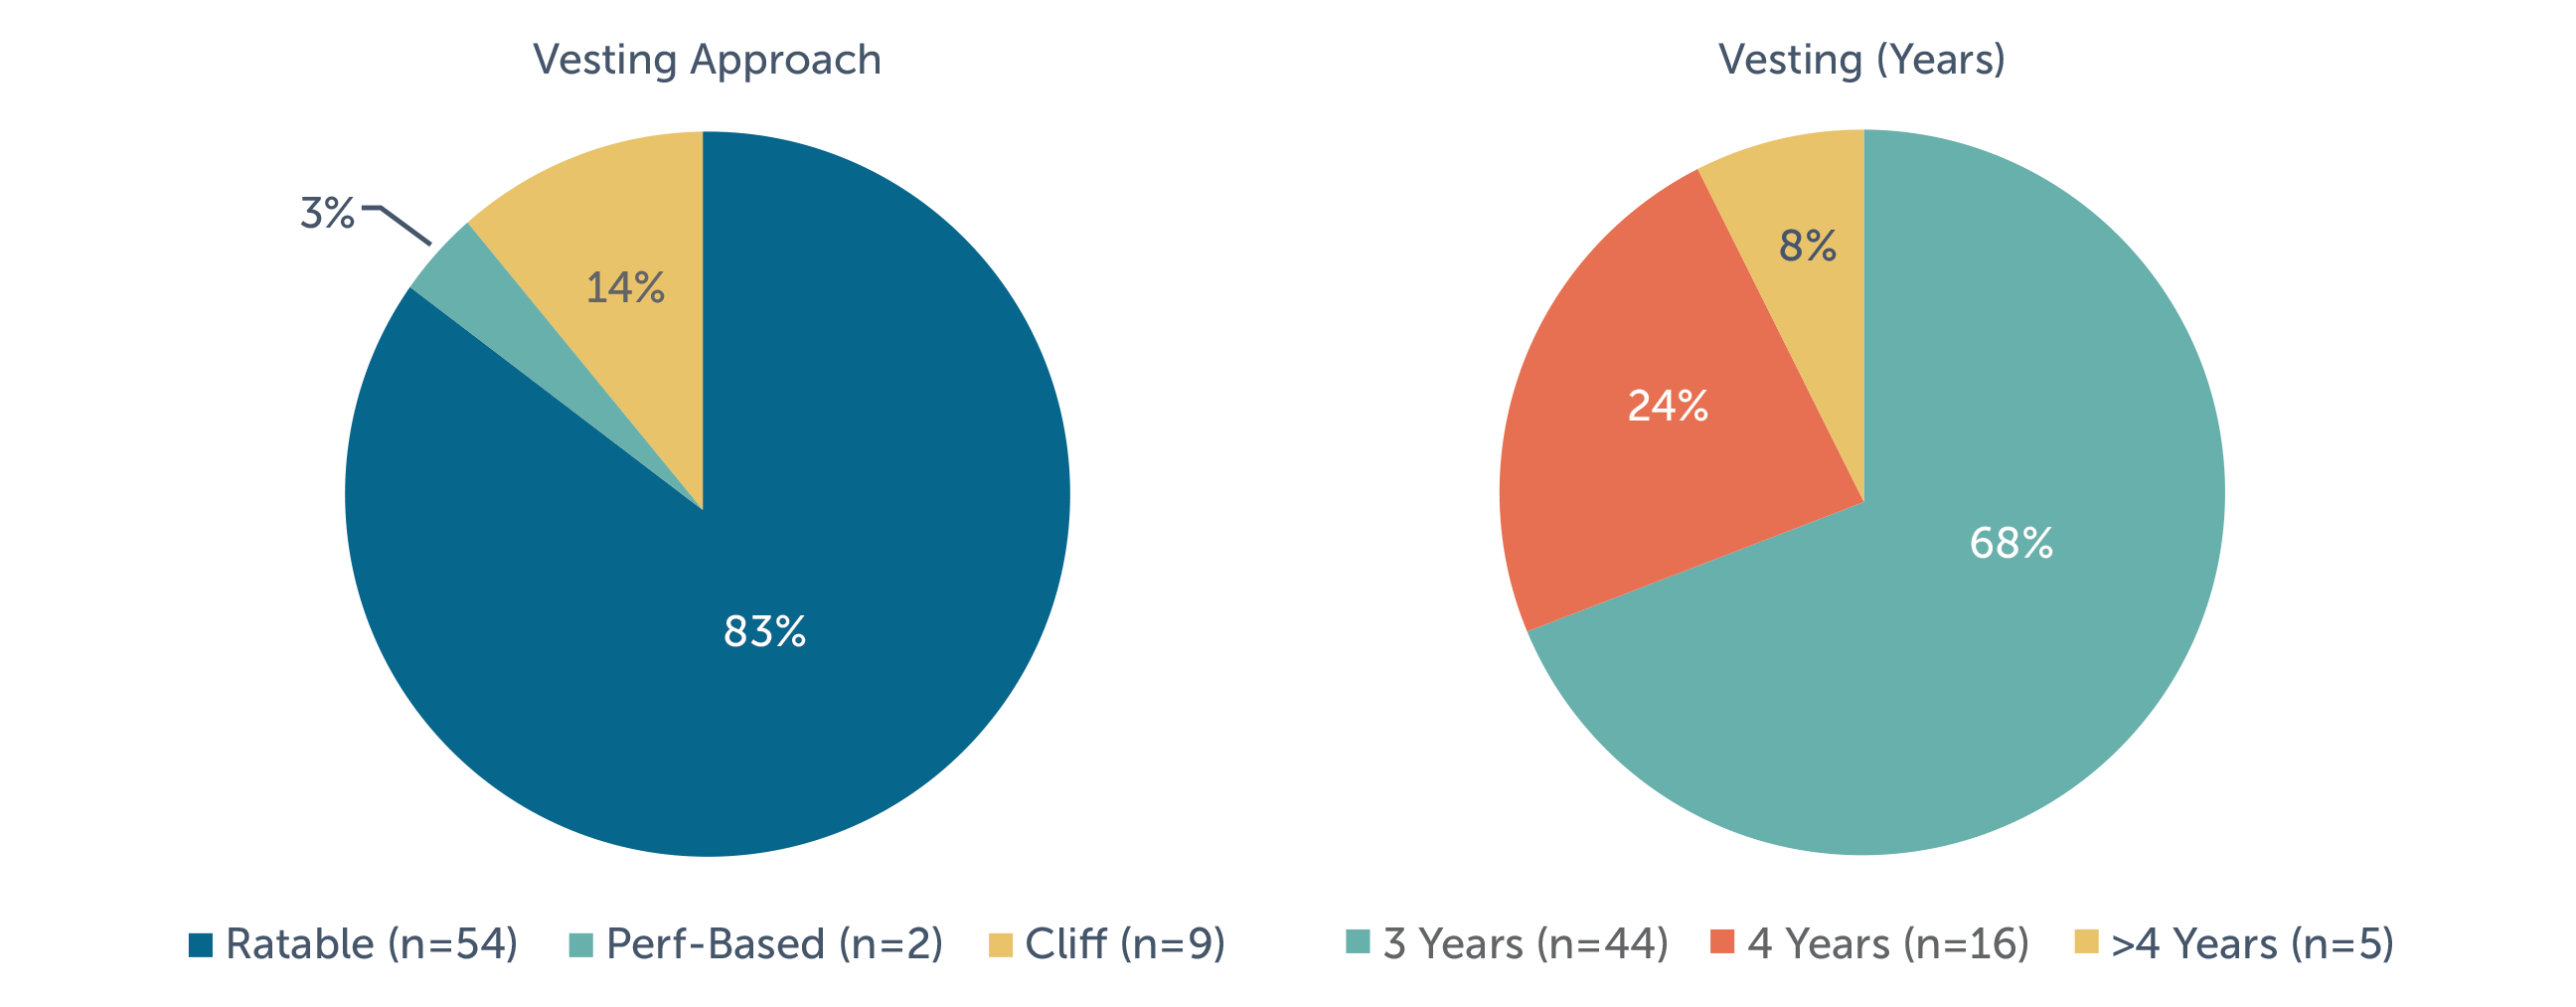
Most companies use a three-year ratable vesting schedule for stock options with a 10-year term.
| Vesting Approach | Vesting (Years) | Term (Years) | |||||
| Ratable
(n=54) |
Perf-Based
(n=2) |
Cliff
(n=9) |
3
(n=44) |
4
(n=16) |
> 4
(n=5) |
10
(n=58) |
< 10
(n=7) |
| 83% | 3%(1) | 14% | 68% | 24% | 8% | 89% | 11% |
(1) Both companies awarding performance-vested stock options utilize stock price performance as the performance metric, one based on absolute stock price and the other based on relative TSR versus the S&P 500.
Performance-Based Awards
Among companies that grant performance-based awards with upside and downside leverage, 85% of companies have a threshold payout of 25% to 50% of target. At maximum, the most common payout opportunity is 200% of target. Five percent of companies provide payout opportunities greater than 250% of target.
|
|
||||||||||||||||||||||||||
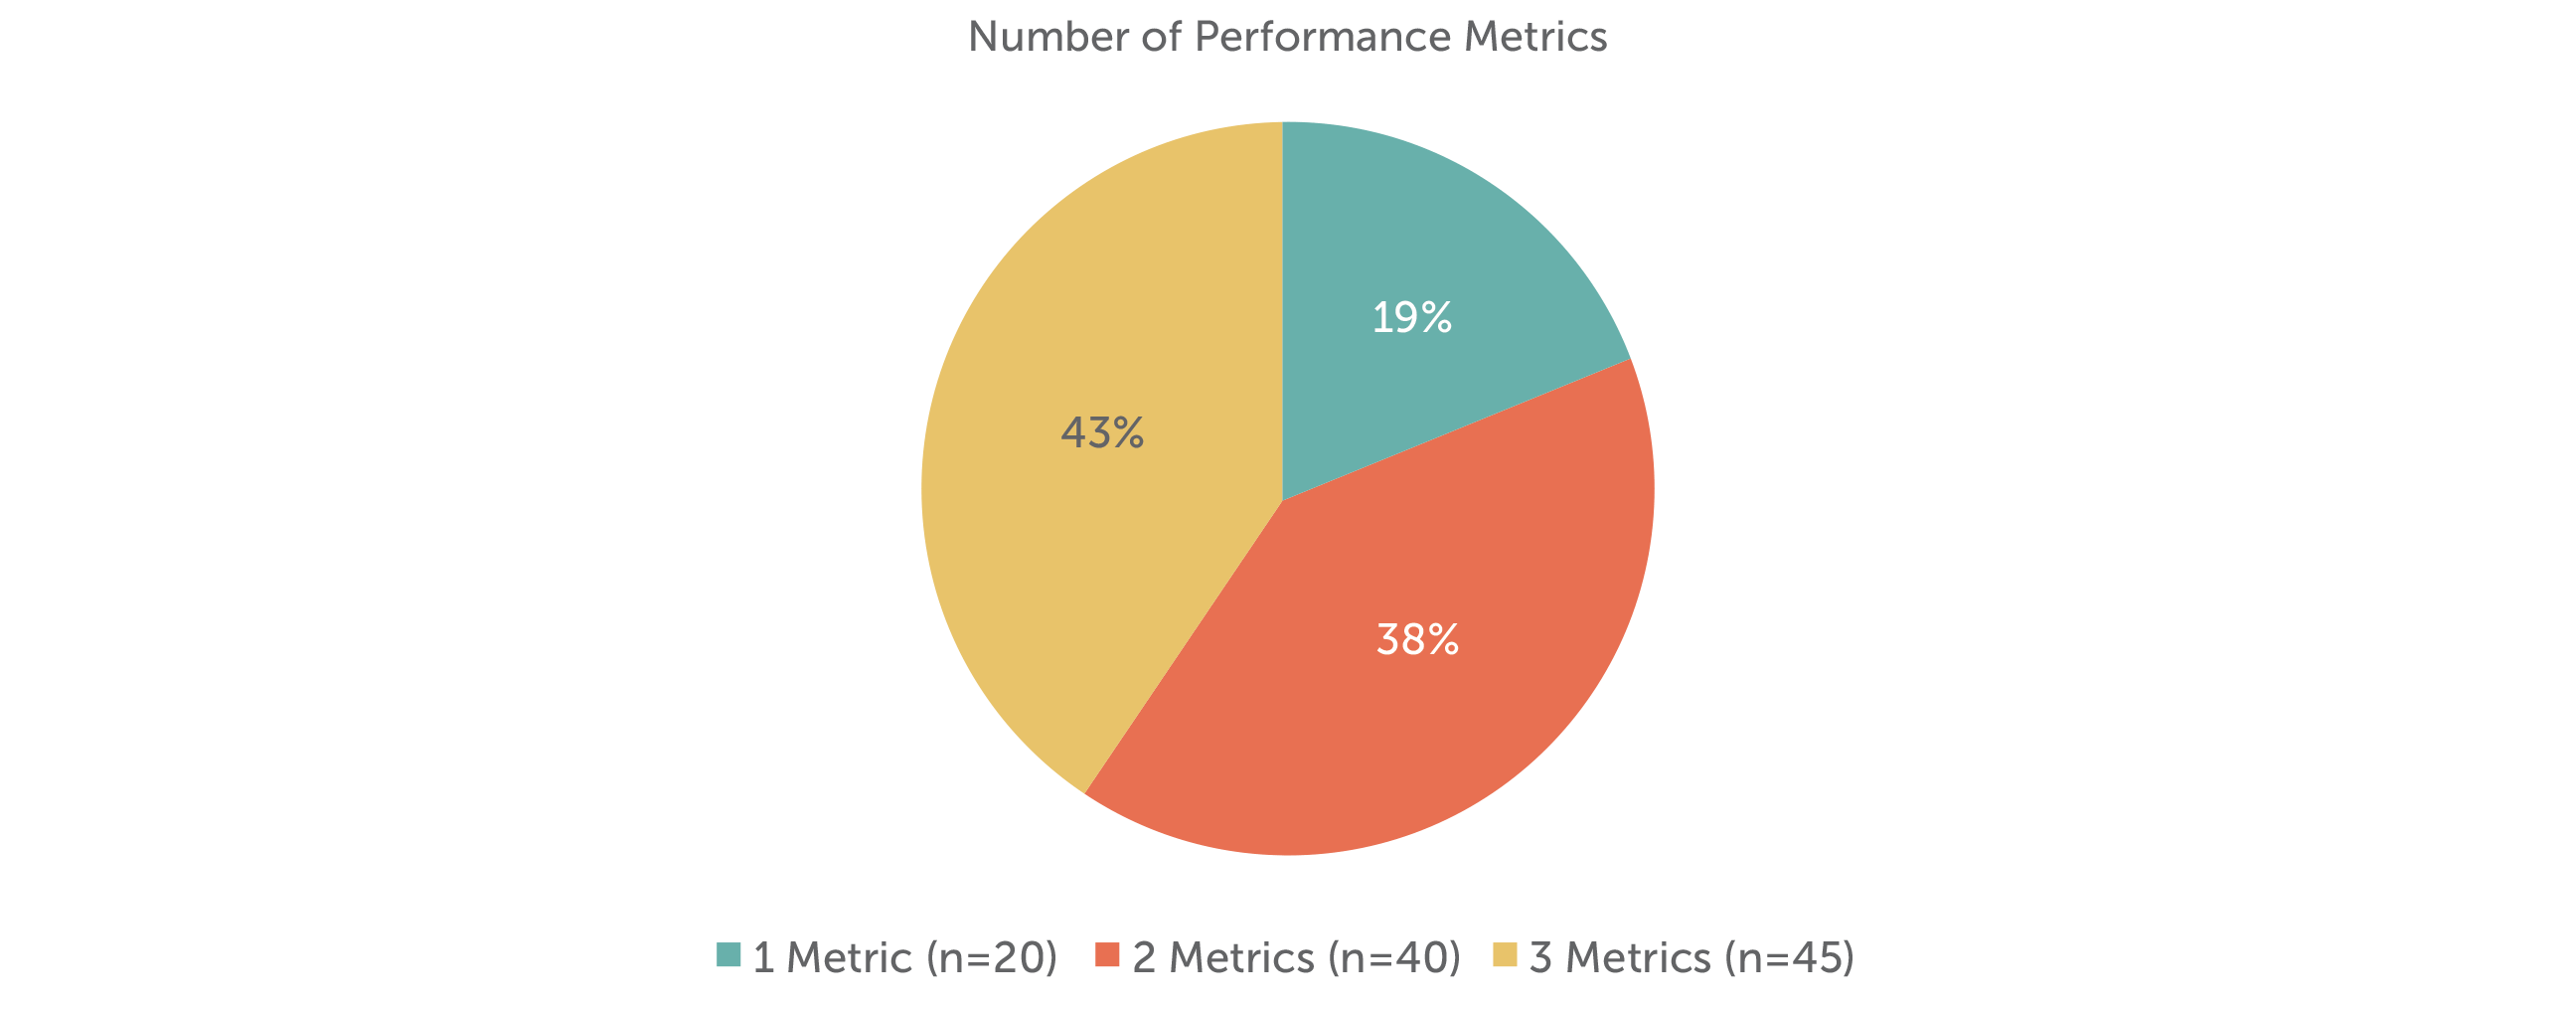
Performance Metrics
Among companies in our study, TSR is the most prevalent performance metric in long-term performance plans and is used by 58% of companies with performance-based awards. Most companies (97%) measure TSR on a relative basis. Among companies that report using TSR, 30% use it as a modifier. In general, TSR is viewed as a shareholder friendly design feature. It also provides a credible way for companies to measure multi-year success, while avoiding the challenges of setting multi-year financial or operational goals.
TSR, however, is an outcome and not a driver of longer-term company success. Relative TSR can also be heavily influenced by a company’s position in the performance cycle. Consequently, most companies (89%) that use TSR as a metric use it in connection with another metric—most commonly, a return metric or EPS.
Return measures are the second most prevalent (53% of companies) type of performance metric, followed by EPS (29%) and Revenue (23%). Companies use these metrics – often in combination – in long-term performance plans to support operational efficiency and/or profitable growth.
When selecting specific performance metrics or modifiers, if any, companies should consider those yardsticks that best support long-term value creation in their industry and align executives’ interests with those of shareholders.
Similar to annual incentive plans, companies tend to use multiple metrics to create balance in their long-term performance plans.
Performance Measurement – Absolute Vs. Relative
Among the companies in our study, 50% use a combination of absolute and relative performance goals in their long-term performance plans. This approach motivates executives to achieve the company’s internal financial goals, while also balancing results relative to comparable companies with similar economic influences. When goals are relative, the goal setting process is substantially simplified.
For the companies utilizing a combination of absolute and relative performance goals in their long-term performance plans, when relative TSR is used, the most common additional measures are EPS, ROI/ROIC, and Revenue. These additional measures are most often measured on an absolute basis.
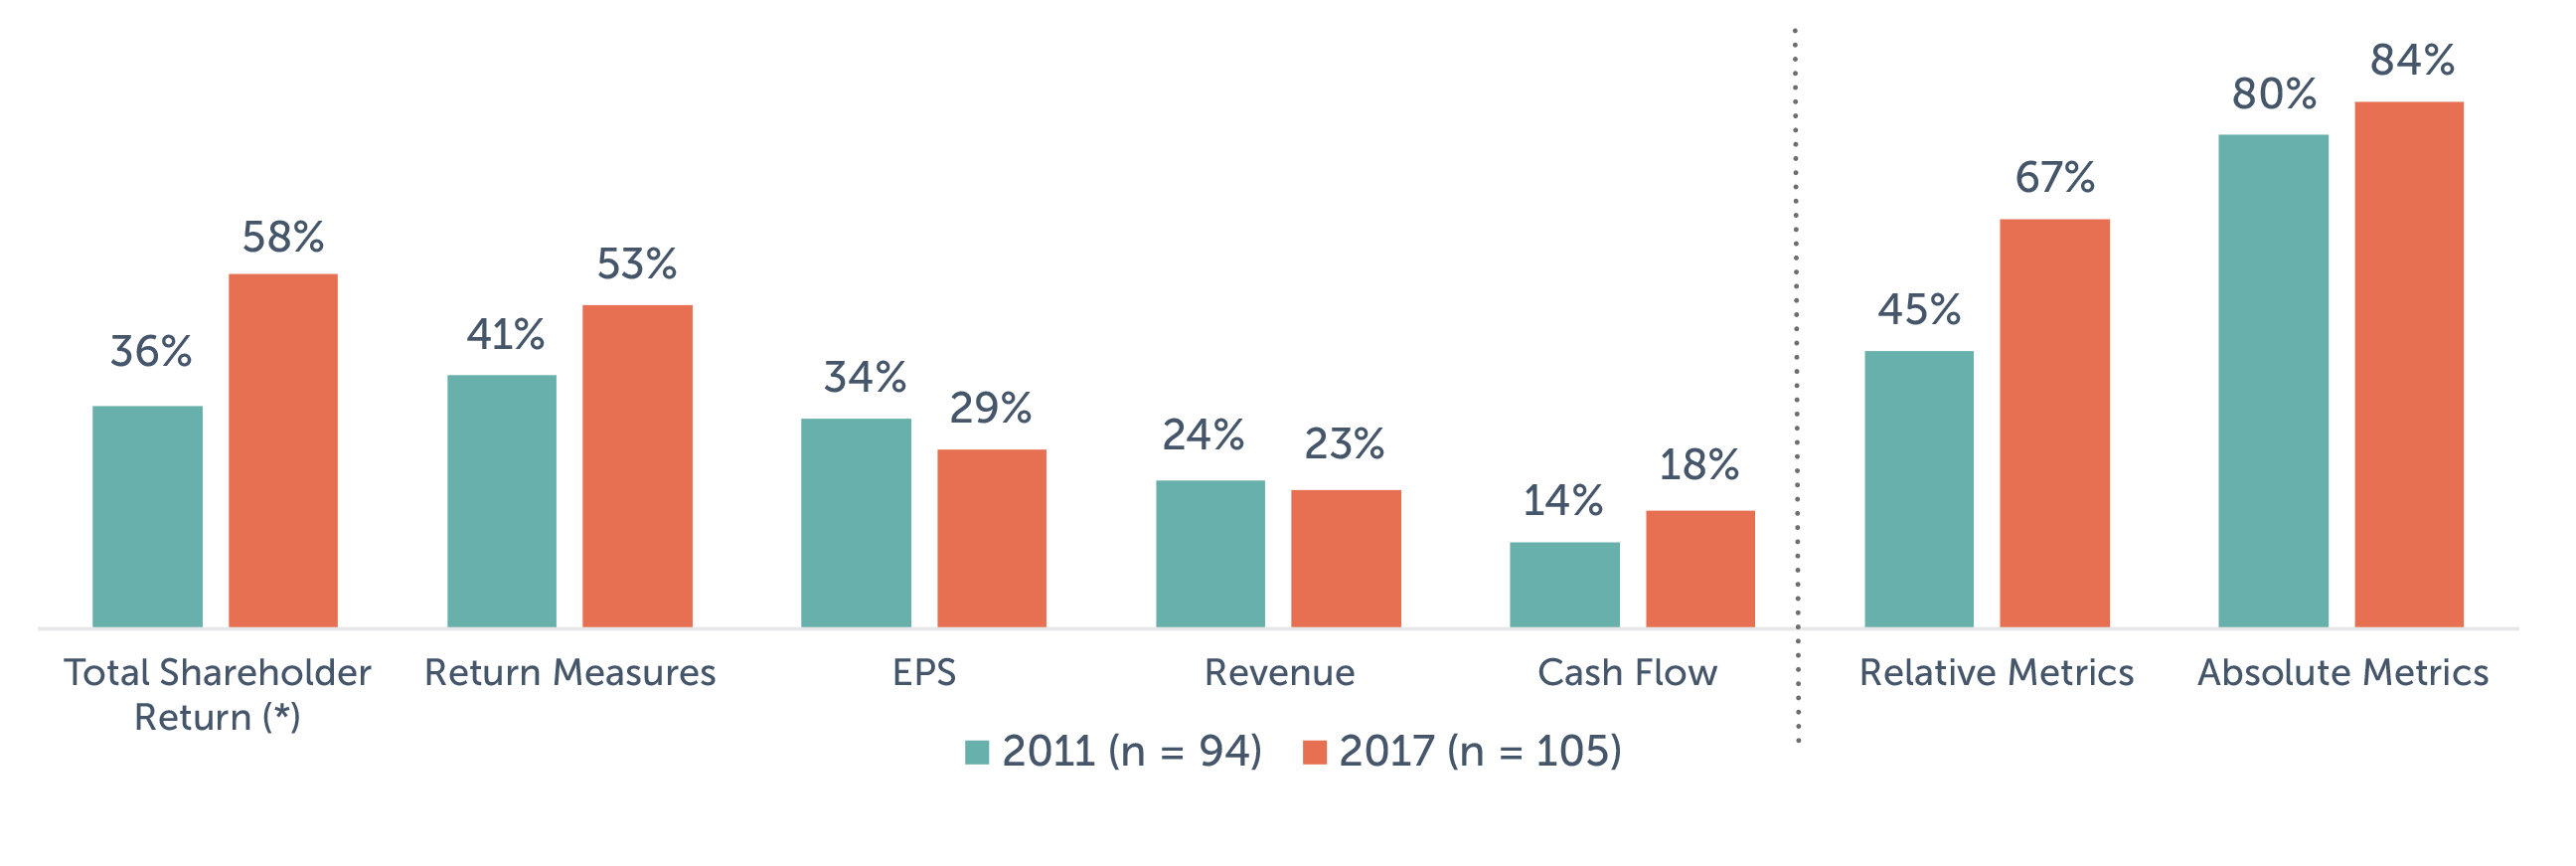
Note: Percentages add to greater than 100% due to multiple responses disclosed by many of the companies.Return measures category is comprised of the following metrics: ROE, ROI, ROIC, and ROA. (*) Approximately 30% of these companies use TSR as an award modifier.
Performance Measurement Period
Among companies that use a long-term performance plan (stock/units or cash), 97% have at least one plan with at least a three-year performance measurement period. Only three companies disclosed having a plan with a shorter measurement period.
Perquisites
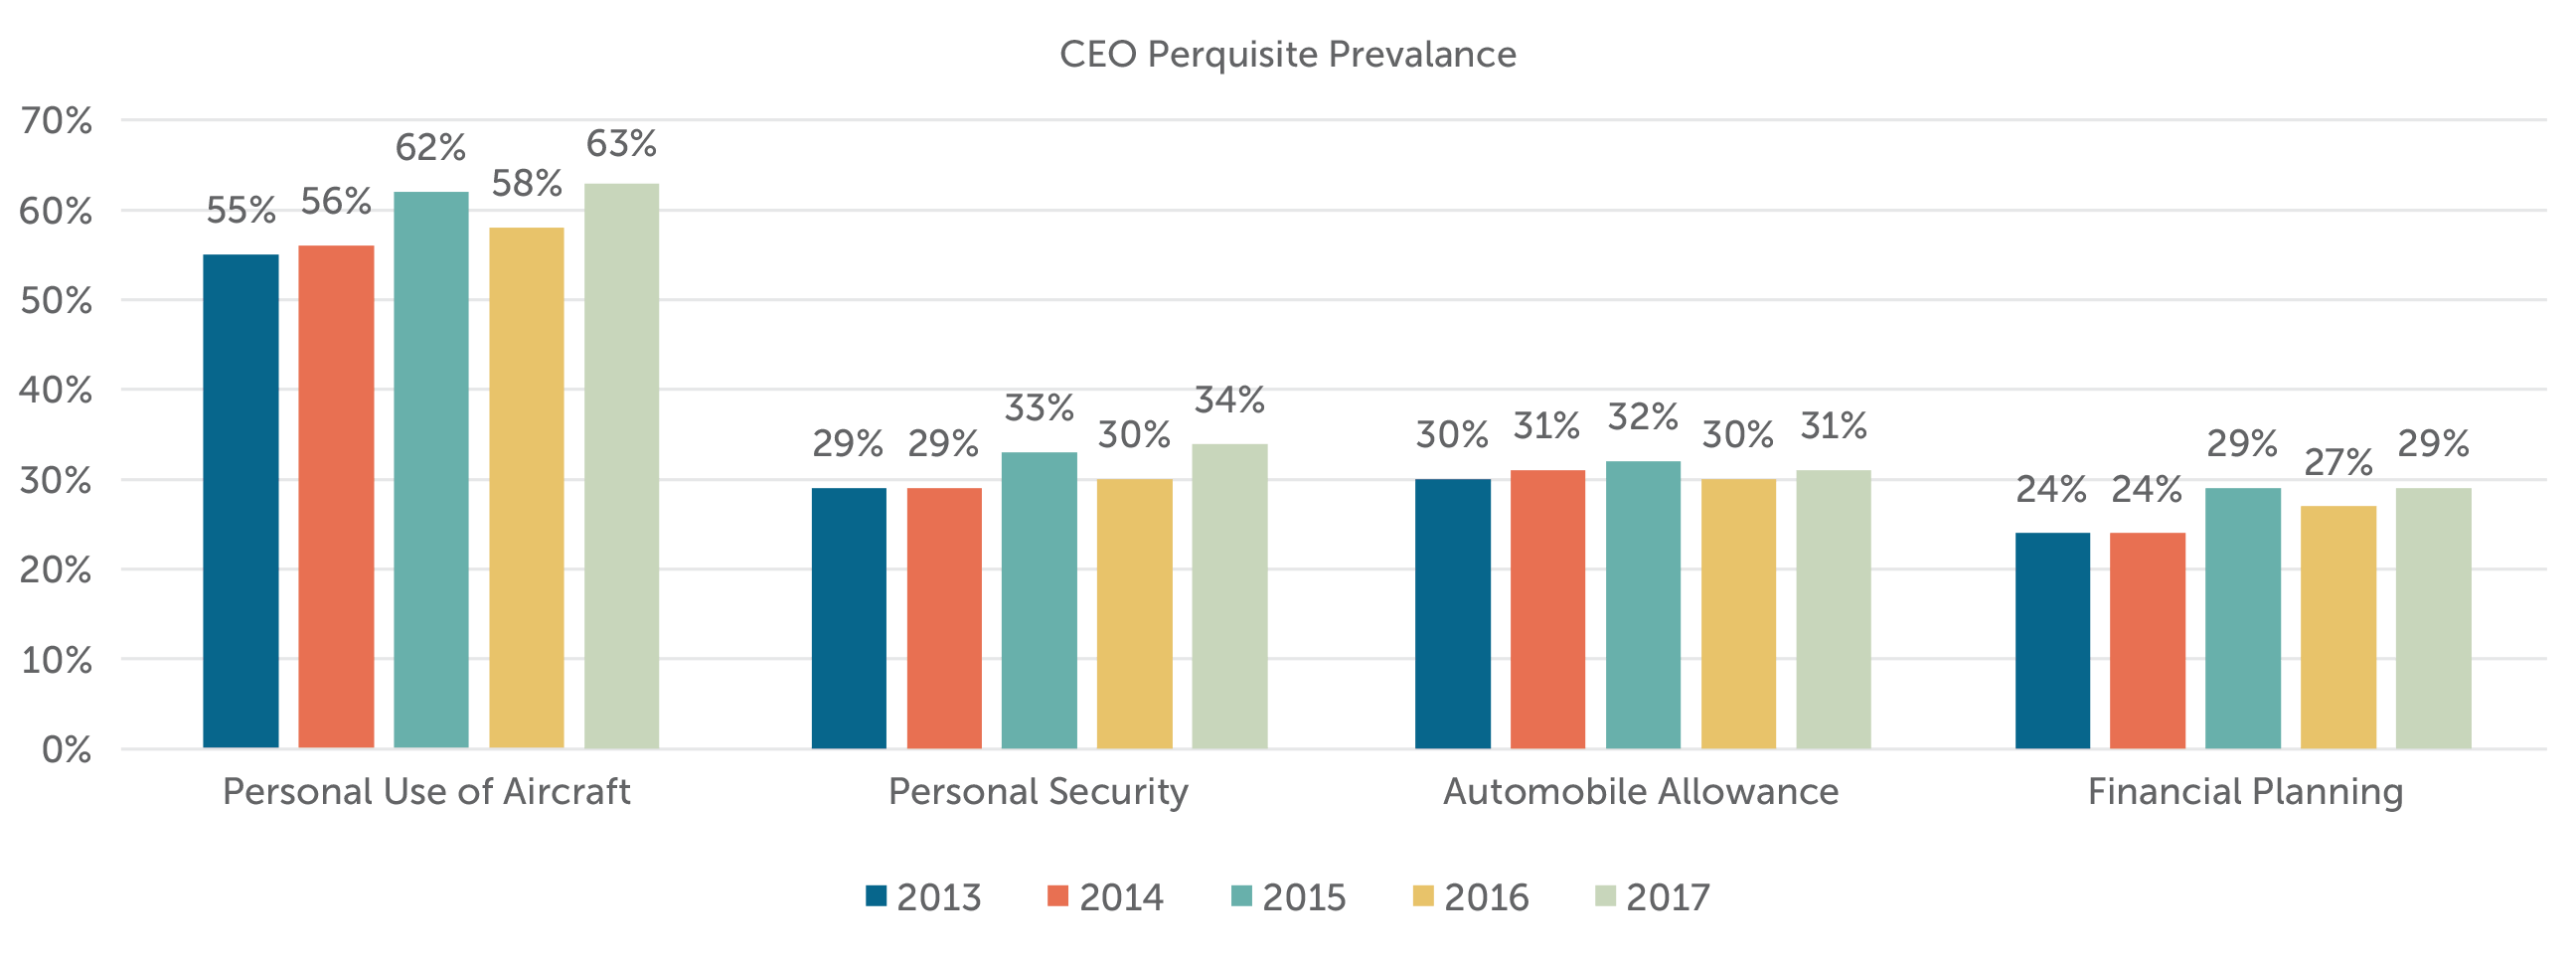
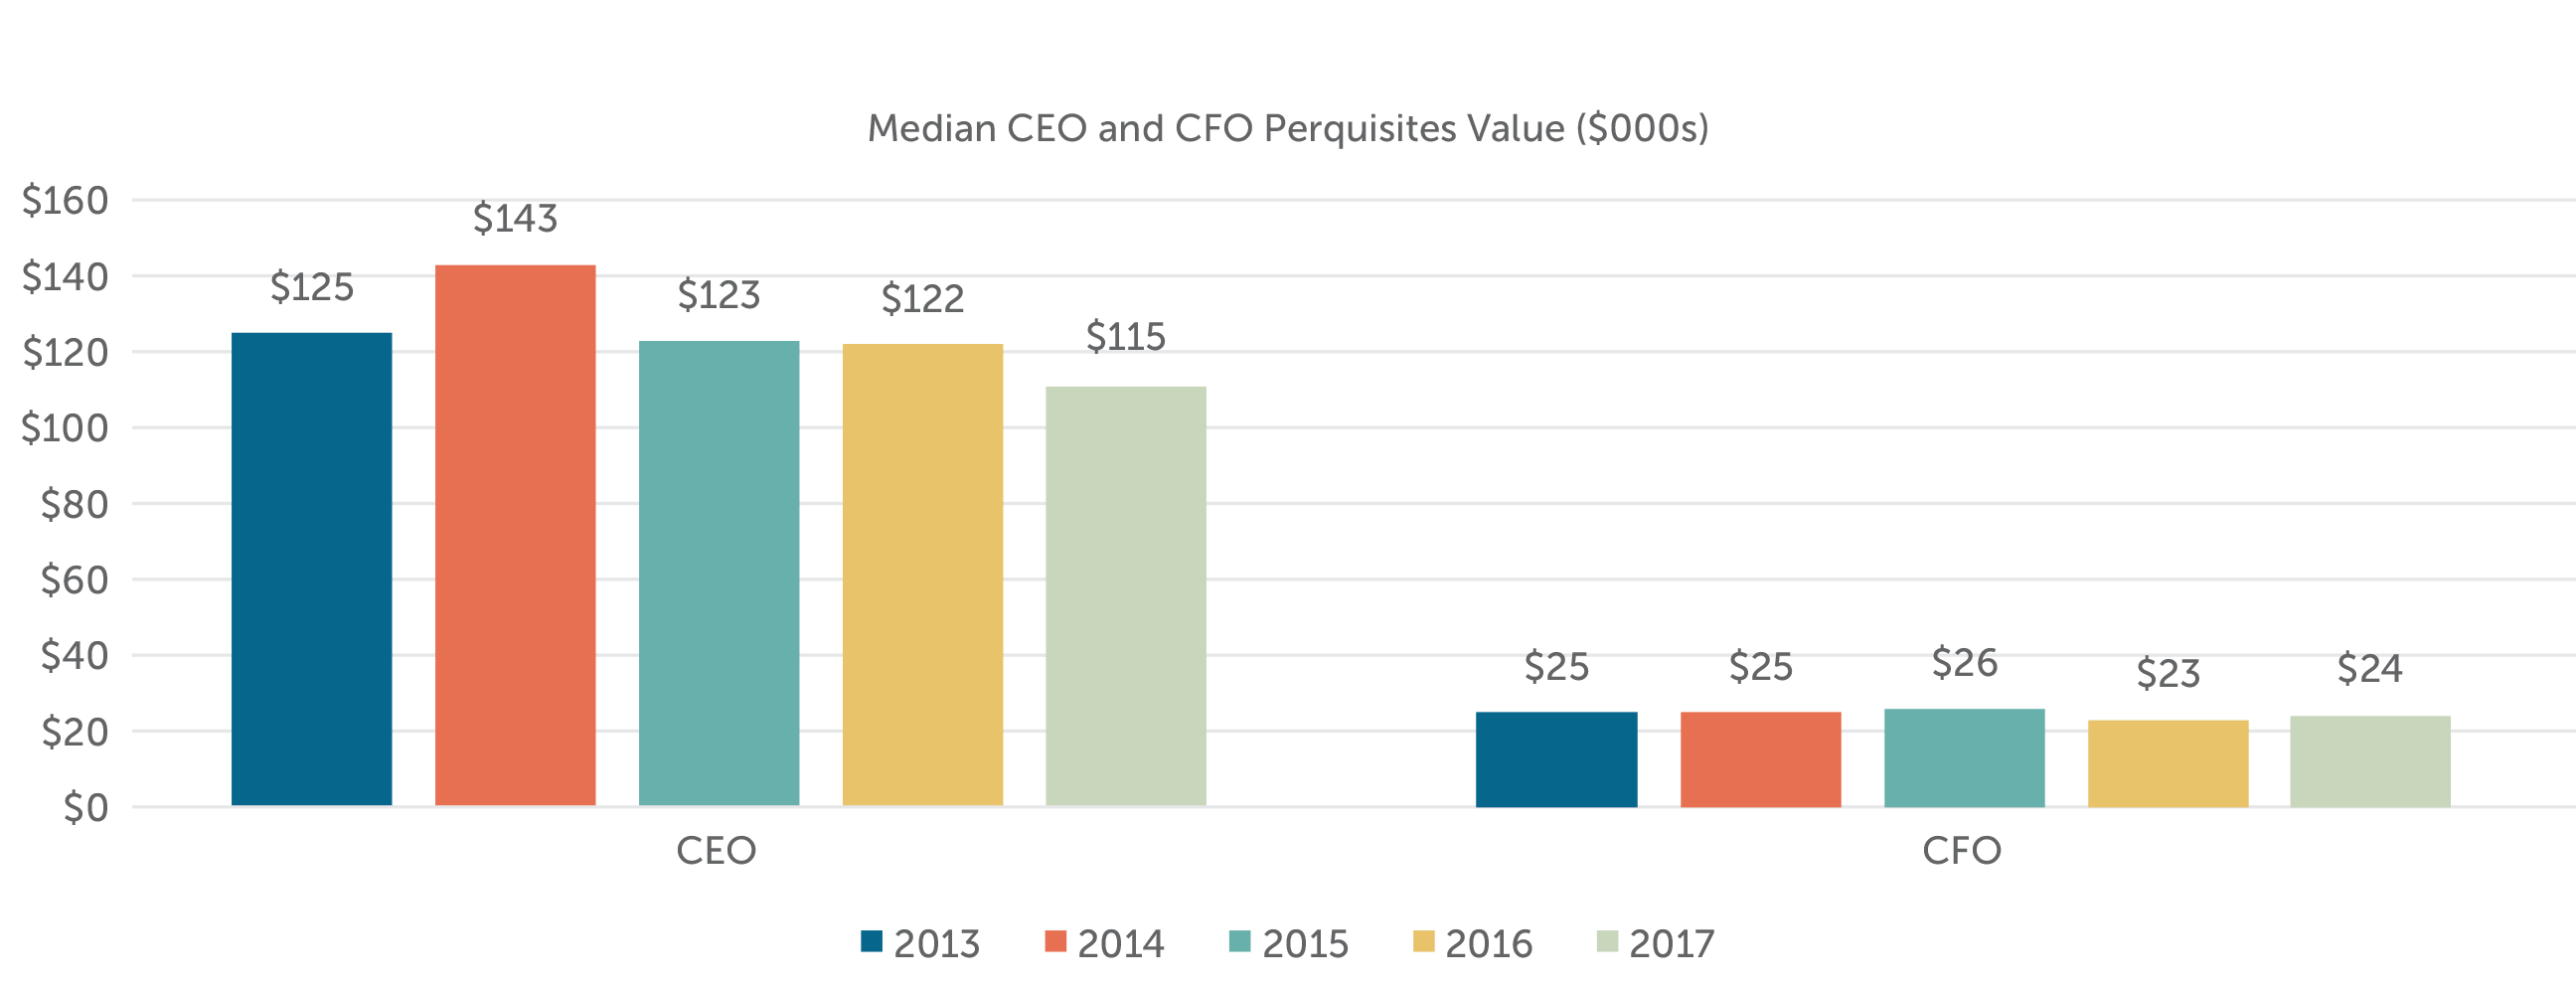
The percentage of companies in our research providing perquisites to their CEO increased from 82% in 2013 to 87% in 2017. The percentage of companies providing perquisites to CFOs was 71% in 2017.
The four most common CEO perquisites in our analysis were: personal use of corporate aircraft (63%), personal security (34%), automobile allowance (31%) and financial planning (29%).
The median total value of perquisites delivered to the CEO and CFO has been relatively flat in recent years. Over the past five years, the median total value of CEO perquisites has ranged from $115,000 to $143,000. Over the same period, CFO total perquisites has ranged from $23,000 to $26,000.
Shareholder Friendly Provisions
Stock ownership guidelines (SOG), hedging, pledging, and clawback policies are very common in publicly traded companies. These policies have grown in popularity due to the influence of legislation, proxy advisor firms, and shareholder scrutiny.
| Stock Ownership Guideline | Hedging | Pledging | Clawback |
| 95% | 96% | 86% | 97% |
In addition to stock ownership guidelines, many companies, particularly larger companies, have instituted stock holding policies. Of the 110 companies studied, 54% require executives to hold shares until the stock ownership guideline requirement is met.
A smaller number of companies (24%) maintain stock holding policies that are independent of stock ownership guidelines or that apply even after the guideline requirement has been achieved. These policies require executives to hold net shares received from equity awards for a period of time ranging from one year to retirement.
| Holding Requirement Until SOG is Met | Holding Requirement Separate from or After SOG is Met | Holding Period for Separate/Post-SOG Requirements (n=26) | ||
| 1 Year | 5 Years | Until
Retirement |
||
| 54% | 24% | 69% | 4% | 27% |
For questions or more information, please contact:
Melissa Burek Partner
[email protected] 212-921-9354
Lauren Peek Principal
[email protected] 212-921-9374
Bryan Roberts Senior Associate
[email protected] 713-559-2716
Michael Bonner Senior Associate
[email protected] 646-486-9744