


DOWNLOAD A PDF OF THIS REPORT pdf(0.2MB)
Contact
Matthew VnukPartner [email protected] 212-921-9364 Margaret Engel
Partner Emeritus [email protected] 212-921-9353
Industry Context
The retail industry is facing challenges, with many companies experiencing stagnant or declining sales, store closures, layoffs and even bankruptcy. The industry is benefiting from favorable macroeconomic factors: consumer confidence index increasing for 8 years in a row with the 2017 index at the highest point in the last 15 years; continued increases in per capita disposable income; a low interest rate environment; and low unemployment. Yet, the downward pressure on revenues and margin deterioration in the industry has continued, driven by the intense competition from e-commerce retailers, such as Amazon, and lackluster performance of brick and mortar stores. The growth in e-commerce has forced many companies to invest in their online sales channels to compete and grow, while the shift to online sales often forces retailers to provide discounts to attract consumers and at the same time face increasing shipping costs. With this challenging environment as a backdrop, our report will focus on pay versus performance and incentive design among 33 companies.
Multi-Line Retail (Median Revenue ~$70B)
- Big Lots, Inc.
- Costco Wholesale Corporation
- CVS Health Corporation
- J. C. Penney Company, Inc.
- Kohl’s Corporation
- Kroger Co.
- Macy’s, Inc.
- Rite Aid Corporation
- Target Corporation
- Walgreens Boots Alliance, Inc.
- Wal-Mart Stores, Inc.
Big Box Retail (Median Revenue ~$13B)
- Bed Bath & Beyond Inc.
- Best Buy Co., Inc.
- Dick’s Sporting Goods, Inc.
- DSW Inc.
- Home Depot, Inc.
- Lowe’s Companies, Inc.
- Michaels Companies, Inc.
- Ross Stores, Inc.
- Staples, Inc.
- TJX Companies, Inc.
- Tractor Supply Company
Mall-Based Specialty Retail (Median Revenue ~$4B)
- Abercrombie & Fitch Co.
- American Eagle Outfitters, Inc.
- Express, Inc.
- Finish Line, Inc.
- Foot Locker, Inc.
- Gap, Inc.
- Guess?, Inc.
- L Brands, Inc.
- Tiffany & Co.
- Urban Outfitters, Inc.
- Williams-Sonoma, Inc.
Financial Results and Total Shareholder Return (TSR)
Among our sample, median revenue was up 2% versus the prior year, while operating income declined versus the prior year (-2%). Financial performance varied by segment:
- Multi-Line retail had flat revenues with a modest decrease in operating income (-2%). The decrease in profits was partly driven by the increased competition from e-commerce sites.
- Big Box retail performed better than the other segments on both revenue (+7%) and operating income (+4%) growth. Companies that focus primarily on one product category continued to grow, despite the pressure from e-commerce competition.
- Mall-Based Specialty retail saw a minor increase in 2016 revenues of +2% (lower than the +4% growth experienced in 2015) and had the largest decrease in operating income between the three segments (-7%). The decrease in profits was in part driven by deteriorating margins and increased pressure to offer discounts to consumers in a declining mall traffic environment.
In terms of shareholder returns, most of the companies in the sample experienced stock price declines during 2016. Dividend payouts offset the declining stock prices resulting in a modest (+1%) TSR. The retail industry significantly underperformed the companies in the S&P 500, where the median TSR was +13% for 2016. Prior to the presidential election, TSR for most retailers was negative. Stock prices reversed course after the win of the Republican ticket. Expectations for a stronger economy and tax reform bolstered stock prices.
| 1-Year Revenue Growth (2016) | 1-Year Operating Income (2016) | Median TSR | |||
| Pre-Election (1/1/16 – 11/8/16) | Post-Election (11/9/16 – 12/31/16) | 2016 (1/1/16 – 12/31/16) | |||
| Multi-Line (n=11) | 1% | -2% | -3% | 6% | 5% |
| Big Box Specialty (n=11) | 7% | 4% | -3% | 5% | 1% |
| Mall-Based Specialty (n=11) | 2% | -7% | 4% | -10% | -5% |
| CAP Total Sample (n=33) | 2% | -2% | -3% | 2% | 1% |
CEO Compensation
Pay vs. Performance
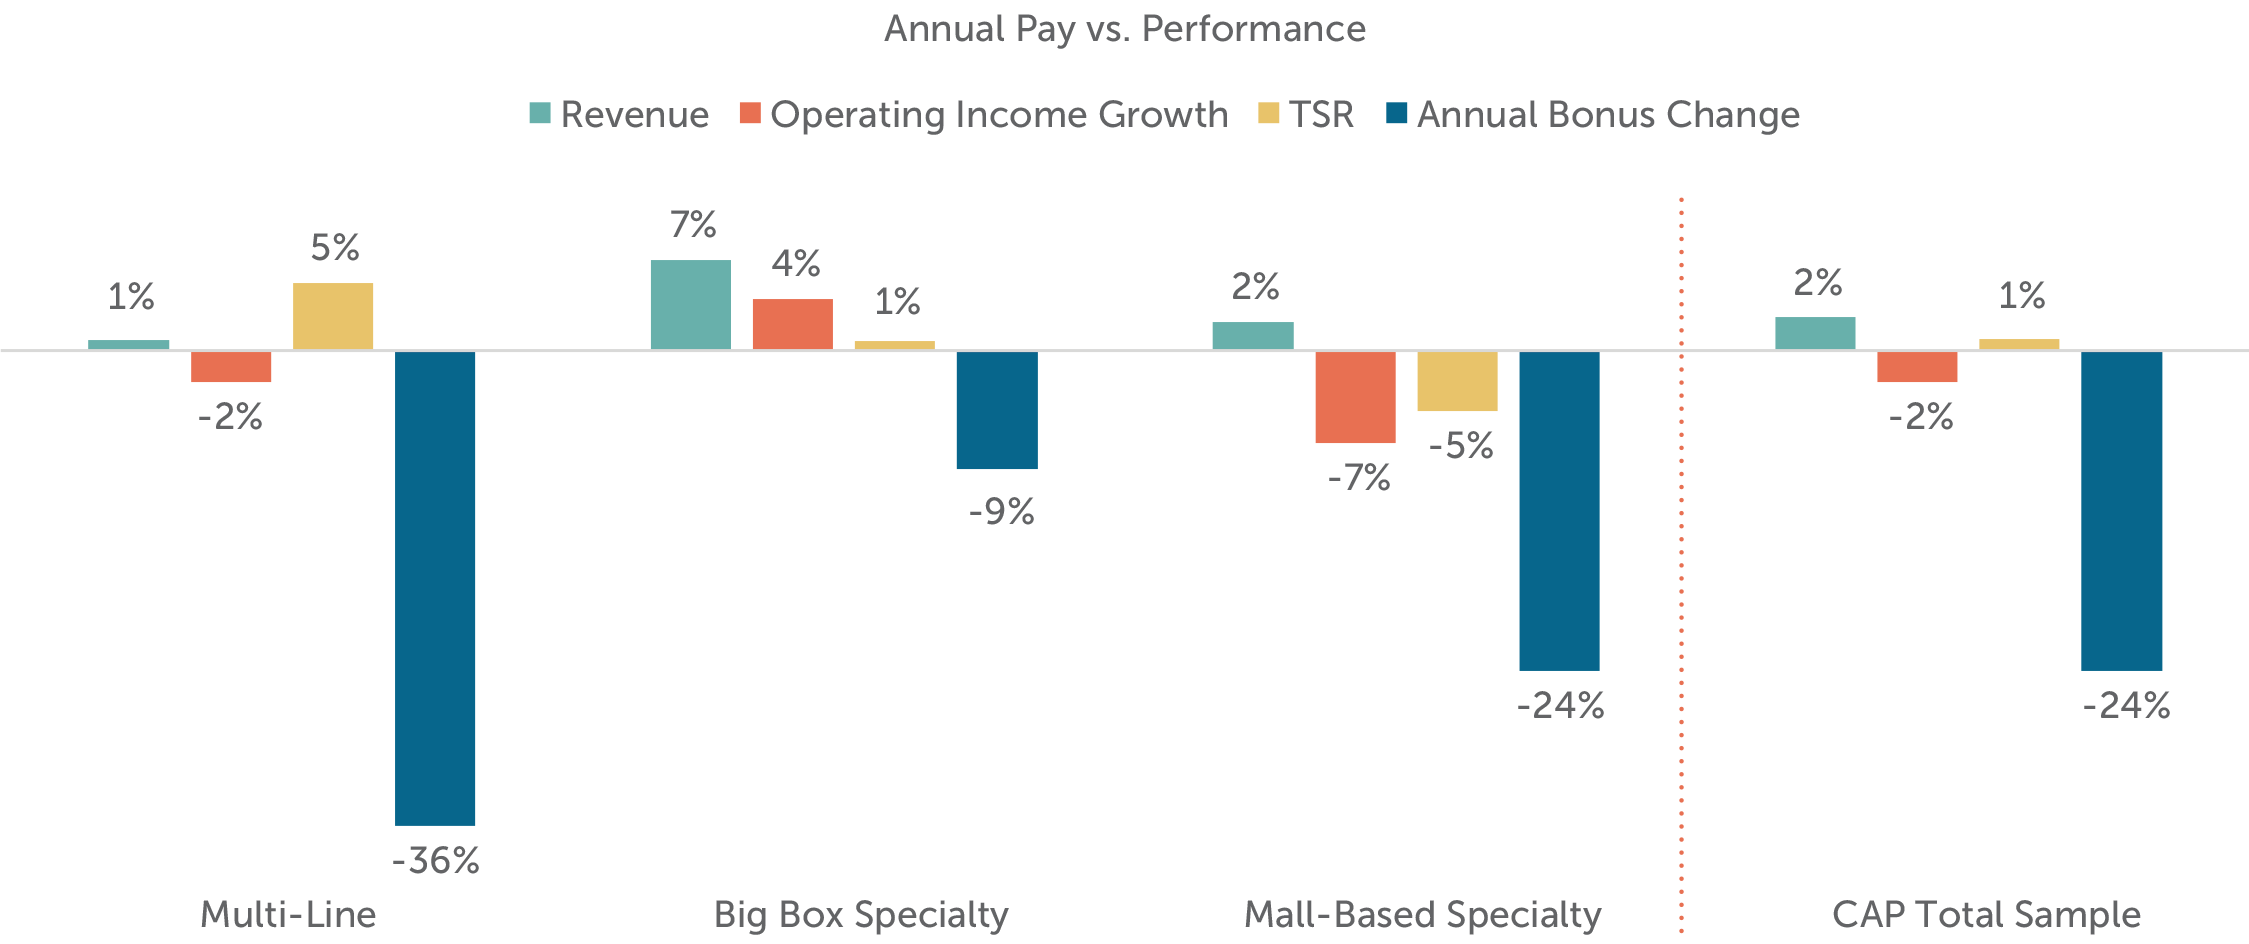
Multi-Line: Highest median decrease in year-over-year bonus between the 3 segments studied; however, performance was almost flat for 2016. The decreases in bonuses were driven by lower than expected growth as 2014-2015 performance was much stronger (e.g., +9% growth in operating income).
Big Box Specialty: Even though this segment performed better than the other two segments, bonuses were down 9%. Similar to the companies in the Multi-Line segment, 2014-2015 performance was also better for these companies (e.g., +9% growth in operating income).
Mall-Based Specialty: Bonus payouts were generally down reflecting weak 2016 performance. Like the other two segments, 2016 performance was weaker then 2015 performance in terms of revenue and operating income growth (e.g., -1% growth in operating income).
Median Change in CEO Compensation (2016 vs. 2015)
| Compensation Element | Multi-Line | Big Box Specialty | Mall-Based Specialty | Total Sample |
| Base Salary | +1% | 0% | 0% | 0% |
| Actual Bonus | -36% | -9% | -24% | -24% |
| Long Term Incentive | +5% | 0% | +4% | +4% |
| Total Direct Compensation | +1% | -3% | -1% | 0% |
Unlike bonus payouts, the median change in total awarded pay (salary, bonus and long-term incentives) was flat compared to prior year, which was generally aligned with the industry performance in terms of Revenue growth, Operating Income growth, and TSR. The decreases in bonuses were offset by modest increases in long-term incentives that, on average, accounted for 65% of total CEO pay.
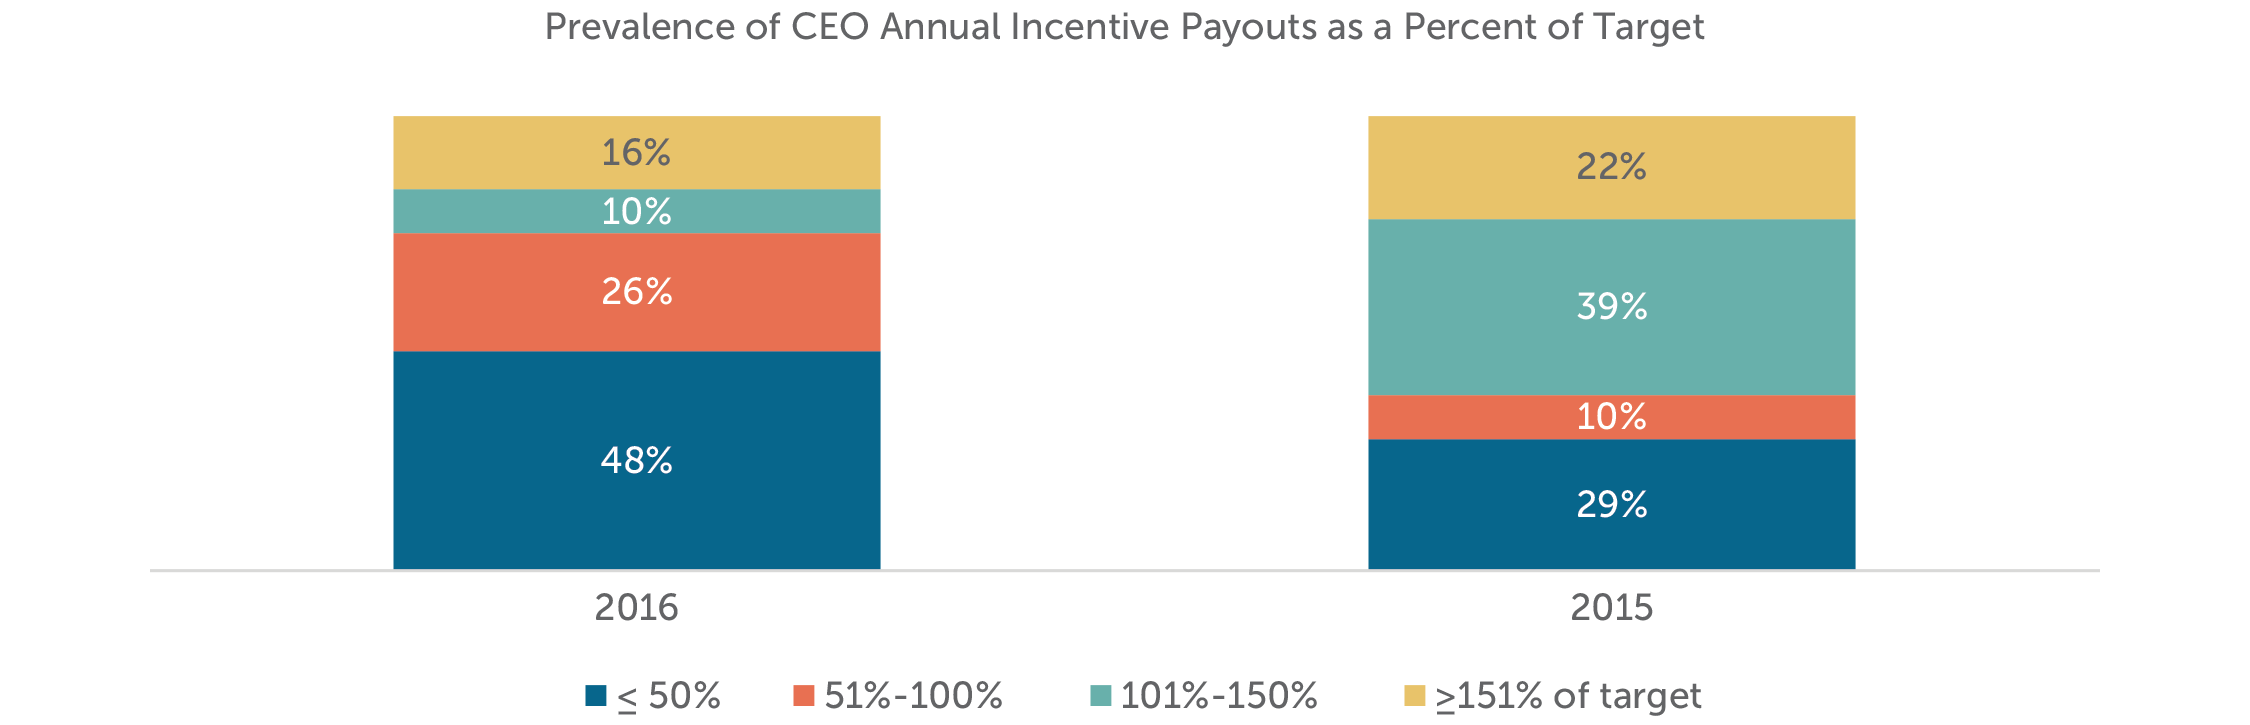
Actual Bonuses as a Percentage of Target
As discussed above, annual bonus payouts were lower in 2016. At median, across our sample, actual bonus payouts as percent of target was 112% in 2015 compared to only 51% of target in 2016. Additionally, above target payouts declined significantly in 2016 with only one-quarter of companies paying bonuses at or above target.
| Summary Statistics | Annual Incentive Payout as a % of Target | |
| 2016 | 2015 | |
| 75th Percentile | 98% | 145% |
| Median | 51% | 112% |
| 25th Percentile | 16% | 32% |
Target Compensation Mix for CEOs
Overall, CEO pay mix in our sample was aligned with the broader U.S. market. Within the retail industry, the Mall-Based Specialty retail companies tend to place a greater emphasis on annual compensation (salary + bonus) compared to other retail companies studied (i.e., 46% vs. 29% of total pay). This is in part driven by lower long-term incentive levels as these companies are smaller in terms of revenue and market capitalization compared to the other retail companies in our sample.
| Average CEO Target Pay Mix | |||
| Salary | Target Bonus | LTI | |
| Multi-Line (n=11) | 10% | 16% | 74% |
| Big Box Specialty (n=11) | 15% | 18% | 67% |
| Mall-Based Specialty (n=11) | 14% | 32% | 54% |
| CAP Total Sample (n=33) | 13% | 22% | 65% |
| General Industry | 10% | 20% | 70% |
Pay Practices
Annual Incentive Performance Metrics
Among CAP’s retail sample, operating income and revenue were the most common financial performance metrics. All companies with a bonus plan used at least one measure of profitability (operating income, net income, EPS, pre-tax income or EBITDA) and 40% of the companies used profitability as the sole metric in the bonus plan.
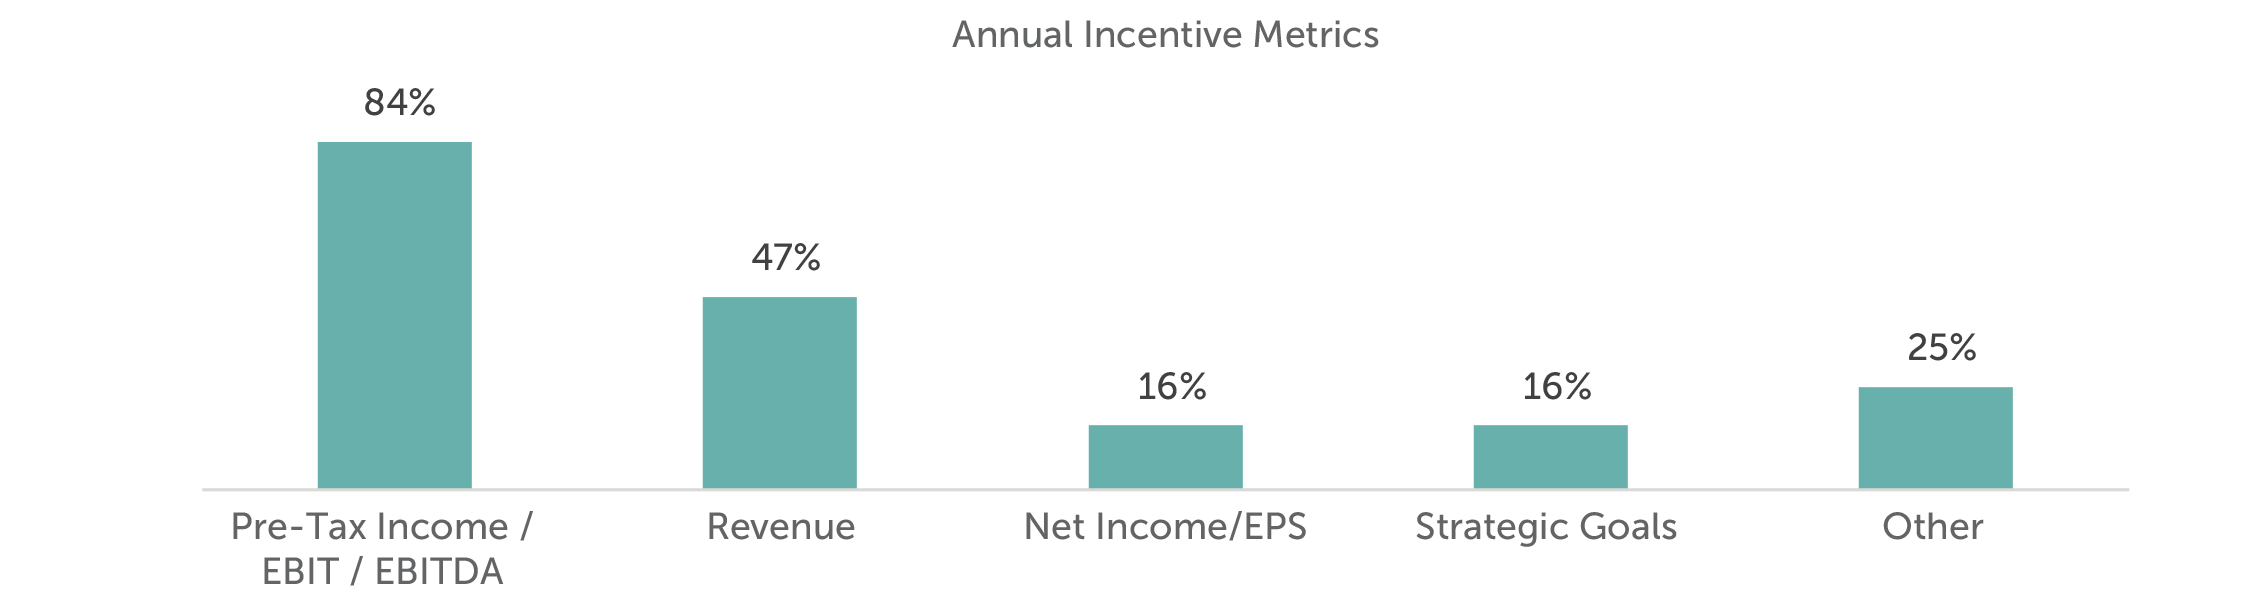
Other metrics include: cash flow, inventory turns, SG&A savings, customer satisfaction, cost savings, individual goals, and gross profit.
Long-Term Incentive Mix
Long-term incentive mix varied slightly by segment, particularly in the use of stock options and time-based restricted stock units. Stock options were used by at less than half of multi-line retail companies and were most prevalent among big box retail companies. All three segments provided similar levels of long-term performance plan awards, with an average of at least 50% of total long-term incentive denominated in performance plans for CEOs.
| Average CEO LTI Mix | |||
| Stock Options | RS / RSUs | Performance Plan | |
| Multi-Line (n=11) | 14% | 31% | 56% |
| Big Box Specialty (n=11) | 31% | 19% | 50% |
| Mall-Based Specialty (n=11) | 22% | 24% | 54% |
| CAP Total Sample (n=33) | 22% | 25% | 53% |
Long-Term Incentive Performance Measures
The most prevalent metrics in long-term performance plans were profitability measures and relative TSR. Approximately 85% of companies used either one or two metrics in their long-term plans with the rest using three measures. Return measures were not as common as other industries, but we believe that they will become more prevalent as institutional shareholders have expressed great interest in including such metrics in long-termincentive plans.
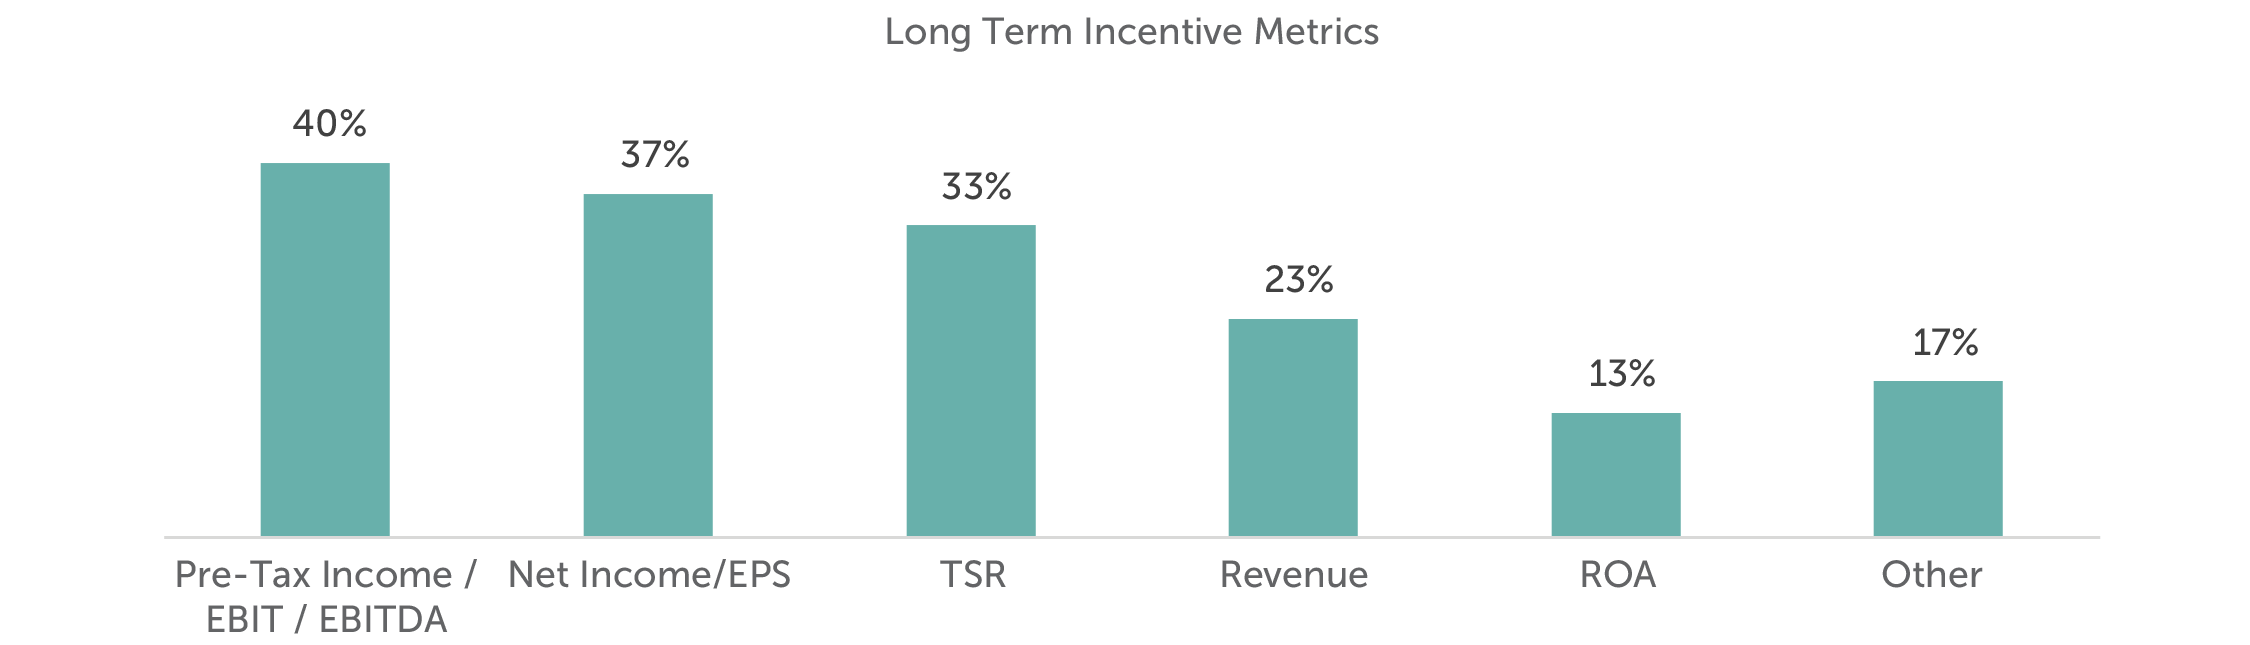
Other performance metrics include: cash flow, market share, operating margin, and strategic goals.
Outlook
What’s next for compensation in the retail industry? We expect intense competitive pressure to continue, with opportunities for major disruption from the entry of new players and the continued shift to e-commerce. Strategic transformation will be necessary and some retailers will not survive the challenge. All that being said, attraction and retention of key executive talent will be even more important going forward.
For questions or more information, please contact:
Margaret Engel Partner [email protected]
212-921-9353
Matt Vnuk Principal [email protected]
212-921-9364
Roman Beleuta Senior Associate [email protected]
646-532-5932
Matt McLaughlin Associate [email protected]
646-486-9747
Robert Martin and Rebecca Wertman provided research assistance for this report.