DOWNLOAD A PDF OF THIS REPORT pdf(0.1MB)
Contact
Shaun BismanPartner [email protected] 212-921-9365 Daniel Laddin
Founding Partner [email protected] 212-921-9359
CAP’s Industry Report summarizes 2016 Chief Executive Officer (CEO) compensation relative to 2016 company performance, as well as incentive compensation practices, for a sample of 19 large U.S.-based Consumer Product companies.
2016 Company Performance
2016 was a mixed performance year for the companies in CAP’s Consumer Products sample. While profitability improved, total shareholder return (TSR) underperformed the broader market.
GAAP revenue for CAP’s sample decreased -1% at median during 2016, following a -2% decrease in 2015. The continued strengthening of the U.S. dollar has contributed to FX headwinds for the companies in CAP’s sample, as they have significant international exposure – on a consolidated basis, 45% of fiscal 2016 revenue was generated overseas. Adjusted revenue, a common incentive plan performance metric, which is generally reported on an FX-neutral basis, increased +3% and +4% at median in 2016 and 2015, respectively.
Operating margin (defined as earnings before interest and taxes, or EBIT, divided by revenue) and earnings per share (EPS) growth improved year-over-year on both a GAAP and adjusted basis. Continued focus on cost savings and productivity has helped to boost profitability among companies in CAP’s Consumer Products sample. Industry consolidation and improvements in product mix have also contributed to margin expansion.
For the full year 2016, median TSR for companies in CAP’s Consumer Products sample was +5%, below the median TSR for the S&P 500 of +13%. Companies in CAP’s sample did not experience the same post-election stock price rally enjoyed by the broader market. Through November 8, 2016, the median TSR for CAP’s sample kept pace with the median TSR for the S&P 500 +10% to +8%, respectively. During the remainder of the year, however, median TSR for CAP’s sample was -1%, while the median TSR for the S&P 500 was +4%.
| Year | Median Financial Performance for CAP’s Consumer Products Sample | |||||
| Revenue Growth | Operating Margin | EPS Growth | ||||
| GAAP | Adjusted | GAAP | Adjusted | GAAP | Adjusted | |
| 2016 | -1% | +3% | 16% | 18% | +8% | +12% |
| 2015 | -2% | +4% | 15% | 16% | +4% | +4% |
| Y/Y Change | +1% pts | -1% pts | +1% pts | +2% pts | +4% pts | +8% pts |
| Group | Median TSR – CAP’s Consumer Products Sample vs. S&P 500 | |||
| 2015 | 2016 | |||
| 1/1 to 11/8 | 11/9 to 12/31 | Full Year | ||
| CAP’s Consumer Products Sample | +17% | +10% | -1% | +5% |
| S&P 500 | +1% | +8% | +4% | +13% |
Annual Incentive Payouts for CEOs
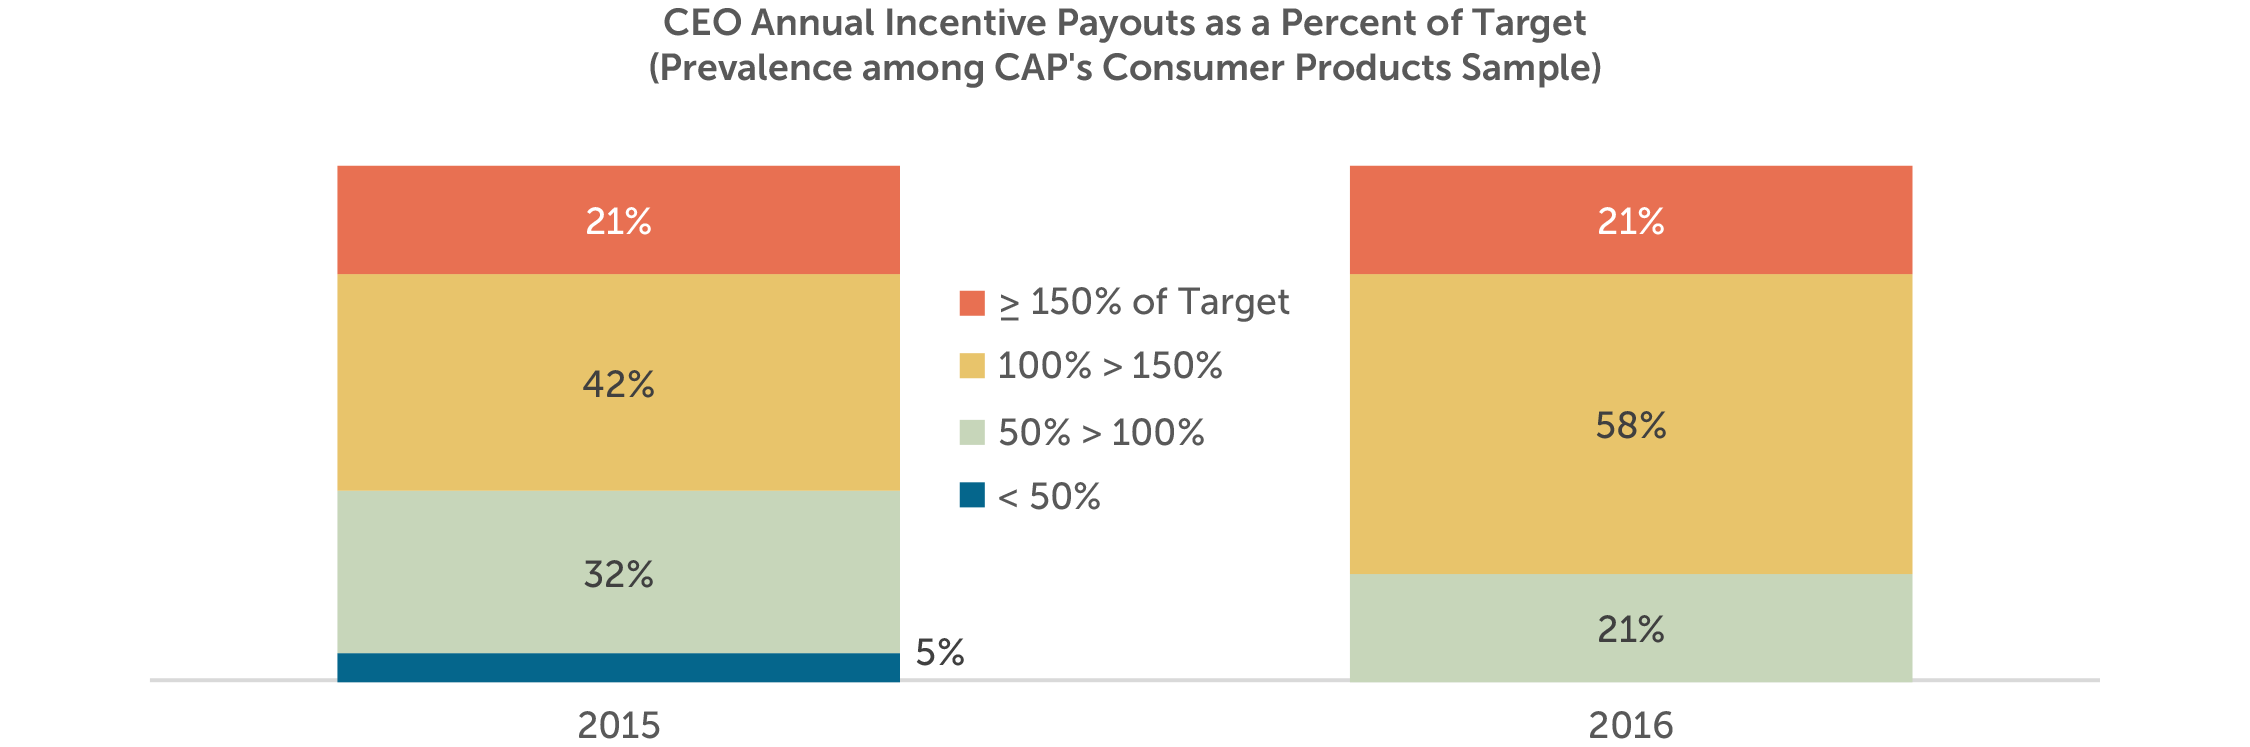
At median, annual incentives for 2016 performance paid out at 117% of target, essentially unchanged from 2015 (118%). 75th percentile payouts were similarly flat – 140% for 2016, compared to 147% for 2015. However, payouts increased dramatically at the low end of the range, as the 25th percentile payout jumped from a below-target 74% for 2015, to an above-target 109% for 2016. More than a quarter of the companies in CAP’s Consumer Products sample paid an above-target bonus for 2016, after paying a below-target bonus for 2015.
| Summary Statistic | CEO Annual Incentive Payouts as a Percent of Target | |
| 2015 | 2016 | |
| 75th Percentile | 147% | 140% |
| Median | 118% | 117% |
| 25th Percentile | 74% | 109% |
Consistent with the year-over-year trend in payouts as a percent of target, 2016 payouts on a dollar value basis were unchanged from 2015, which is generally aligned with adjusted financial performance which was unchanged year-over-year.
Changes in CEO Target Compensation
The median change in target total direct compensation (defined as the sum of base salary, target annual incentive, and long-term incentives) was 5% from 2015 to 2016, driven primarily by increases in variable compensation: the median increase in long-term incentive award values was 5% and the median increase in target annual incentive award values was 3%.
For 2016, just over half of the CEOs in CAP’s Consumer Products sample received a base salary increase. The median increase was 2%.
In reaction to external pressure, boards of directors are increasing CEOs’ accountability for sustained performance. To that end, boards are turning to long-term incentives to reward executives, often in lieu of increases to annual incentives and base salaries.
| Compensation Element | 2015-16 Median Change in CEO Compensation |
| Base Salary | 2% |
| Target Annual Incentive Award Value | 3% |
| Long-Term Incentive Award Value | 5% |
| Target Total Direct Compensation | 5% |
Incentive Compensation Practices: Annual and Long-Term Incentives
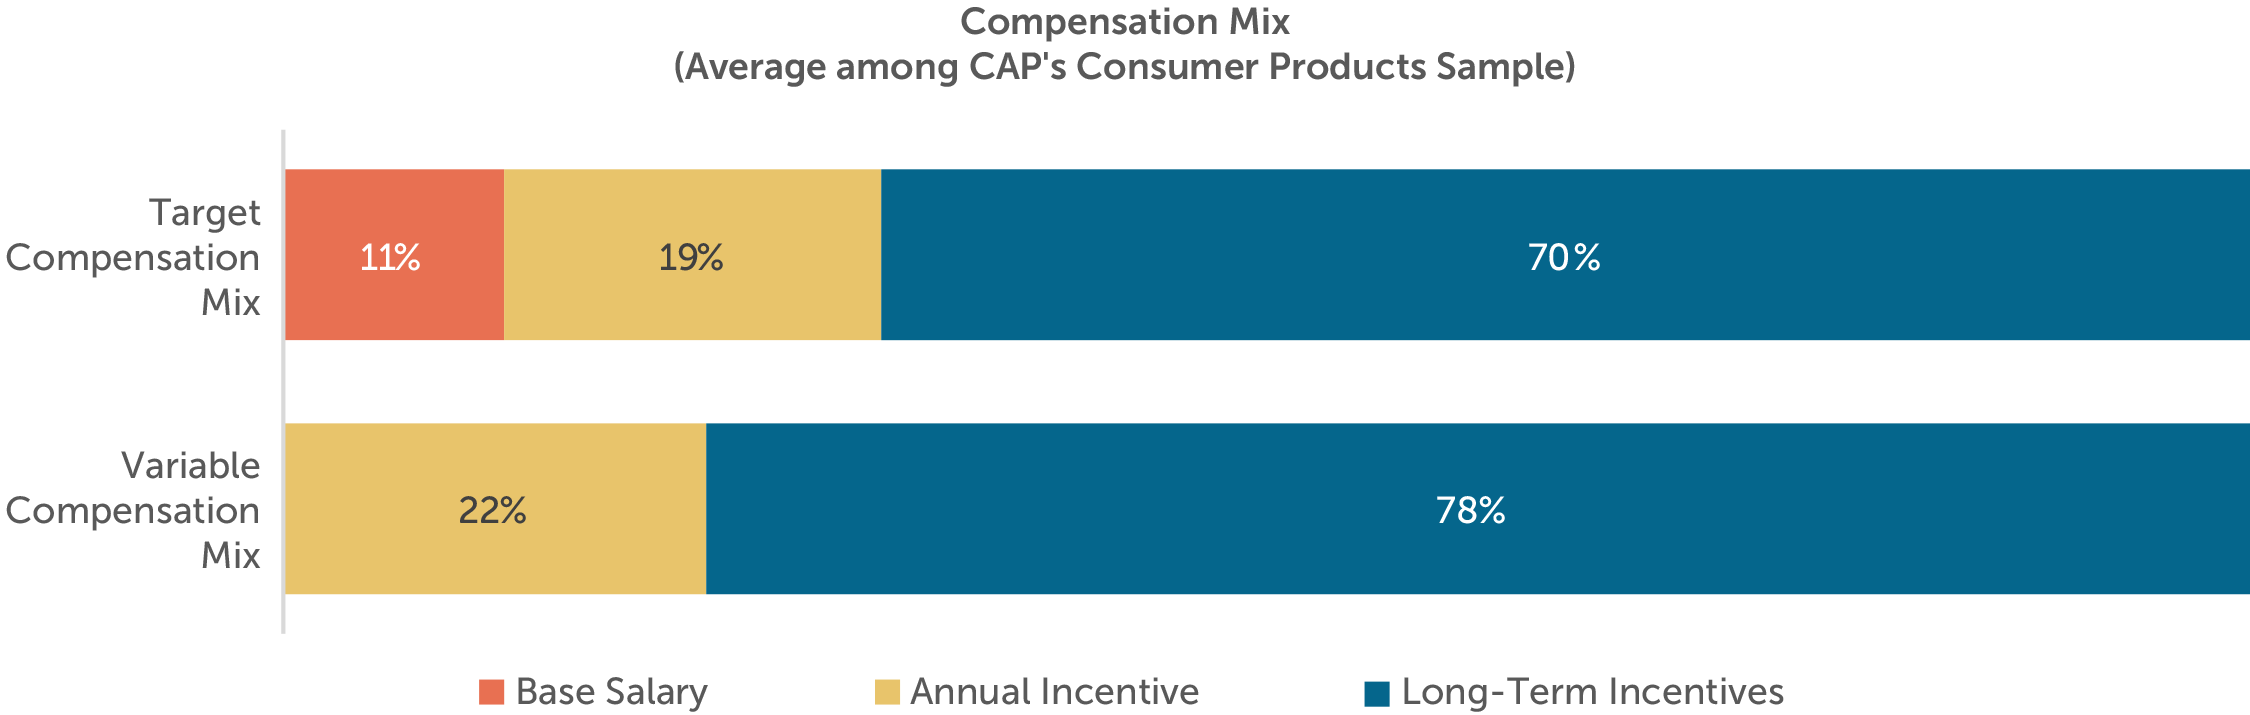
85% to 90% of target total direct compensation for CEOs of large U.S.-based companies comprises variable compensation (i.e., annual and long-term incentives). Among the companies in CAP’s Consumer Products sample, variable compensation accounts for 89% of target total direct compensation, on average.
Annual Incentives
Annual incentives encourage and reward successful performance against short-term company and/or individual objectives. For the companies in CAP’s Consumer Products sample, annual incentives make up 19% of target total direct compensation, on average.
Performance Metrics
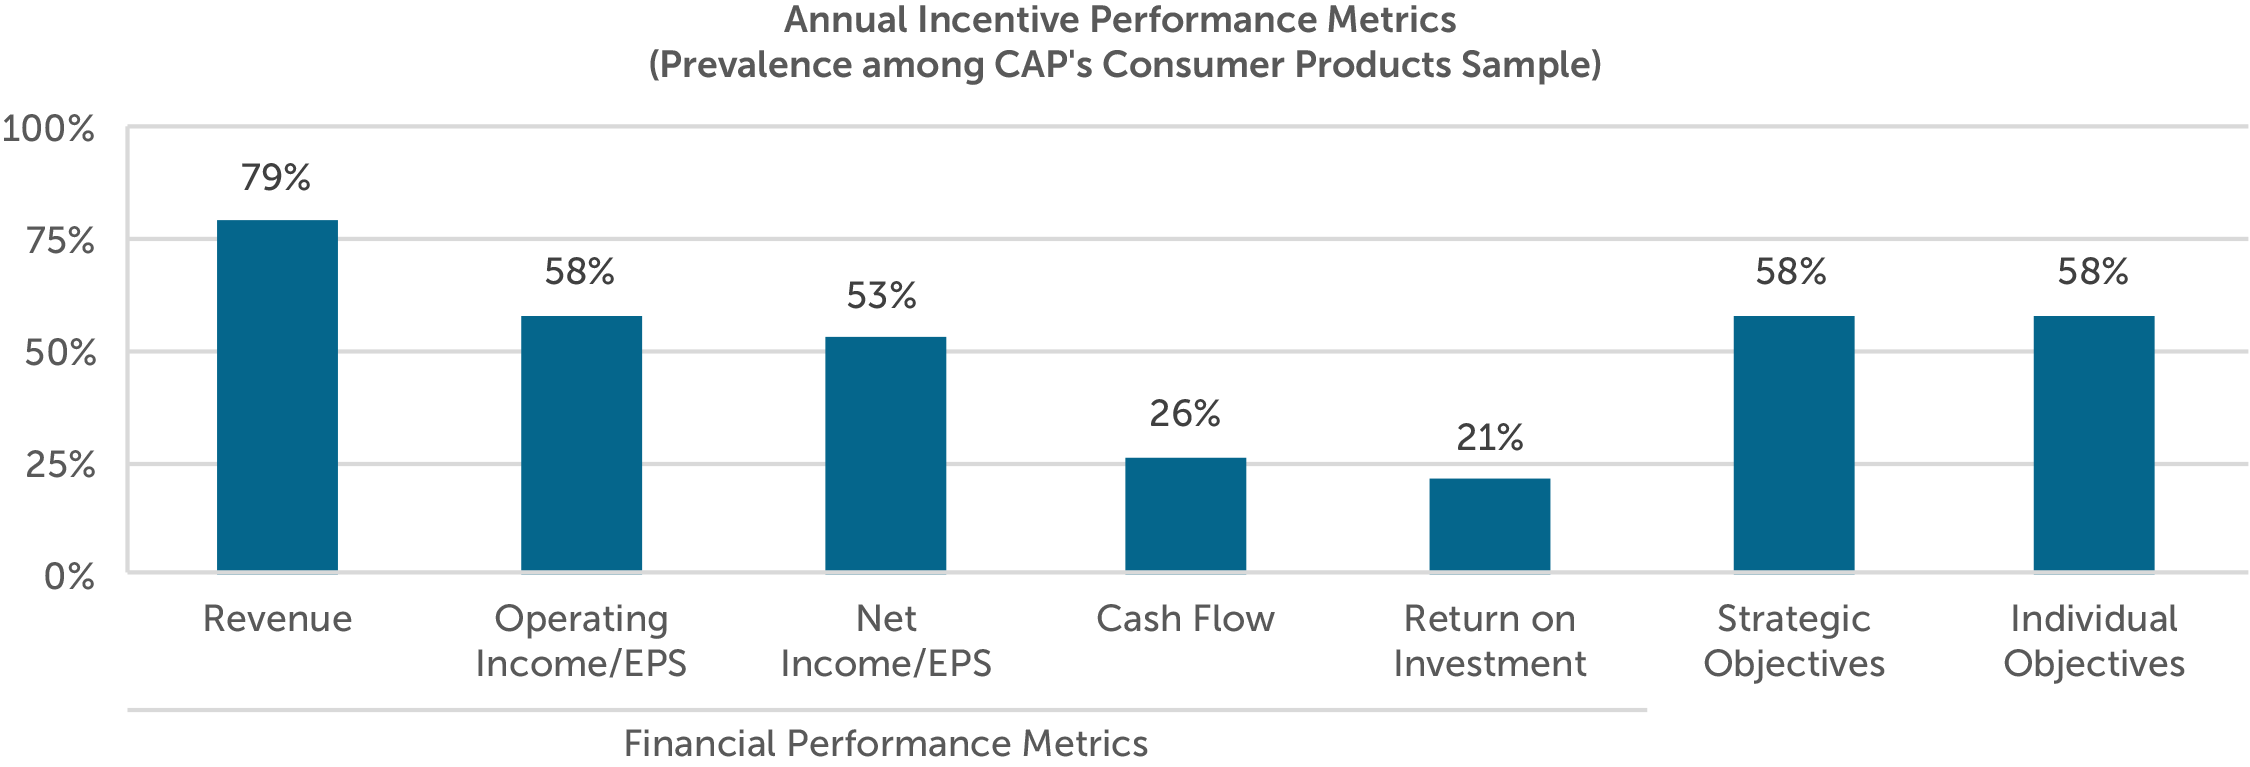
The objectives underlying annual incentive plans are often associated with short-term growth and profitability. Accordingly, among the companies in CAP’s Consumer Products sample, revenue, operating income (or EPS), and net income (or EPS) are the most common financial performance metrics – 100% of companies use at least one of these metrics, and nearly 75% of companies balance the use of a “top-line” revenue metric with one or more “bottom-line” income metrics.
Revenue and income are typically measured on an adjusted, as opposed to GAAP, basis. For instance, two-thirds of the companies in CAP’s sample that use revenue growth as an annual incentive performance metric use FX-neutral revenue growth. Other common adjustments to revenue and/or income include the exclusion of results from businesses acquired or divested during the performance year, as well as one-time gains or charges, such as those related to corporate restructuring.
Annual incentive metrics measuring performance against strategic objectives are also common among companies in CAP’s Consumer Products sample. Workplace diversity is considered by more than half of the companies that use strategic metrics. Innovation, cost savings, and market share are also prevalent strategic metrics; each are used by approximately one third of the companies that use strategic metrics.
58% of the companies in CAP’s Consumer Products sample consider individual performance in the determination of the CEO’s annual incentive award. Among these companies, the way in which individual performance impacts the annual incentive award is mixed. Some companies include individual performance as a discrete additive component in the annual incentive formula. Others use individual performance to modify awards; this can be done objectively, using a “multiplicative modifier,” or on a more subjective, discretionary basis.
Long-Term Incentives
Long-term incentives tie executive compensation to performance against the company’s longer-term objectives. Awards are typically delivered using equity-based vehicles with multi-year vesting periods; this helps to align the interests of executives with those of shareholders, and serves as a retention incentive. For the companies in CAP’s Consumer Products sample, long-term incentives make up 70% of target total direct compensation, on average.
Vehicle Mix
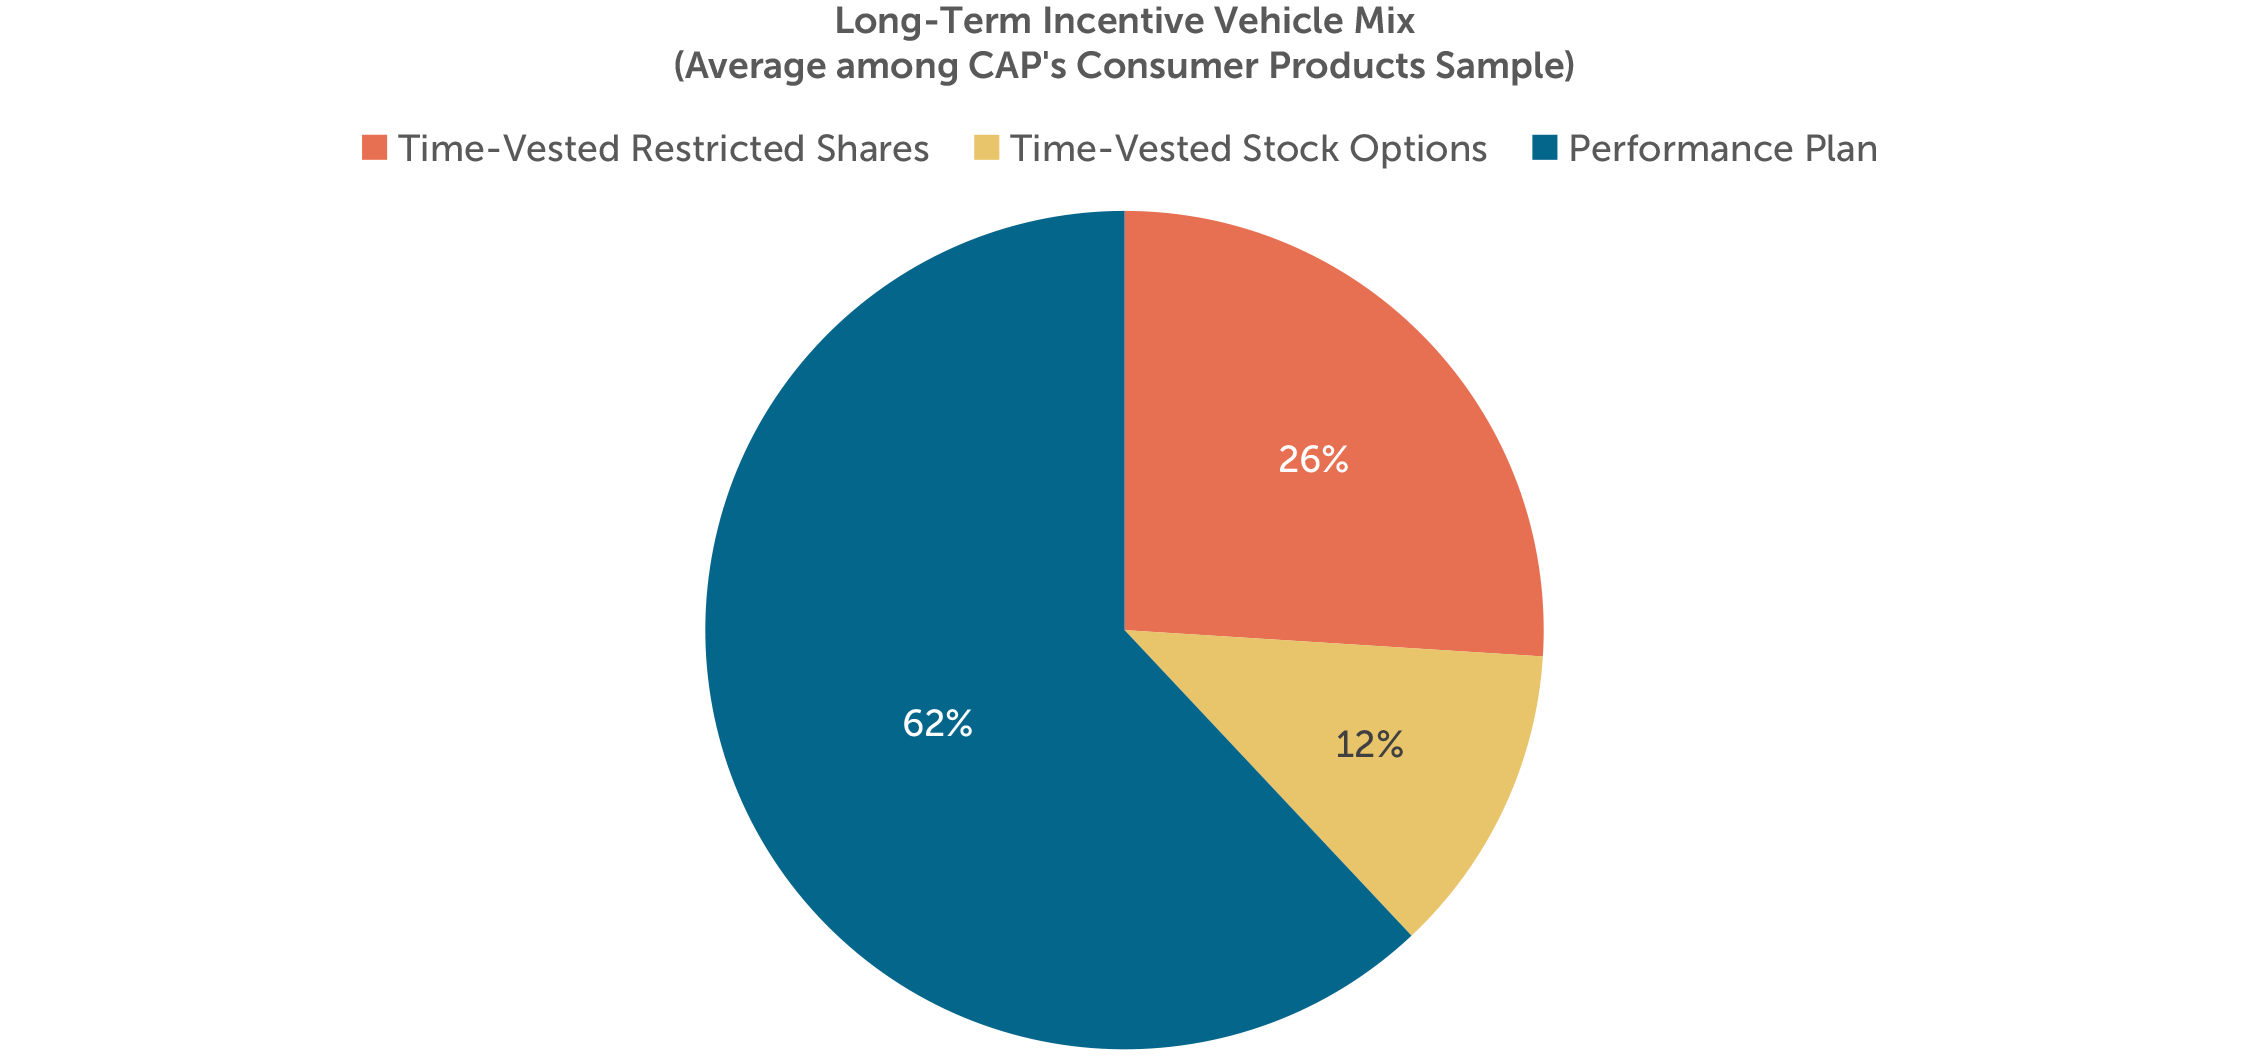
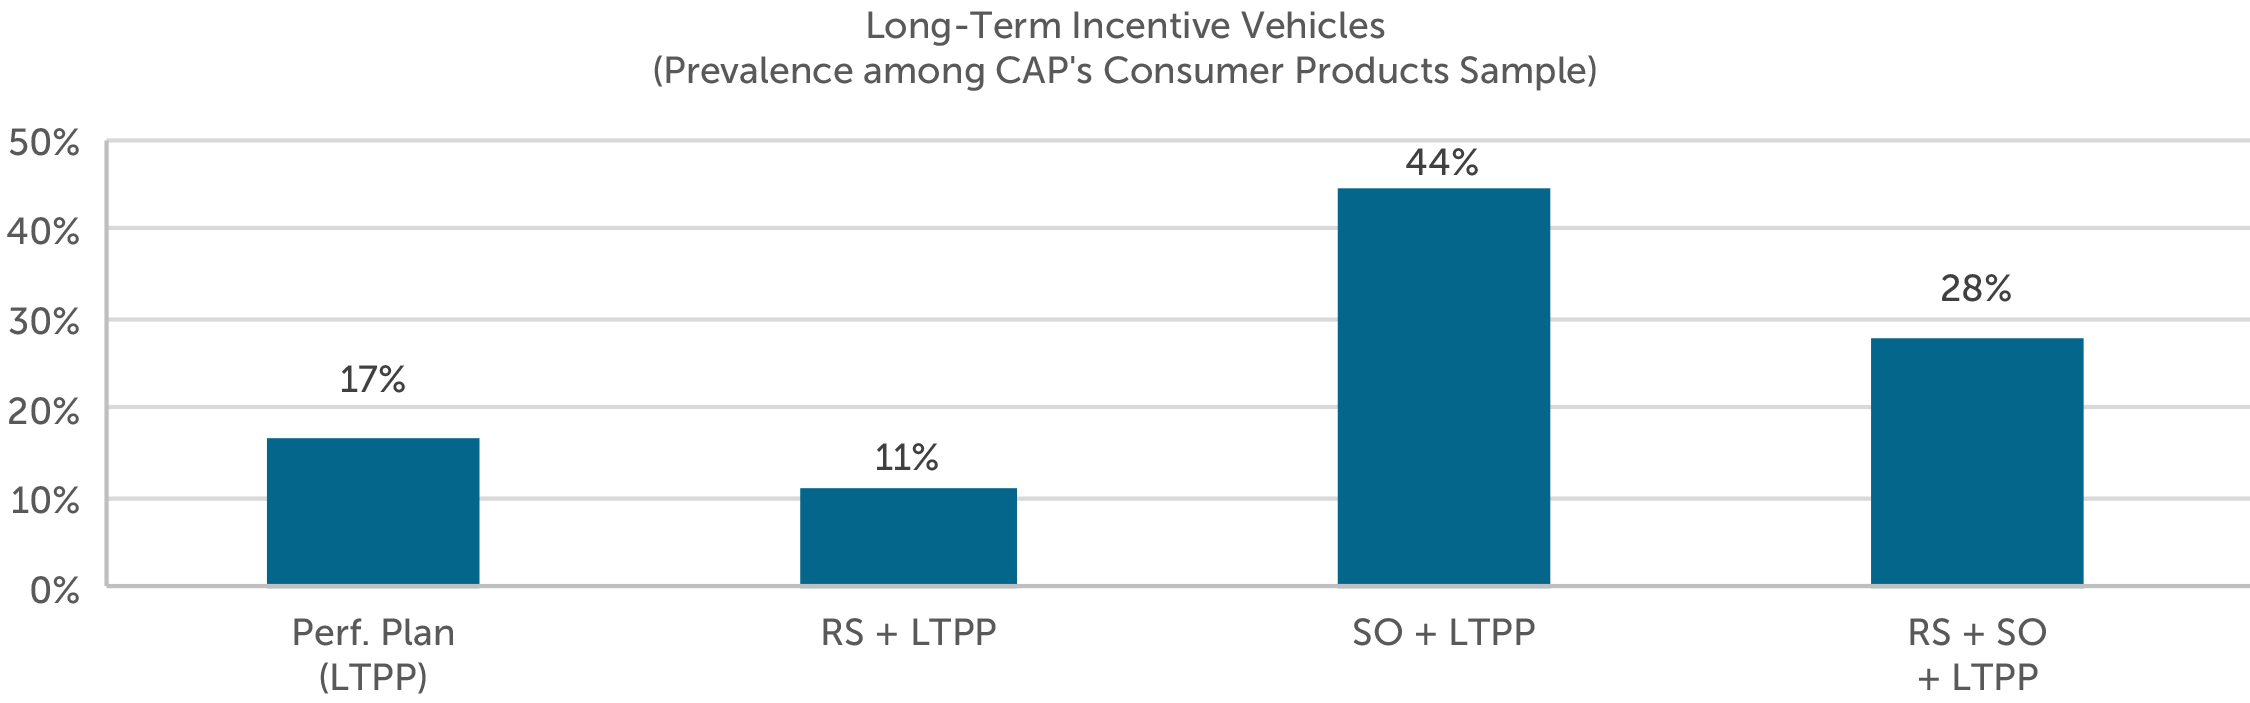
Long-term incentive vehicles can be bucketed into three broad categories: (1) time-vested restricted shares (or units); (2) time-vested stock options (or stock appreciation rights); and (3) performance plans. Performance plans include performance shares (or units), performance-vested stock options, and performance-based cash compensation with multi-year performance criteria.
All of the companies in CAP’s Consumer Products sample use a performance plan to deliver long-term incentives to the CEO. However, the use of a performance plan as the exclusive long-term incentive vehicle is uncommon: 44% and 11% of companies in CAP’s sample mix a performance plan with time-vested stock options and time-vested restricted shares, respectively. 28% of companies use all three vehicles.
Performance Metrics
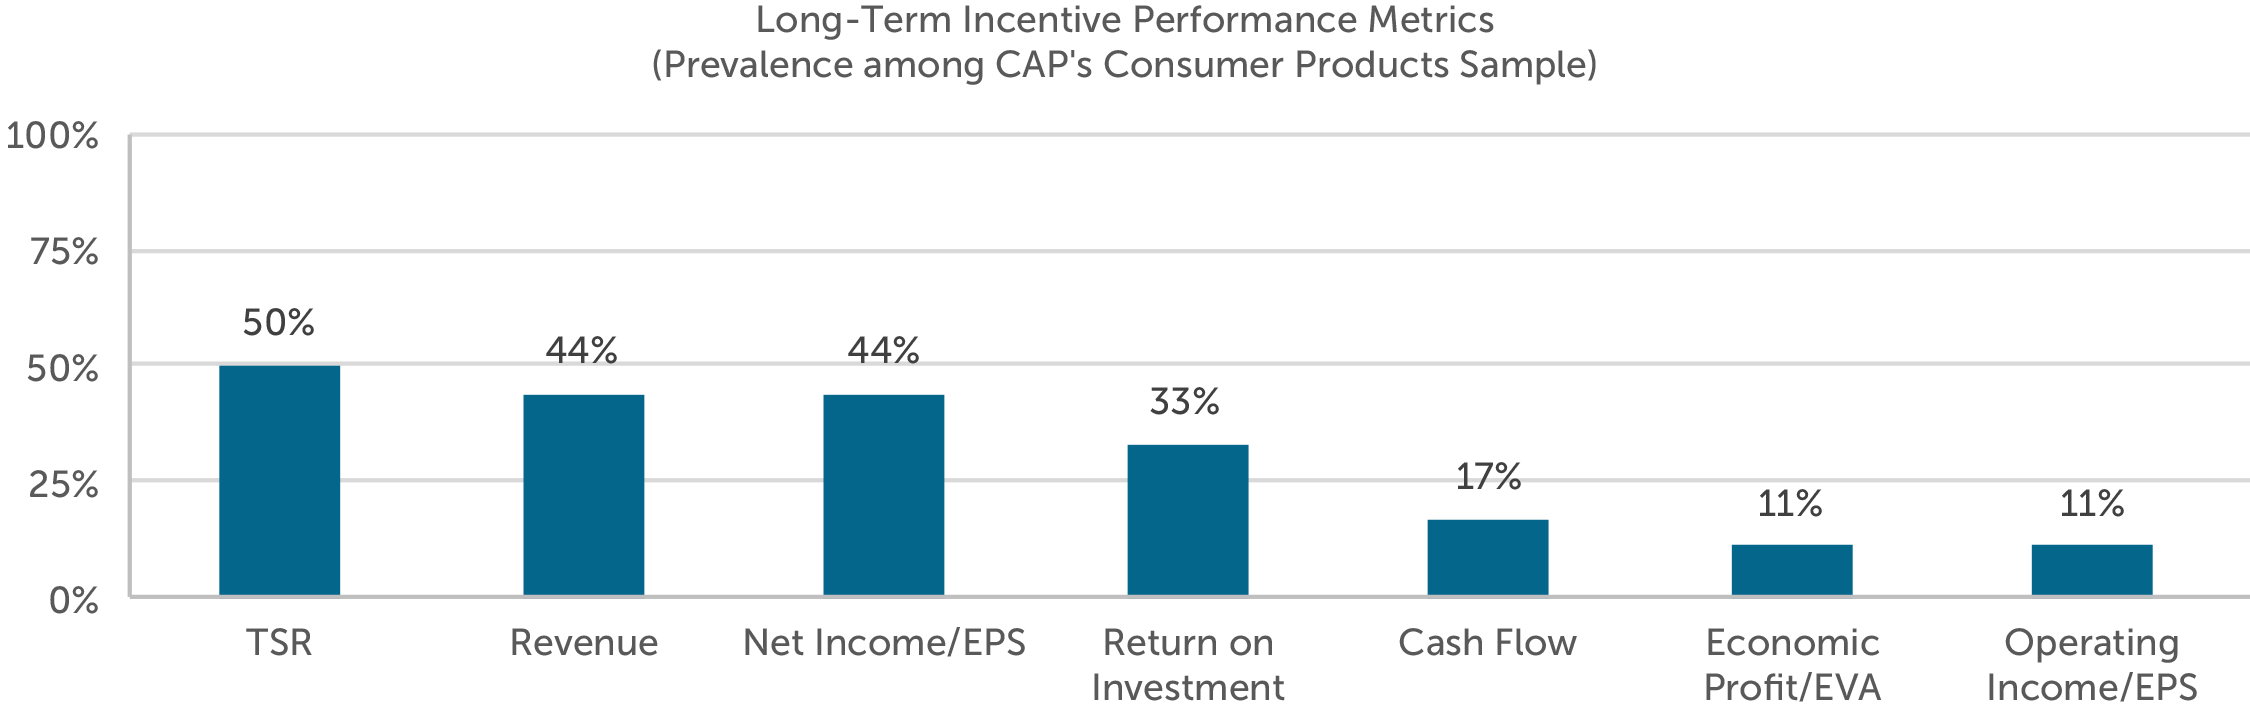
While annual incentives emphasize short-term growth and profitability, long-term incentives generally encourage and reward long-term value creation. Approximately four-fifths of the companies in CAP’s Consumer Products sample use one or more return metrics in the long-term incentive plan: TSR is used by 50% of companies, return on investment is used by 33% of companies, and economic profit is used by 11% of companies. All of the companies that use TSR measure performance on a relative basis against a company-defined peer group or broad-market index. Among the companies that use relative TSR, 67% use one or more additional absolute performance metrics.
Conclusion
Similar to other industries, Consumer Product companies are not immune to macroeconomic factors and external challenges impacting their businesses. Between taxes on soda, competition from store brands / smaller upstarts, battle for shelf space and health conscious consumers, consumer product companies are facing a decrease in sales volume and market share. The shift in shopper preferences has continued in 2017 and will force these companies to find new ways to increase profitability and market share.
As a result of this competition, companies are balancing strategic objectives and individual performance with top-line growth and bottom-line performance in their incentive plan design. Boards and management will need to continue to reinforce the emphasis on pay and performance and ensure that the appropriate behaviors and results are being rewarded, performance targets are reflective of the long-term strategy and incentive plan design supports current business needs.
Boards and management need to be mindful that as incentive plan metrics are tied to adjusted financials, proxy advisory firms will be using GAAP metrics when calculating the pay for performance relationship, which can vary greatly from the adjusted metrics. This may impact the pay for performance alignment and impact the Say on Pay vote if the proxy advisory firm recommends Against Say on Pay.
For questions or more information, please contact:
Dan Laddin Partner [email protected] 212-921-9353
Shaun Bisman Principal [email protected] 212-921-9365
Kyle Eastman Associate [email protected] 212-921-9362
Ryan Colucci Associate [email protected] 646-486-9745
Kyle Clemenza and Rebecca Wertman provided research assistance for this report.
CAP’s Consumer Products Sample
Altria Group, Inc.
Avon Products, Inc.
Campbell Soup Company
The Clorox Company
The Coca-Cola Company
Colgate-Palmolive Company
Conagra Brands, Inc.
The Estée Lauder Companies Inc.
General Mills, Inc.
The J. M. Smucker Company
Kellogg Company
Kimberly-Clark Corporation
Mondelēz International, Inc.
Newell Brands Inc.
NIKE, Inc.
Pepsico, Inc.
The Procter & Gamble Company
Starbucks Corporation