
Introduction
CAP set out to see if CEO pay levels among Wall Street Banks have returned to pre-crisis levels (i.e., 2007). In addition, we reviewed other financial sector firms1 to see how CEO pay levels have moved over the same time period. Hedge funds and private equity firms were not included in the review.
For reference, comparisons were also made to large non-bank companies across other industries ("Fortune 30"). In total, 65 companies were examined.
CEO Compensation – Highlights
- Wall Street CEO pay continues to exceed all other financial services companies studied; however, the gap between Wall Street Banks and other companies studied has narrowed significantly since 2007
- Pay levels for most Wall Street and Trust Bank CEOs have not returned to pre-crisis levels
- CEO pay among Asset Managers had the most significant increase, with median pay increasing 42% since 2007
- Regional Bank (assets >$50 billion) and Card Processor CEO pay exceeds pre-crisis levels
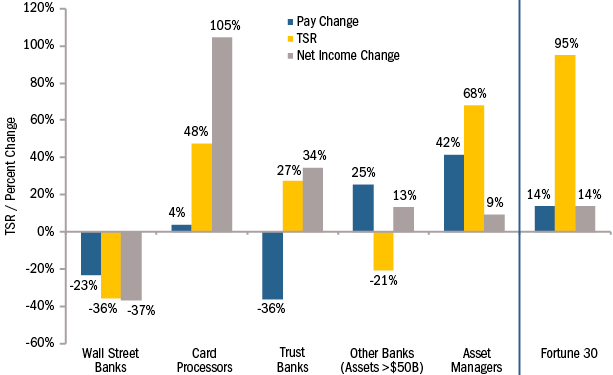
- From 2007 to 2014, changes in pay levels did not directly align with changes in stock price or Total Shareholder Return2 (“TSR”), with two exceptions. Asset Managers with strong stock appreciation also received significant growth in pay. Wall Street banks with decreases in stock price reported lower pay levels.
Current Pay Levels
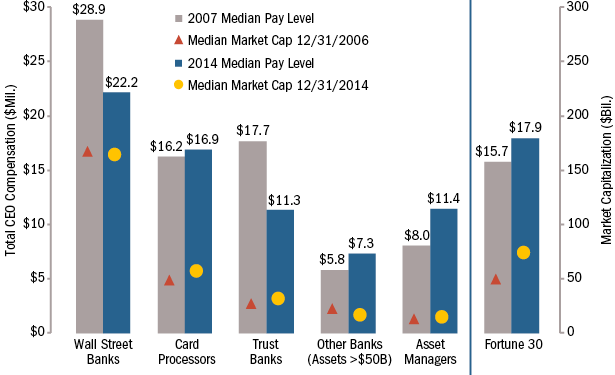
As shown in Chart 1, CEO compensation at Wall Street Banks remains higher than other companies studied, however the differential has decreased since 2007. Wall Street Banks are also significantly larger than most of the other companies studied, in terms of market capitalization and net income.
Chart 1: Pay Levels vs. Company Size
Change in Compensation Since 2007
Have financial services companies returned to pre-crisis pay levels?
|
No |
|
|
Yes |
|
Chart 2: Pay vs. Performance
Conclusion
By 2014, most of the groups of companies studied have recovered from the financial crisis, as evidenced by increases in net income and TSR versus their 2007 results (Chart 2). It appears that companies have used restraint in making corresponding increases to CEO pay, recognizing that (1) shareholders sustained significant losses during the crisis, (2) material increases in pay should follow improved results for shareholders, and (3) public and regulatory scrutiny on financial company pay practices has been unrelenting.
As we look ahead, for both financial and non-financial firms, we expect continued sensitivity to executive pay levels, especially CEO pay levels. While companies have recouped losses from 2007, there will be ongoing pressure to demonstrate that CEO pay is aligned with performance, in terms of financial success and shareholder returns.
Appendix – Methodology
|
Item |
Definition |
|
Total Compensation |
Represents compensation as reported in Summary Compensation Table, excluding change in pension value and/or above market interest on non-qualified deferred compensation. For 2007 compensation, equity award values were taken from the Grants of Plan-Based Awards Table to consistently reflect the fair market value of equity awards granted in the year reviewed. |
|
Median |
Median was calculated for data sets with 5 or more companies. For data sets with less than 5 companies, average was used. |
|
Data Set |
Description |
|
Fortune 30 |
Includes the largest companies based on 2013 revenues, excluding any financial services companies, controlled companies, companies that were not public in 2007, or any companies that did not file a proxy statement between 9/1/2014 and 5/15/2015. AmerisourceBergen, Archer-Daniels-Midland, AT&T, Boeing, Cardinal Health, Chevron, Costco, CVS Health, Express Scripts, Exxon Mobil, Ford Motor, General Electric, General Motors, Hewlett-Packard, IBM, Kroger, Valero, Verizon, and Wal-Mart |
|
Wall Street Banks |
Bank of America, Citigroup, Goldman Sachs, JPMorgan Chase, and Morgan Stanley |
|
Card Processors |
American Express, Capital One, and Discover Financial |
|
Trust Banks |
BNY Mellon, Northern Trust, and State Street |
|
Other Banks |
All banks with assets greater than $50B, not listed above. BB&T, Comerica, Fifth Third, Huntington Bancshares, KeyCorp, M&T Bank, PNC, Regions Financial, SunTrust, U.S. Bancorp, Wells Fargo, and Zions |
|
Asset Managers |
10 largest Asset Managers by market capitalization on 12/31/2014. Affiliated Managers Group, BlackRock, Charles Schwab, Eaton Vance, Federated Investors, Franklin Resources, Invesco, Legg Mason, SEI Investments, T. Rowe Price (excludes Blackstone) |


