DOWNLOAD A PDF OF THIS REPORT pdf(0.1MB)
Contact
Kelly MalafisFounding Partner [email protected] 212-921-9357 Lauren Peek
Partner [email protected] 212-921-9374
This report summarizes 2017 CEO pay and performance and incentive compensation practices for a sample of 19 public Small Pharmaceutical and Biotechnology companies with revenues between $600M and $6B (“CAP’s Small Pharma/Biotech Sample”). Among companies in our sample, median revenue was $1.5B.
Key Takeaways
- 2017 annual bonus payout, at median, was 113% of target and aligns with the strong median revenue growth of nearly 10%.
- Companies tend to focus annual incentive payouts on revenue and pipeline development vs. profits as a significant investment in R&D could negatively impact profits in the short term.
- Stock options reflect nearly 45% of the long-term incentive (LTI) mix while performance-based LTI reflects only 30% of the mix indicating that these companies may have high growth expectations but find it challenging to set credible long-term goals.
- We expect companies will continue to face challenges as they focus on developing a product pipeline in a highly competitive environment.
2017 Financial and TSR Performance
| Sample | 1-Year Median Performance | ||
| Revenue Growth | Operating Income Growth | Total Shareholder Return | |
| CAP’s Small Pharma/Biotech Sample | +9% | -4% | +2% |
| S&P MidCap 400 | +7% | +7% | +14% |
2017 financial results were mixed for CAP’s Small Pharma/Biotech Sample. While sales grew by nearly 10% versus 2016, operating income declined by 4%. Small pharmaceutical and biotechnology companies tend to be focused on developing a robust pipeline which requires a significant investment in R&D that could impact operating results.
Median 1-year total shareholder return (TSR) for the period ending December 31, 2017 was 2%. This represents a significant improvement over the 1-year period ending December 31, 2016 (when median total shareholder return was -30%) but lags median total shareholder return among S&P MidCap 400 companies. Uncertainty around product approvals and pipeline can also cause stock price volality in the industry.
CEO Annual Incentive Payouts and Plan Design
2017 median CEO bonus payout was 113% of target. This reflects a 22 percentage point increase from prior year when median payout was 91% of target.
The year over year increase in CEO bonus payouts aligns with strong top line growth for CAP’s Small Pharma/Biotech Sample. This is likely because revenue is the most commonly used annual incentive metric among these companies. Pipeline/strategic goals and operating income are also prevalent.
- 78% of companies use revenue
- 61% of companies use pipeline/strategic goals
- 56% of companies use operating income
Bottom line metrics like EPS and net income are less commonly used by companies in CAP’s Small Pharma/Biotech Sample than they are among larger pharmaceutical and biotechnology firms. Most companies in CAP’s Small Pharma/Biotech Sample saw a decline in net profits in 2017; 53% of companies generated a net loss.
This pay and performance relationship indicates that companies in CAP’s Small Pharma/Biotech Sample prioritize the achievement of sales growth, pipeline progress and strategic milestones over profit growth in the near term.
| Summary Statistics | Annual Incentive Payout as a % of Target – CAP’s Small Pharma/Biotech Sample | ||
| 2016 | 2017 | Change from 2016 to 2017 | |
| 75th Percentile | 124% | 147% | +23% pts |
| Median | 91% | 113% | +22% pts |
| 25th Percentile | 73% | 90% | +17% pts |
Actual Compensation for CEOs
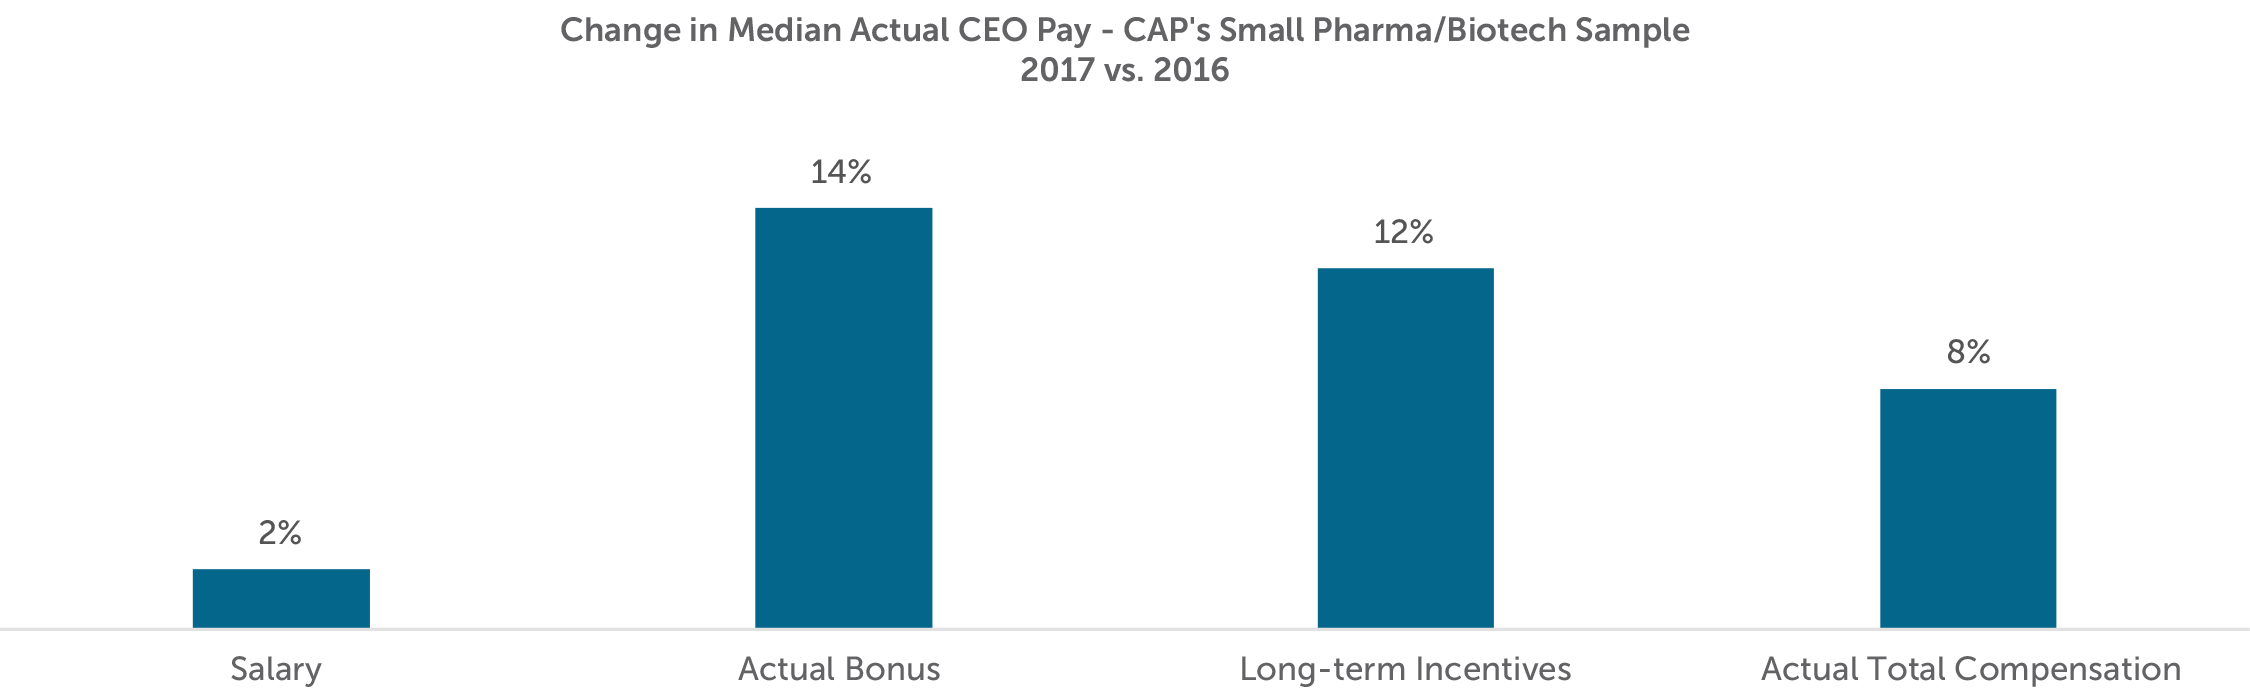
Median CEO total compensation for 2017, which includes base salary, actual bonus paid for 2017 performance and long-term incentives granted in 2017, increased 8% versus 2016. This increase was largely driven by increases to actual bonuses paid and long-term incentives granted. As previously discussed, increases in bonus payouts are directionally aligned with strong sales growth. Companies generally grant LTI to reward past and future expectations of performance and the 12% increase over 2016 levels may be more reflective of individual potential rather than only company performance.
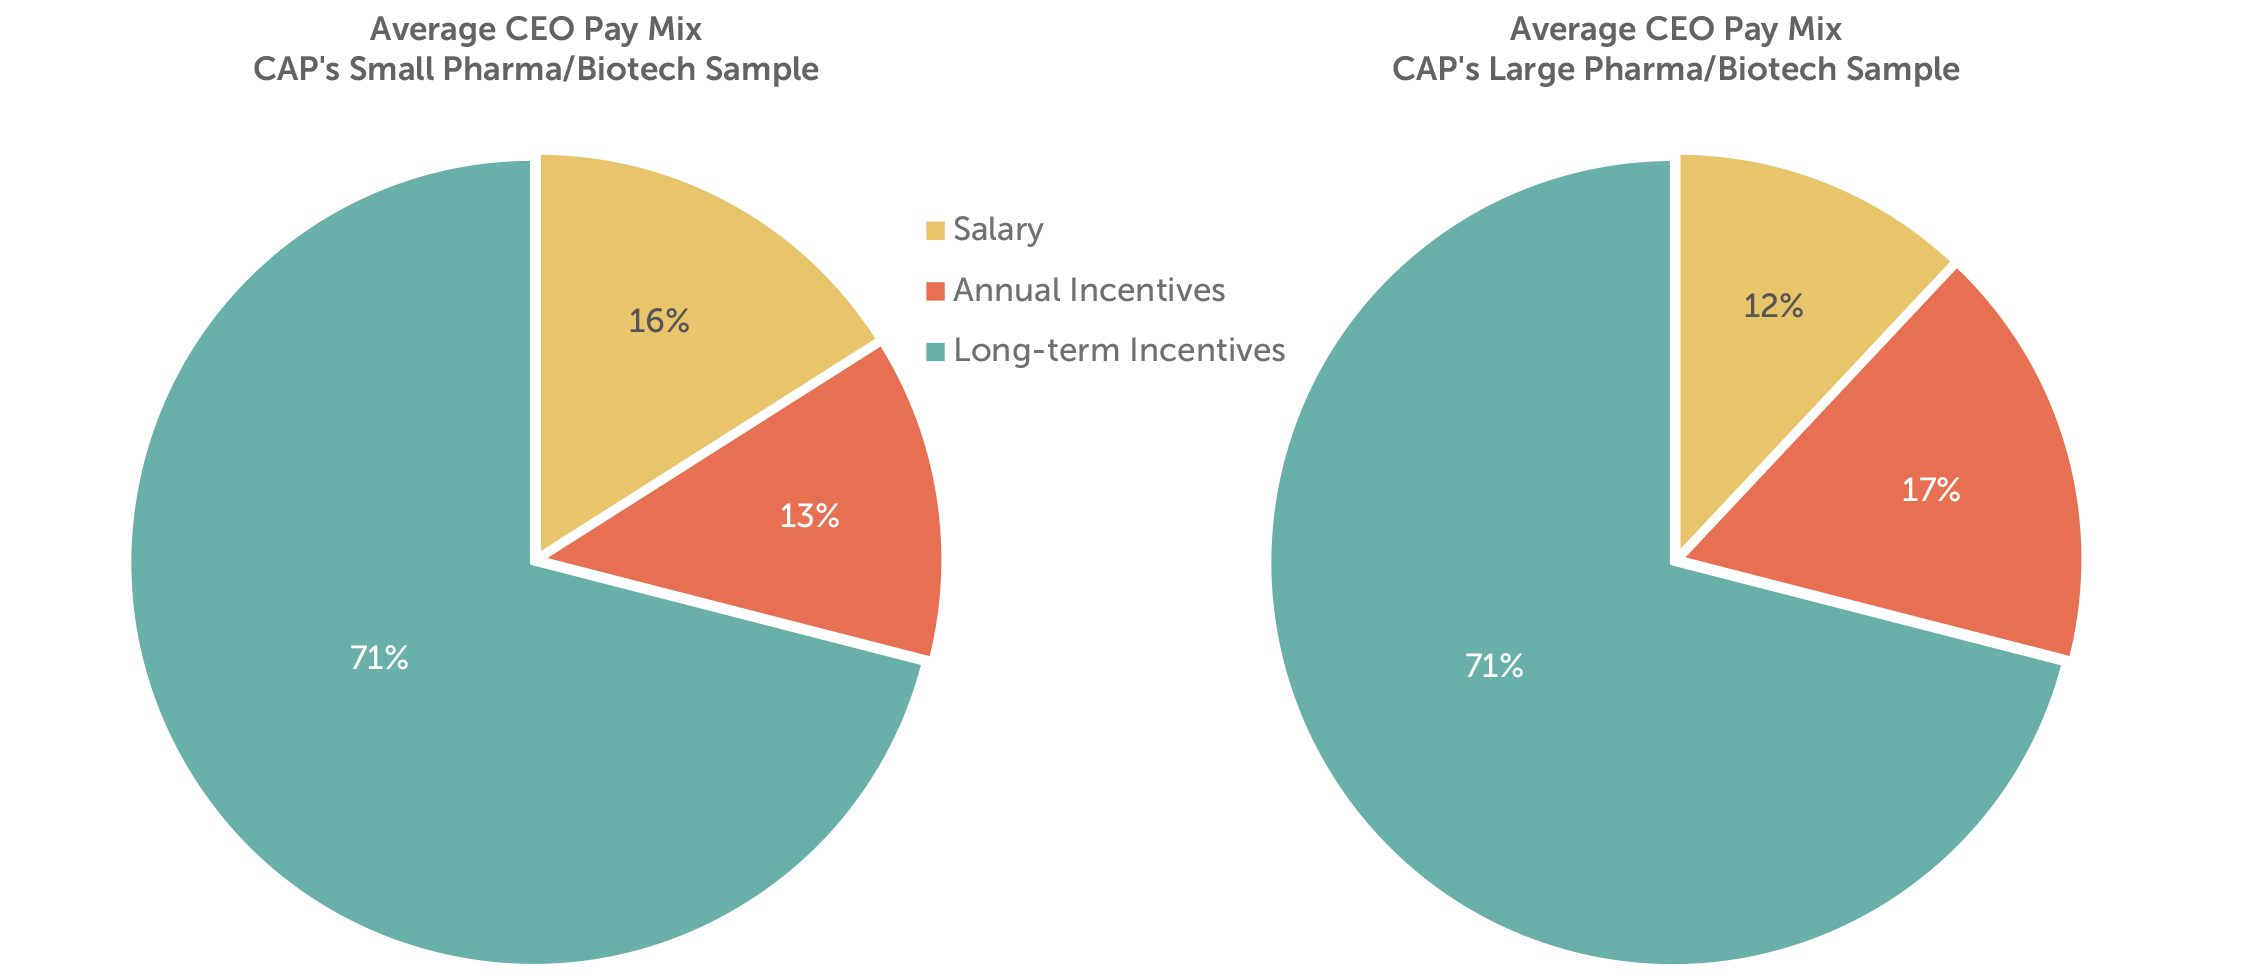
Pay Mix
CEO pay programs for companies in our sample place the greatest emphasis on long-term incentives (i.e., approximately 70% of total compensation). The companies in CAP’s Small Pharma / Biotech sample place more emphasis on base salary and less on annual incentives compared to larger organizations in the industry (See CAP’s Large Pharma / Biotech industry report for list of companies). Small pharmaceutical and biotechnology companies may place less emphasis on annual incentives as regulatory and commercial uncertainty may limit their ability to set credible annual performance goals.
Long-term Incentive Mix and Long-term Performance Plan Design
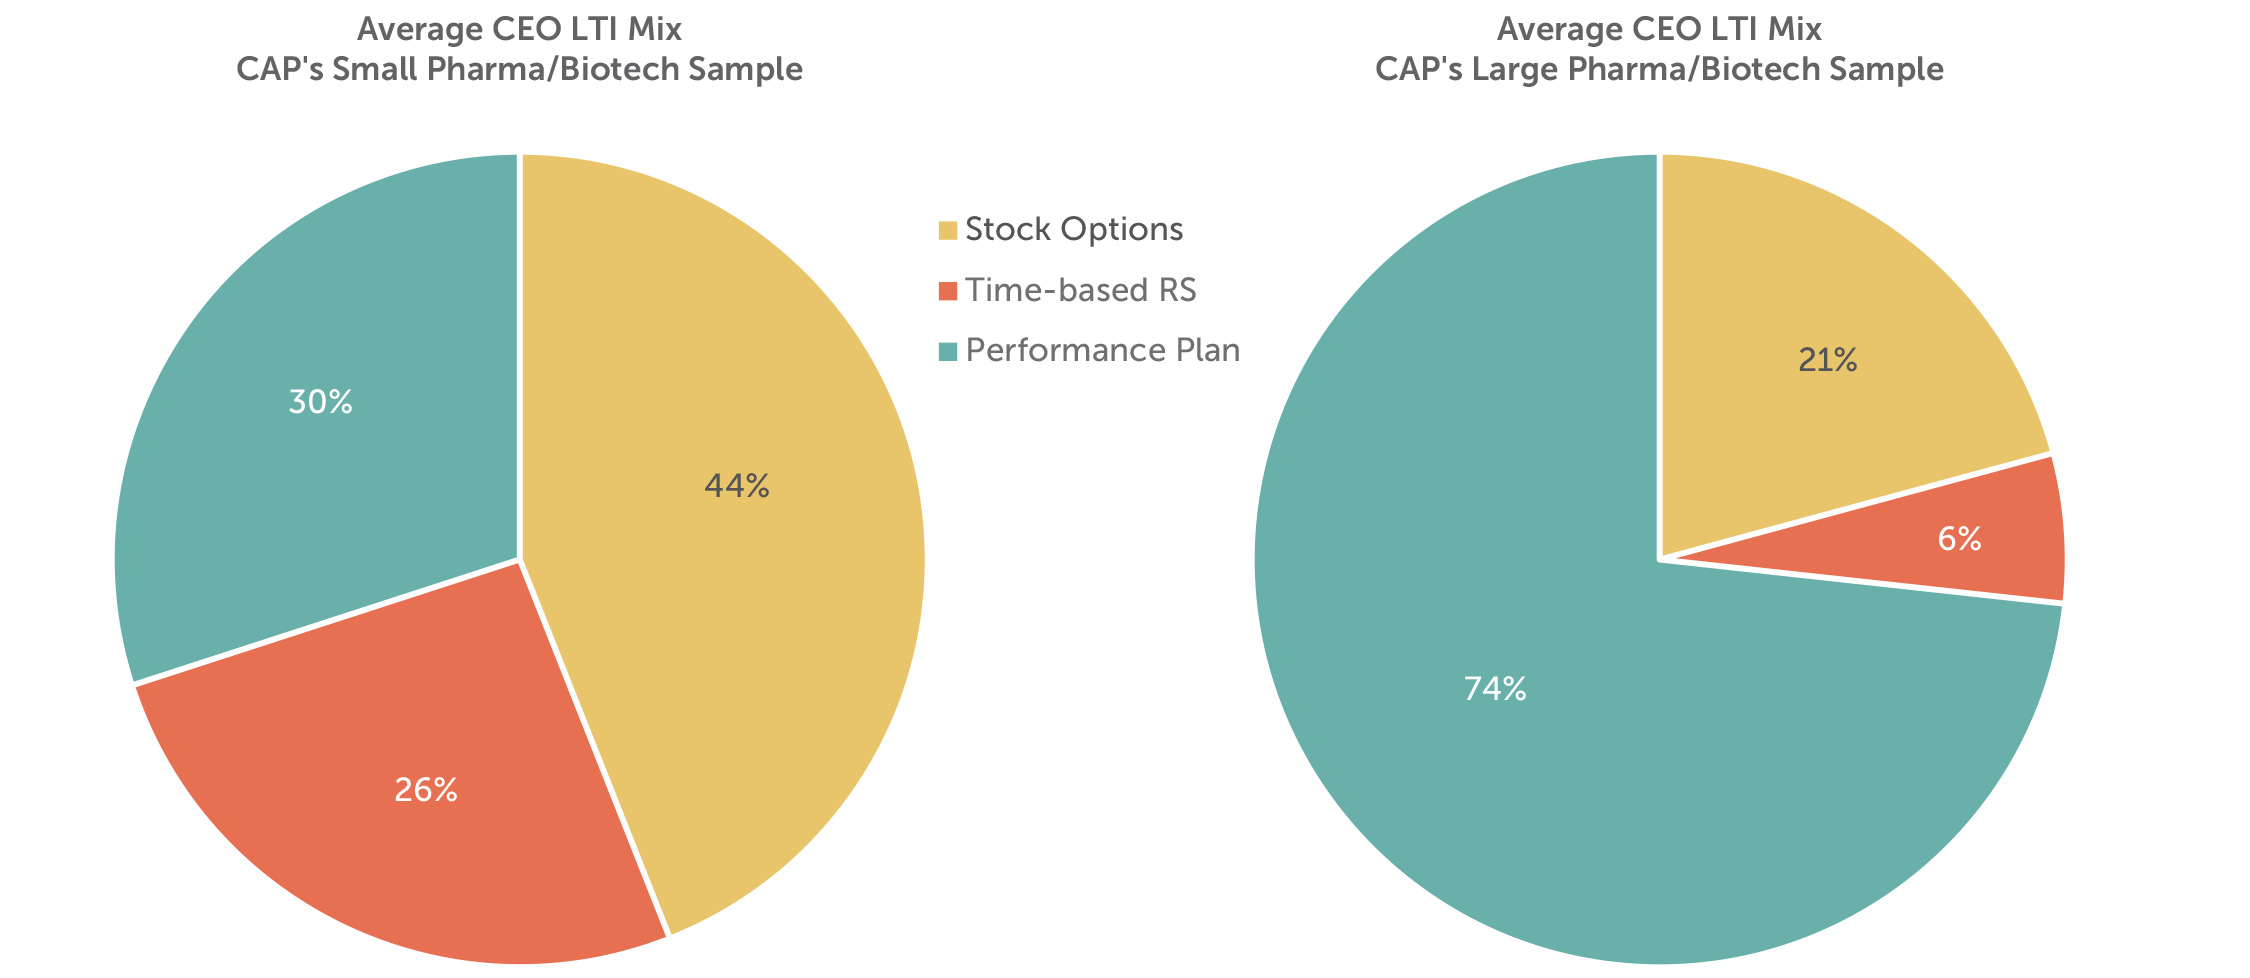
Long-term incentive vehicles can be bucketed into three broad categories: (1) time-vested restricted shares (or units); (2) time-vested stock options (or stock appreciation rights); and (3) long-term performance plans. Performance plans include performance shares (or units), performance-vested stock options, and performance-based cash compensation with multi-year performance criteria.
The companies in CAP’s Small Pharma/Biotech Sample place a greater emphasis on stock options than performance plans. This is a significant departure from larger firms in the industry; 30% of long-term incentives are delivered through performance plans versus approximately 75% at the larger firms. This emphasis on stock options among small pharmaceutical and biotechnology companies is likely due to high growth expectations as well as difficulty setting longer term goals. Larger companies may not have a similar expectation of stock price appreciation; additionally, they may have more scrutiny from shareholders and proxy advisors to have a greater portion (at least 50%) of total LTI delivered in the form of a performance plan.
Time-based restricted stock or units, which serve as a retentive tool for executives and other key talent, is approximately 25% of total long-term incentives. This is generally consistent with broader market practice.
Although performance plans reflect less than 1/3 of total LTI, nearly 70% of the companies in CAP’s Small Pharma/Biotech Sample have a long-term performance plan in place. Among these companies, relative TSR and revenue are the most common metrics with 62% of companies using each metric. TSR is most commonly measured relative to an industry index (e.g., the NASDAQ Biotechnology Index). In the broader market, a profit-based metric, typically EPS, is the second most common metric (behind TSR); use of revenue in a long-term plan is much less prevalent. Again, this suggests that the companies in CAP’s Small Pharma/Biotech Sample are more focused on growth than profitability and may face disclosure challenges with respect to profit goals, particularly for companies that generate net losses.
Looking Ahead
Following the improvement in total shareholder return in 2017, stock prices among CAP’s Small Pharma/Biotech Sample have dipped in the first five months of 2018. While this is likely due, in part, to a broader market correction, it may also reflect continued scrutiny of drug pricing and increased competition. While these factors pose challenges in the pharmaceutical and biotechnology industries, expectations for increased merger activity and the potential for deregulation could create tailwinds to bolster performance in the second half of the year.
We expect companies in CAP’s Small Pharma/Biotech Sample to maintain incentive plans that reward executives for investing in R&D, developing the pipeline and growing sales through existing and new products.
Additional Information – New CEO Pay Ratio Disclosure
Beginning with 2018 filings, companies are required to disclose the ratio of their CEO pay to that of the median employee. To date, 16 of the 19 companies in CAP’s Small Pharma/Biotech Sample have disclosed ratios. Among these companies, the reported CEO pay ratios ranged from 13:1 to 215:1 with a median ratio of 89:1. Given the flexibility that companies had in the methodology and assumptions used to calculate the ratio, comparisons of ratios between companies is less meaningful. To date, institutional investors and proxy advisory firms have not used disclosed CEO pay ratios to inform their voting decisions. We may see some year over year comparisons in the second year of disclosure.
For questions or more information, please contact:
Kelly Malafis Partner [email protected] 212-921-9357
Lauren Peek Principal [email protected] 212-921-9374
Michael Bonner Associate [email protected] 646-486-9744
Kyle Eastman Associate [email protected] 212-921-9362
Joanna Czyzewski, Matt McLaughlin, Amanda Miles and Joshua Hovden provided research assistance for this report.
CAP’s Small Pharma/Biotech Sample
- Akorn Inc.
- Alexion Pharmaceuticals Inc.
- Alkermes plc
- AMAG Pharmaceuticals Inc.
- BioMarin Pharmaceutical Inc.
- Catalent Inc.
- Endo International plc
- Horizon Pharma plc
- Impax Laboratories Inc.
- Incyte Corporation
- Jazz Pharmaceuticals plc
- Lannett Company Inc.
- Mallinckrodt Public Limited Company
- Myriad Genetics Inc.
- Opko Health Inc.
- Perrigo Co
- Regeneron Pharmaceuticals Inc.
- United Therapeutics Corporation
- Vertex Pharmaceuticals Inc.