DOWNLOAD A PDF OF THIS REPORT pdf(0.1MB)
Contact
Kelly MalafisFounding Partner [email protected] 212-921-9357 Lauren Peek
Partner [email protected] 212-921-9374
Compensation Advisory Partners (CAP) examined 2016 executive pay and company performance at 19 large pharmaceutical and biotechnology companies with median revenue of approximately $23B. CAP’s study includes 12 U.S. companies and 7 non-U.S. companies.
2016 Overview
In 2016, large pharmaceutical and biotechnology companies generated strong financial results; however, a challenging environment and the uncertain outlook for the industry drove total shareholder returns (TSR) below those of the S&P 500. The high cost of R&D, loss of exclusivity, and increased regulation continue to challenge growth and profitability, while the current U.S. administration’s focus on drug pricing, healthcare reform, and global policy create an air of uncertainty that could positively or negatively impact the industry.
In response to these difficulties, companies have focused on expense management, strategic alliances, and mergers and acquisitions to grow sales and manage costs. Pharmaceutical and biotechnology companies are also looking to different strategies, such as investing in biologics, to position themselves for growth in the future. We have seen incentive plan design in the pharmaceutical and biotechnology industry evolve to focus executives on achieving these objectives by rewarding them based on key performance metrics, such as sales, profits, pipeline development, and strategic initiatives, that together influence long-term shareholder value.
2016 Financial and TSR Performance
Sales and EPS among companies in our sample grew by +6% and +7%, respectively, at median. Pharmaceutical and biotechnology companies also had strong operating performance in 2016. The companies in our sample improved operating margin from 26% in 2015 to 27% in 2016. U.S. companies in particular saw an improvement in operational results in 2016, improving profit margin by 3 percentage points vs. 2015.
While the Pharma industry experienced stronger top and bottom line growth than the S&P 500 in 2016, median TSR results among companies in the industry (-10%) were lower than median TSR results among S&P 500 companies (+13%). Following several years of above-market stock price performance, 1-year TSR performance, in part, may have been depressed by the focus on drug pricing during the 2016 presidential election and the uncertainty centered around how the new administration’s policies will impact the industry.
| Industry Group | Median 2016 Performance | ||
| Revenue Growth | EPS Growth | TSR | |
| CAP Total Sample (n=19) | +6% | +7% | -10% |
| U.S. Companies (n=12) | +7% | +10% | -7% |
| Non-U.S. Companies (n=7) | +4% | -3% | -15% |
| S&P 500 | +3% | +6% | +13% |
Annual Incentive Payouts and Plan Design
At median, pharmaceutical CEOs received annual incentive payouts at 121% of target for 2016 performance. These payouts are reflective of strong (i.e., above target) performance; however, they also reflect a decline versus 2015 when the median payout was 156% of target.
| Summary Statistics | Annual Incentive Payout as a % of Target | |
| 2015 | 2016 | |
| 75th Percentile | 170% | 150% |
| Median | 156% | 121% |
| 25th Percentile | 105% | 109% |
Annual incentive payouts among pharmaceutical companies are most often determined based on sales, profits, and pipeline or R&D-related goals:
- 94% of companies use sales goals
- 75% of companies use net income or EPS goals
- 75% of companies use pipeline or R&D goals
While 2016 revenue and EPS growth were generally stronger than 2015, the decline in 2016 payouts may be reflective of some pipeline challenges that companies faced during the year. Many companies in our sample also include an individual or strategic performance component, which can impact final annual incentive plan payouts.
2016 CEO Pay vs. Performance:
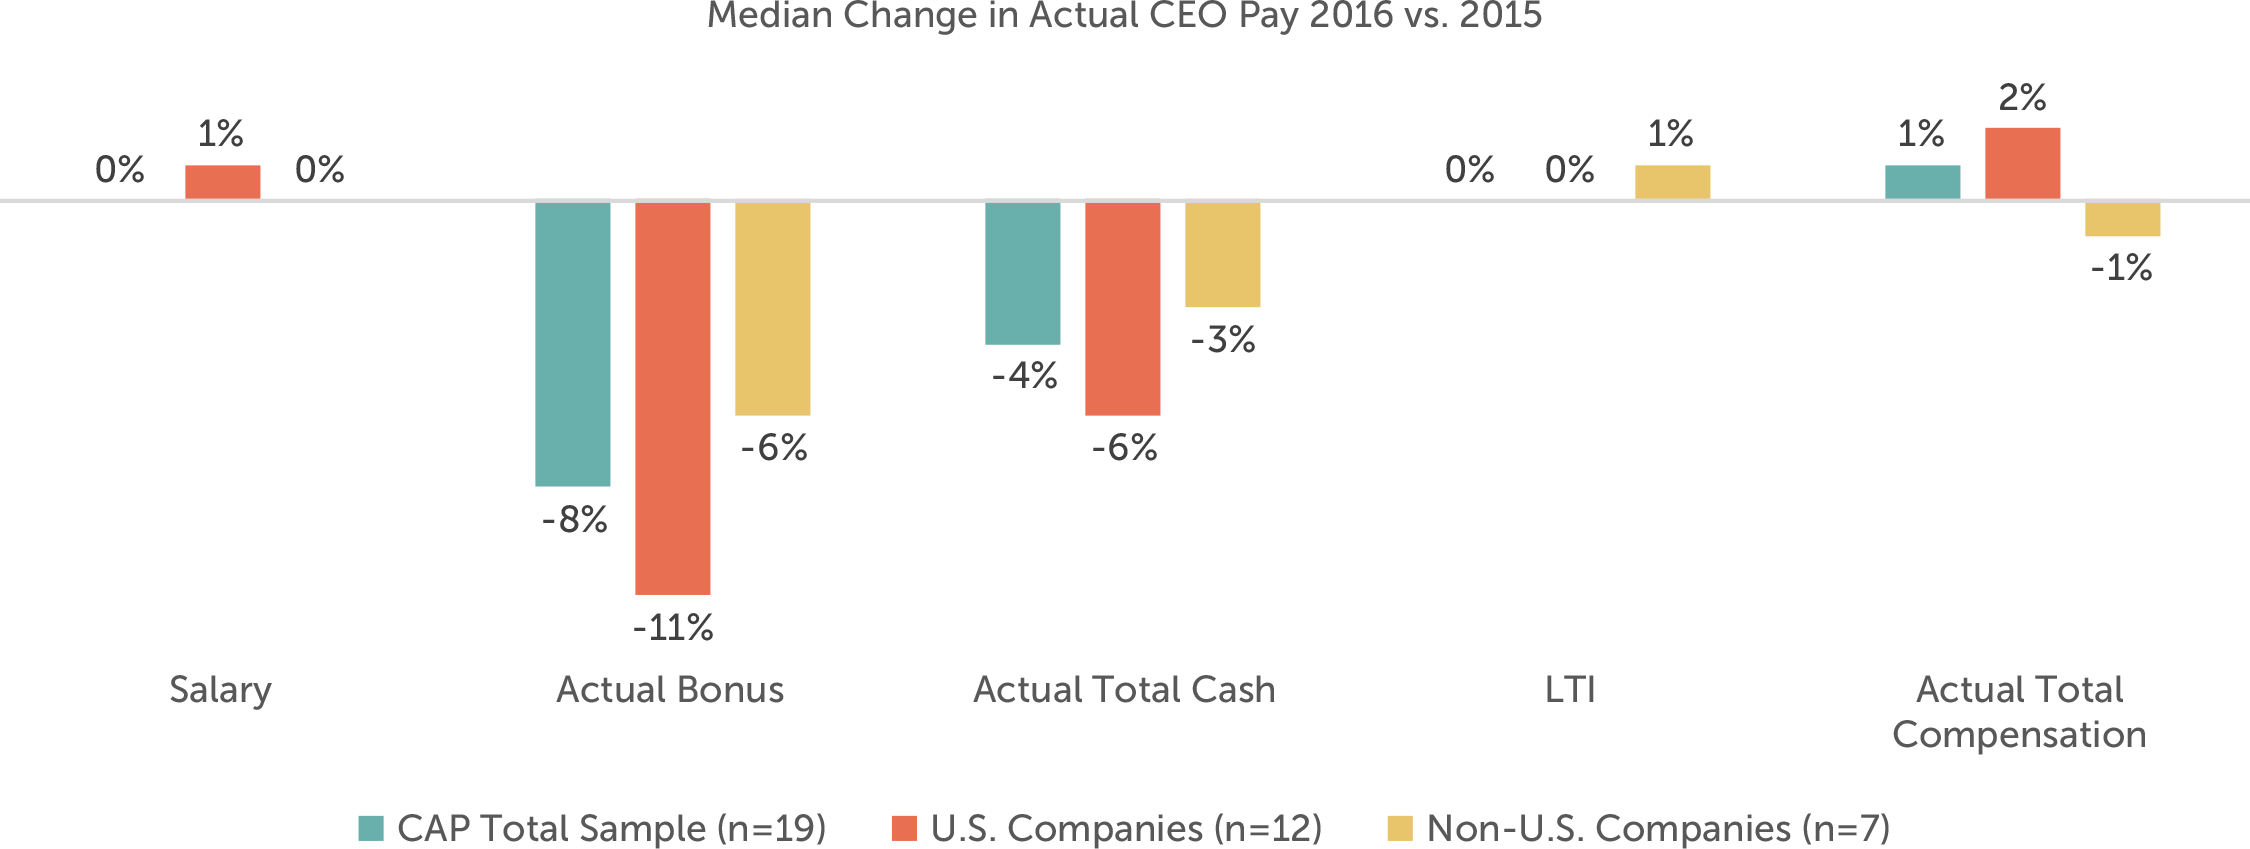
2016 actual total compensation (salary, bonus, and long-term incentives) for CEOs at large pharmaceutical and biotechnology companies was flat vs. 2015. Actual bonus payouts were generally down. Base salaries and long-term incentive awards were generally flat at median; however, several companies provided modest increases in base salaries and more substantial increases in long-term incentive awards, resulting in minimal change (+1%) in actual total compensation at median. Overall, actual compensation levels seem to align with a holistic view of industry performance, where revenue and EPS growth were strong, but stock prices were down.
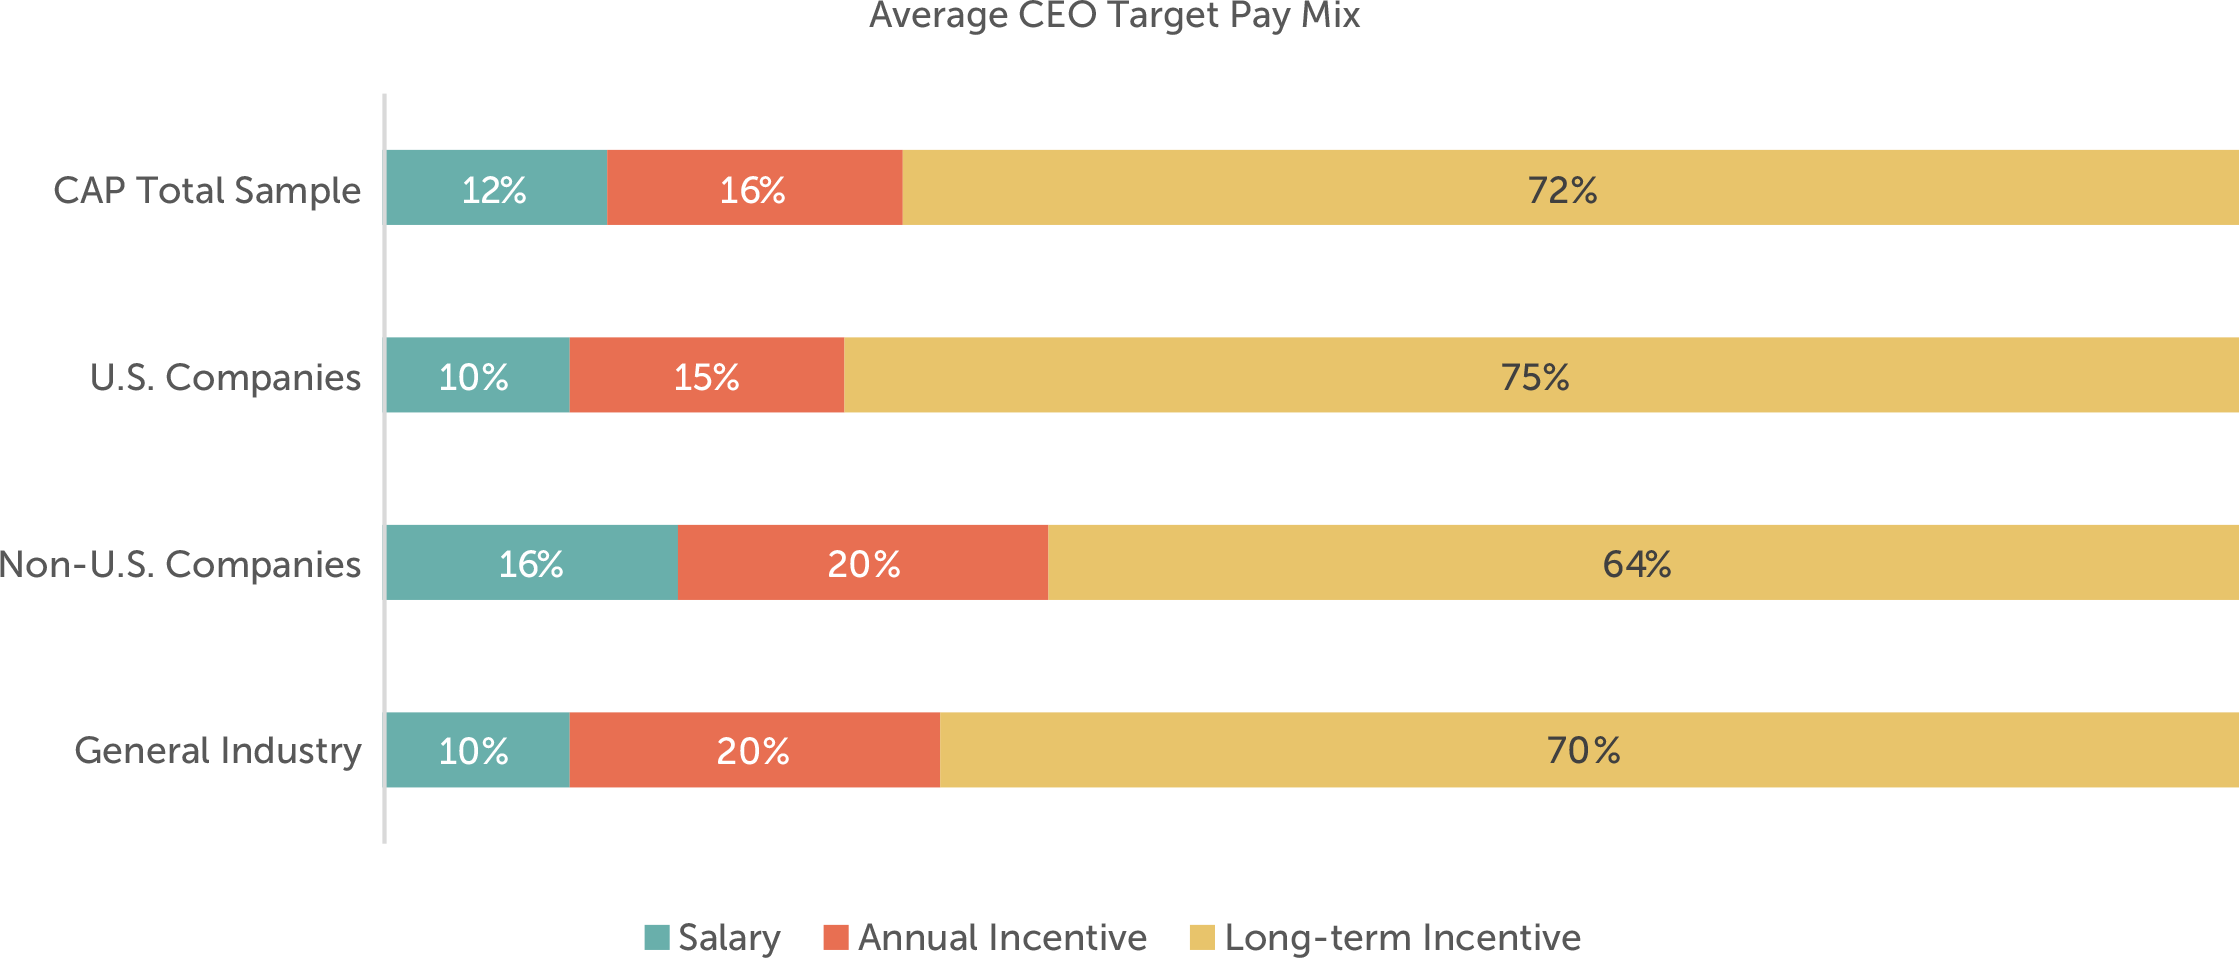
Pay Mix
Overall, pay mix for CEOs at companies in our sample is aligned with CEO pay mix in the broader U.S. market. Within the pharmaceutical industry, non-U.S. companies tend to place a greater emphasis on base salaries than U.S. companies (i.e., 16% vs. 10% of total pay). U.S. pharmaceutical companies place a greater emphasis on long-term incentive awards than both non-U.S. pharmaceutical companies and U.S. general industry companies.
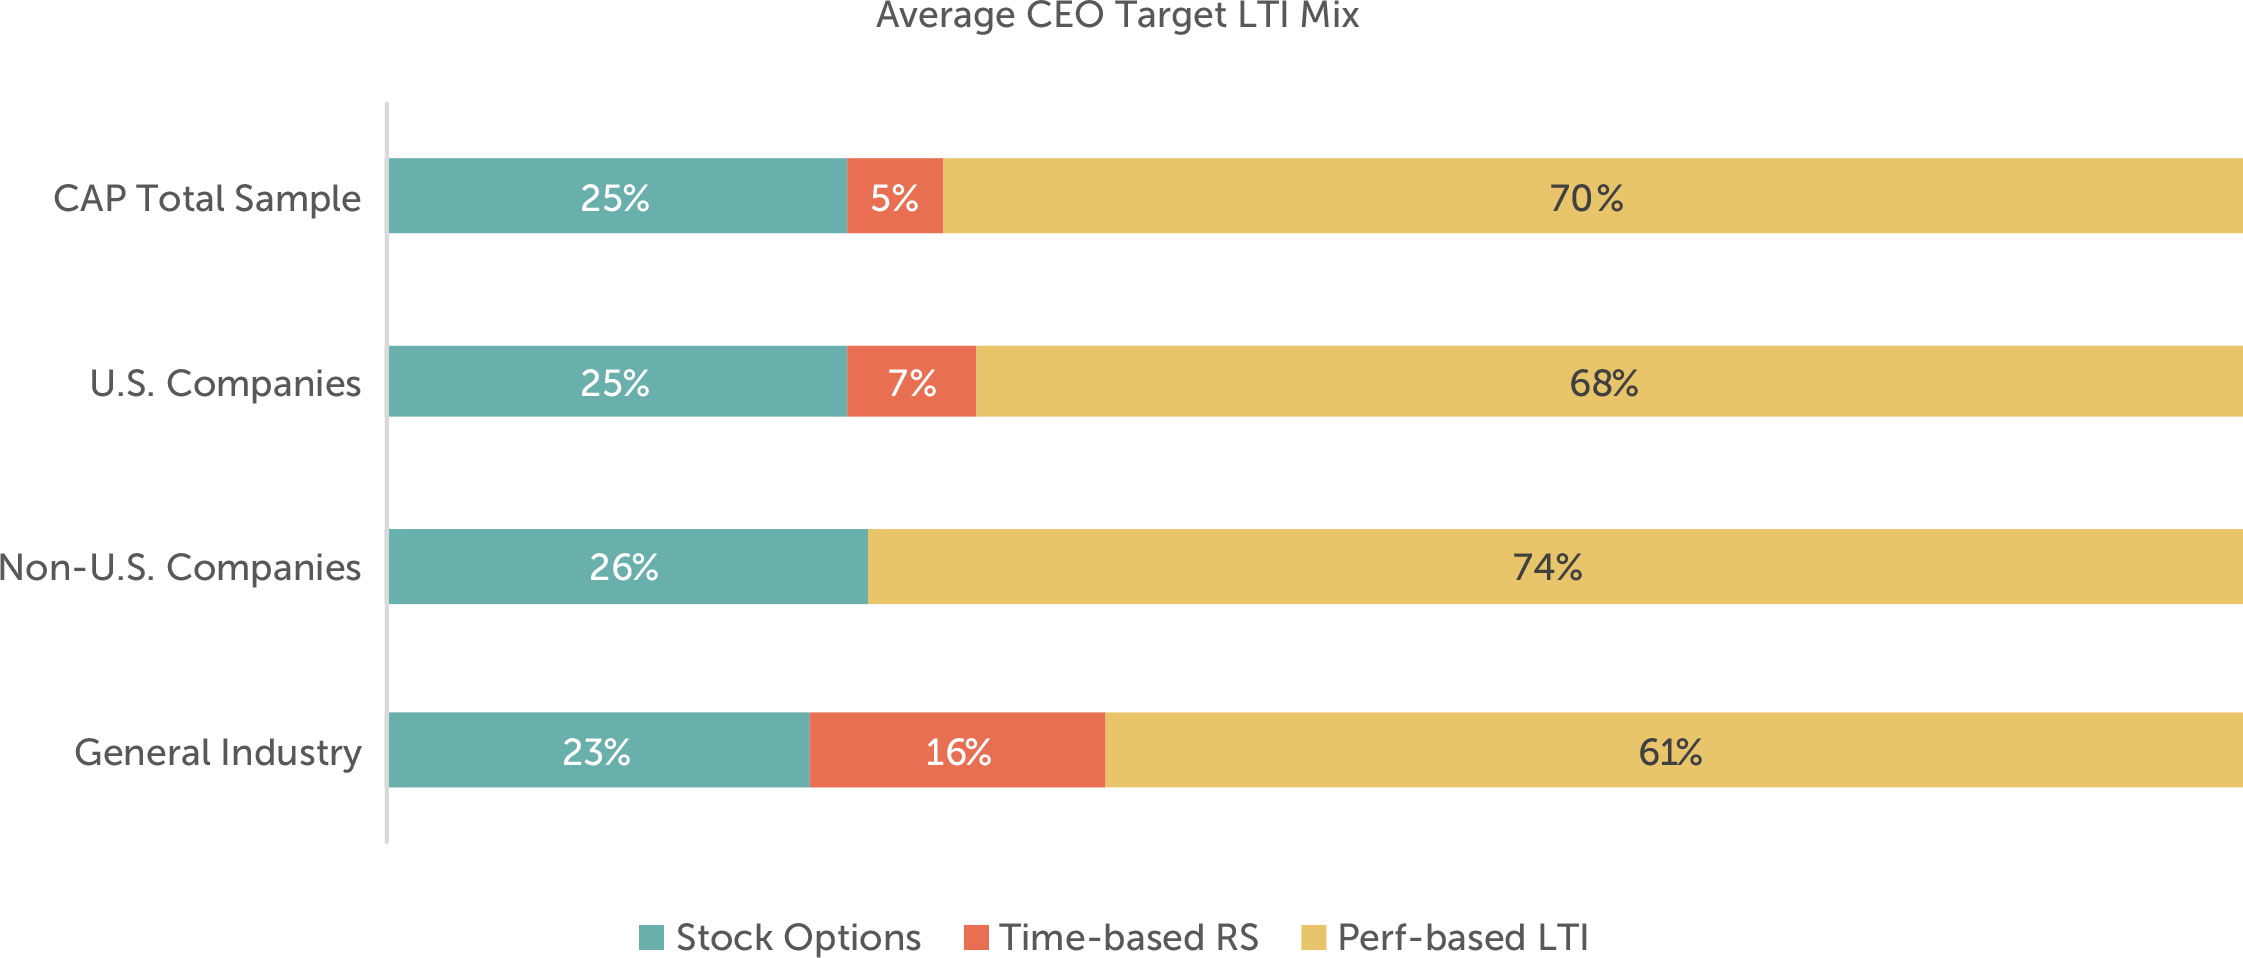
Long-term Incentive Mix and Long-term Performance Plan Design
While overall pay mix is consistent with general industry companies, pharmaceutical companies tend to grant a greater portion of their long-term incentive awards in performance-based vehicles and a smaller portion in time-based restricted stock or units than the broader U.S. market. The industry’s emphasis on long-term performance-based compensation creates a strong link between executive rewards and the length of product life-cycles, from drug development to product sales.
Similar to companies in the broader market, most pharmaceutical companies (88%) use relative TSR as a long-term incentive metric to align long-term performance plan payouts with the market’s view of future growth potential. Similar to annual incentives, long-term performance-based vehicles also tend to include sales and bottom-line income goals:
- 53% of companies use sales goals
- 41% of companies use net income or EPS goals
These metrics focus executives on long-term growth through new product sales or acquisitions while also maintaining profitability.
Looking Ahead for Executive Compensation in the Pharma Industry
Even as companies across industries are in a “wait and see” period as the current administration begins to tackle executive compensation-related issues, the pharmaceutical industry faces its own unique environment, where setting incentive plan goals is becoming ever more challenging.
The outlook for the U.S. market is growing increasingly complex as the industry faces intense scrutiny and the current administration tries to overhaul the Affordable Care Act. At the same time, the industry has experienced strong stock price performance to date in 2017, indicating the market’s continued confidence in future growth despite regulatory pressure and public scrutiny over drug prices.
In an industry where incentive plans are meant to reward prior performance, but the stock market is always looking forward, companies must continue to focus on setting incentive plan goals that reward executives for driving innovation and growth and therefore, align them with long-term shareholder returns.
For questions or more information, please contact:
Kelly Malafis Partner [email protected] 212-921-9357
Lauren Peek Principal [email protected] 212-921-9374
Michael Bonner Associate [email protected] 646-486-9744
Kyle Eastman Associate [email protected] 212-921-9362
Joanna Czyzewski and Whitney Cook provided research assistance for this report.
Pharmaceutical / Biotechnology Companies – Total Sample
AbbVie Inc.
Allergan plc
Amgen Inc.
AstraZeneca plc
Biogen Inc.
Bristol-Myers Squibb Co
Celgene Corp
Eli Lilly and Co
Gilead Sciences Inc.
GlaxoSmithKline plc
Johnson & Johnson
Merck & Co Inc.
Mylan N.V.
Novartis AG
Pfizer Inc.
Roche Holdings AG
Sanofi S.A.
Shire plc
Teva Pharmaceutical Industries Ltd