


DOWNLOAD A PDF OF THIS REPORT pdf(0.1MB)
Contact
Joanna CzyzewskiPrincipal [email protected] 646-486-9746 Kelly Malafis
Founding Partner [email protected] 212-921-9357
This report summarizes 2018 CEO pay and performance, as well as incentive compensation practices, for CAP’s large Pharma/Biotech sample. The 18 companies in CAP’s large Pharma/Biotech sample represent a mix of U.S. and non-U.S. firms that range in size from $11B to $82B in revenues.
Total direct compensation for the chief executive officers (CEOs) of 18 large, publicly traded Pharmaceutical and Biotechnology companies increased four percent in 2018, according to a Compensation Advisory Partners (CAP) analysis of 2019 public disclosures. Larger annual incentive payouts drove the increase in CEO total direct compensation for 2018. The CEOs received increased annual incentive payouts because their companies delivered consistent revenue growth and strong adjusted earnings per share (EPS) growth.
Key Takeaways
- Median CEO annual incentive payout was above target for the third year in a row
- Top-line and bottom-line metrics continue to be the most prevalent metrics in incentive plans. Most companies in the sample include pipeline in the annual incentive plan and all companies include TSR and/or absolute stock price performance in the long-term incentive plan
- Companies continue to place significant emphasis on performance-based compensation, with more than 85% of pay being variable
- External market factors will continue to provide challenges to pharma/biotech companies, including industry specific factors such as drug pricing
- Environmental, Social, and Governance (ESG) issues are an area of interest for many investors; it remains to be seen if and how it will impact executive compensation
2018 Performance
CAP’s Pharma/Biotech sample delivered strong financial results again in 2018. Median revenue for the sample increased five percent, following steady increases of six percent in the last two years. Adjusted EPS (non-GAAP) growth increased more significantly in 2018 (+11%), reflecting continued strong performance. The sample overall has had consistent improved financial performance for the last three years.
| Year | Median Financial Performance – CAP’s Pharma/Biotech Sample | Median Total Shareholder Return | |||
| Revenue Growth | Adjusted EPS Growth | CAP’s Pharma/Biotech Sample | S&P Global 1200 Index | S&P 500 Index | |
| 2016 | 6% | 8% | -7% | 11% | 15% |
| 2017 | 6% | 7% | 10% | 20% | 21% |
| 2018 | 5% | 11% | 1% | -9% | -7% |
Total shareholder return (TSR) has been a more volatile performance metric for the last three years, with 2018 market performance much weaker compared to 2017. While median TSR for CAP’s Pharma/Biotech sample was lower in 2018 vs 2017, the industry outperformed both the S&P 1200 Global Index and the S&P 500 Index. External factors, including tax reform, certainly gave a boost to 2017 market performance. 2018 performance for the industry continues to be impacted by public scrutiny over drug pricing practices, as well as drug pipeline results and expectations.
2018 CEO Pay
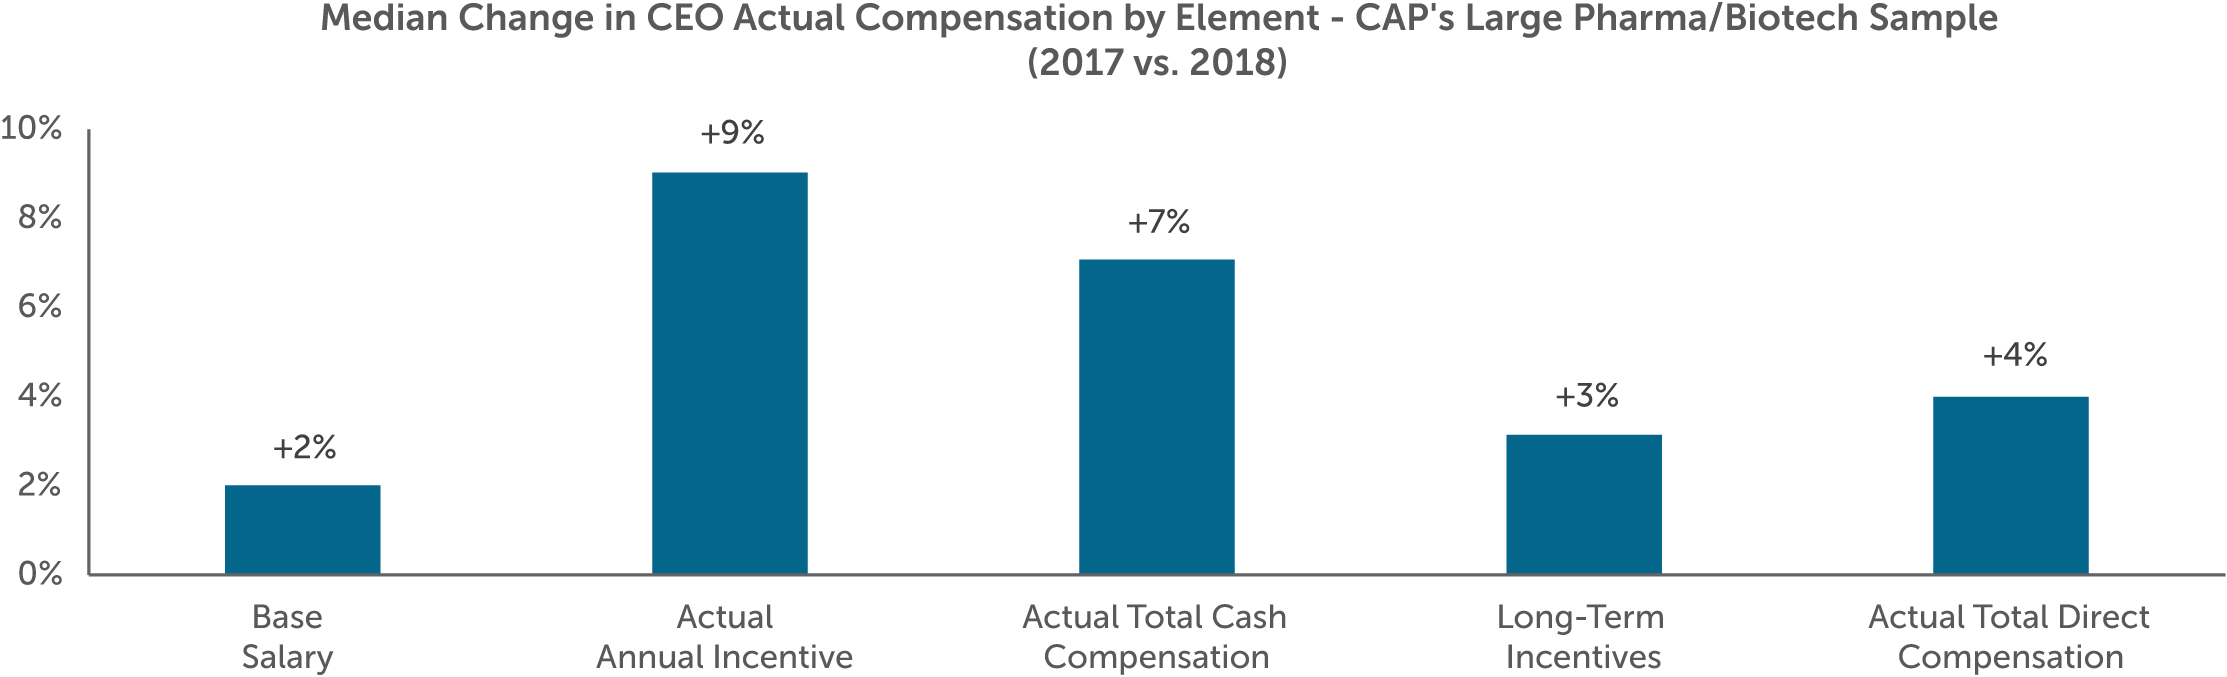
Median CEO total direct compensation for CAP’s Pharma/Biotech sample increased four percent for 2018. Total direct compensation includes base salary, which is a fixed element of compensation, plus actual annual and long-term incentive payouts, which are variable and performance-driven elements of compensation.
Fixed compensation saw modest increases (+2%), which was similar to prior years. Actual annual incentive payouts jumped nine percent in 2018. Long-term incentives also saw a modest increase (+3%).
Median annual incentive payouts as a percent of target have been steadily increasing year-over-year, in line with steady positive financial performance. Annual incentive payouts for CEOs in the Pharma/Biotech sample have paid out consistently above target for the past three years.
Among the CEOs in CAP’s Pharma/Biotech sample, the median annual incentive payout for 2018 performance was 137% of target, reflecting an increase of 12 percentage points over the prior year’s median. Payouts at the 75th and 25th percentiles also increased slightly. The spread between top quartile and bottom quartile has generally remained the same over the last three years.
| Summary Statistics | CEO Annual Incentive Payouts as a % of Target – CAP’s Pharma/Biotech Sample | ||
| 2016 | 2017 | 2018 | |
| 75th Percentile | 149% | 154% | 166% |
| Median | 119% | 125% | 137% |
| 25th Percentile | 109% | 110% | 122% |
Target Compensation Mix
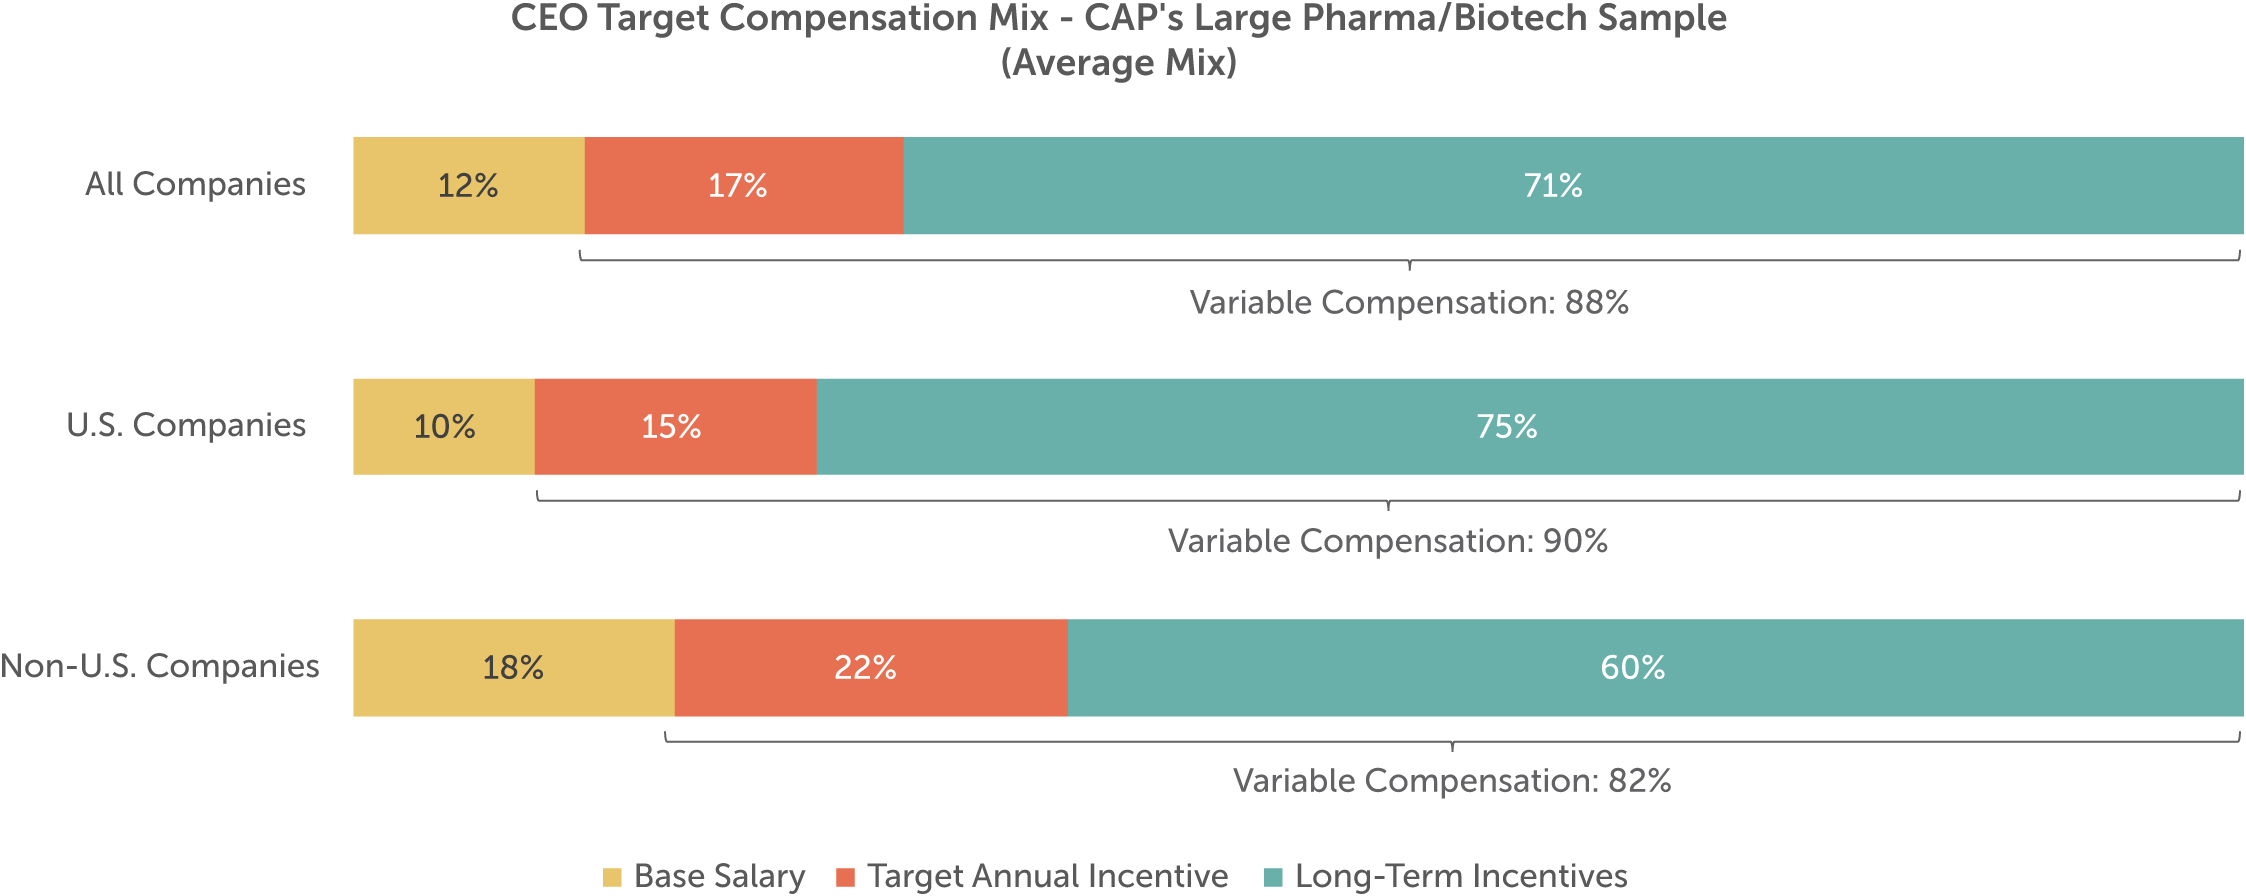
On average, the vast majority of target total direct compensation for CEOs of large public companies across all industries is delivered in the form of annual and long-term incentives, or variable compensation. Consistent with prior years, CEOs in CAP’s Pharma/Biotech sample receive approximately 90 percent of target compensation in the form of variable pay.
Pay practices differ among U.S. and non-U.S. companies, with non-U.S. companies placing more emphasis on fixed compensation. For non-U.S. companies in CAP’s sample, base salary accounts for approximately 18 percent of target compensation versus only 10 percent at U.S. companies. U.S. companies place significant emphasis on long-term incentives relative to their non-U.S. counterparts.
Annual Incentive Performance Metrics
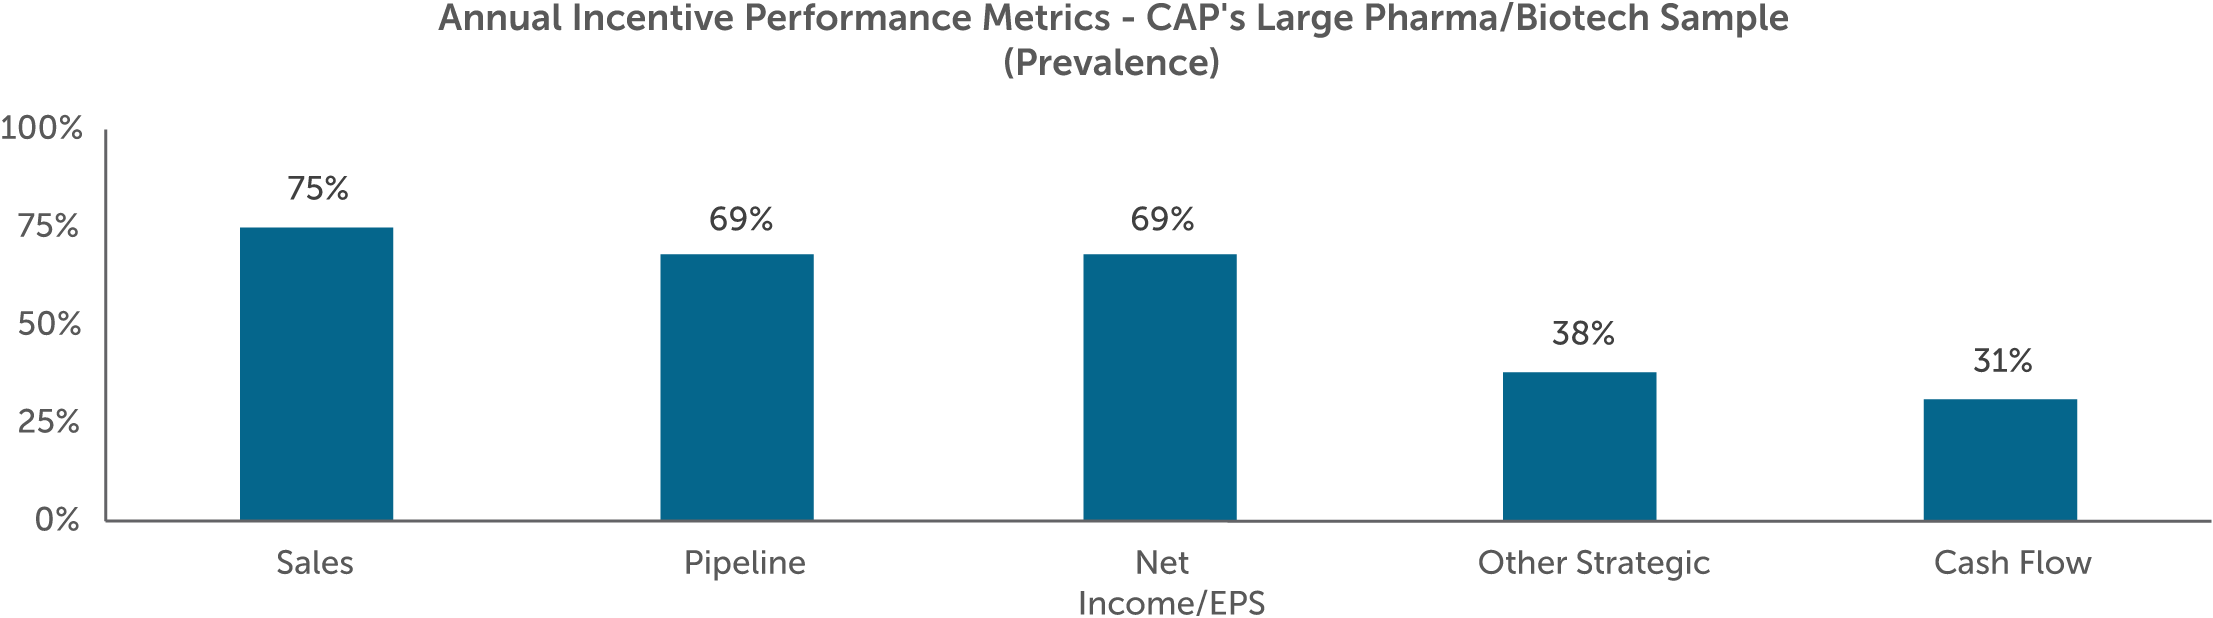
Companies in CAP’s Pharma/Biotech sample continue to focus on growth and profitability in the short-term, as evidenced by the two most prevalent financial performance metrics in annual incentive plans – revenue and earnings per share (EPS). For CEOs in the sample, individual performance is also considered in the determination of annual incentive payouts.
Strategic measures – in particular those focusing on the drug pipeline – are common among companies in our sample. Pipeline milestones across the spectrum of the research and development (R&D) lifecycle are important considerations for pharmaceutical and biotechnology as they race to advance life-enhancing therapies in the market. Other strategic metrics focus on business development, commercialization, and other organizational goals.
Corporate environmental, social, and governance (ESG) issues have been a hot topic in recent times for the media and investors. In our experience, organizations and boards have mixed views regarding the inclusion of ESG goals in their incentive plans. When an ESG goal is included as a measure, it is often incorporated with a relatively low weighting (10% or less) or considered within individual goals. In CAP’s Pharma/Biotech sample, one company (Novartis) discloses the use of corporate responsibility and environmental sustainability goals within its strategic objectives.
Long-Term Incentive Vehicles & Mix
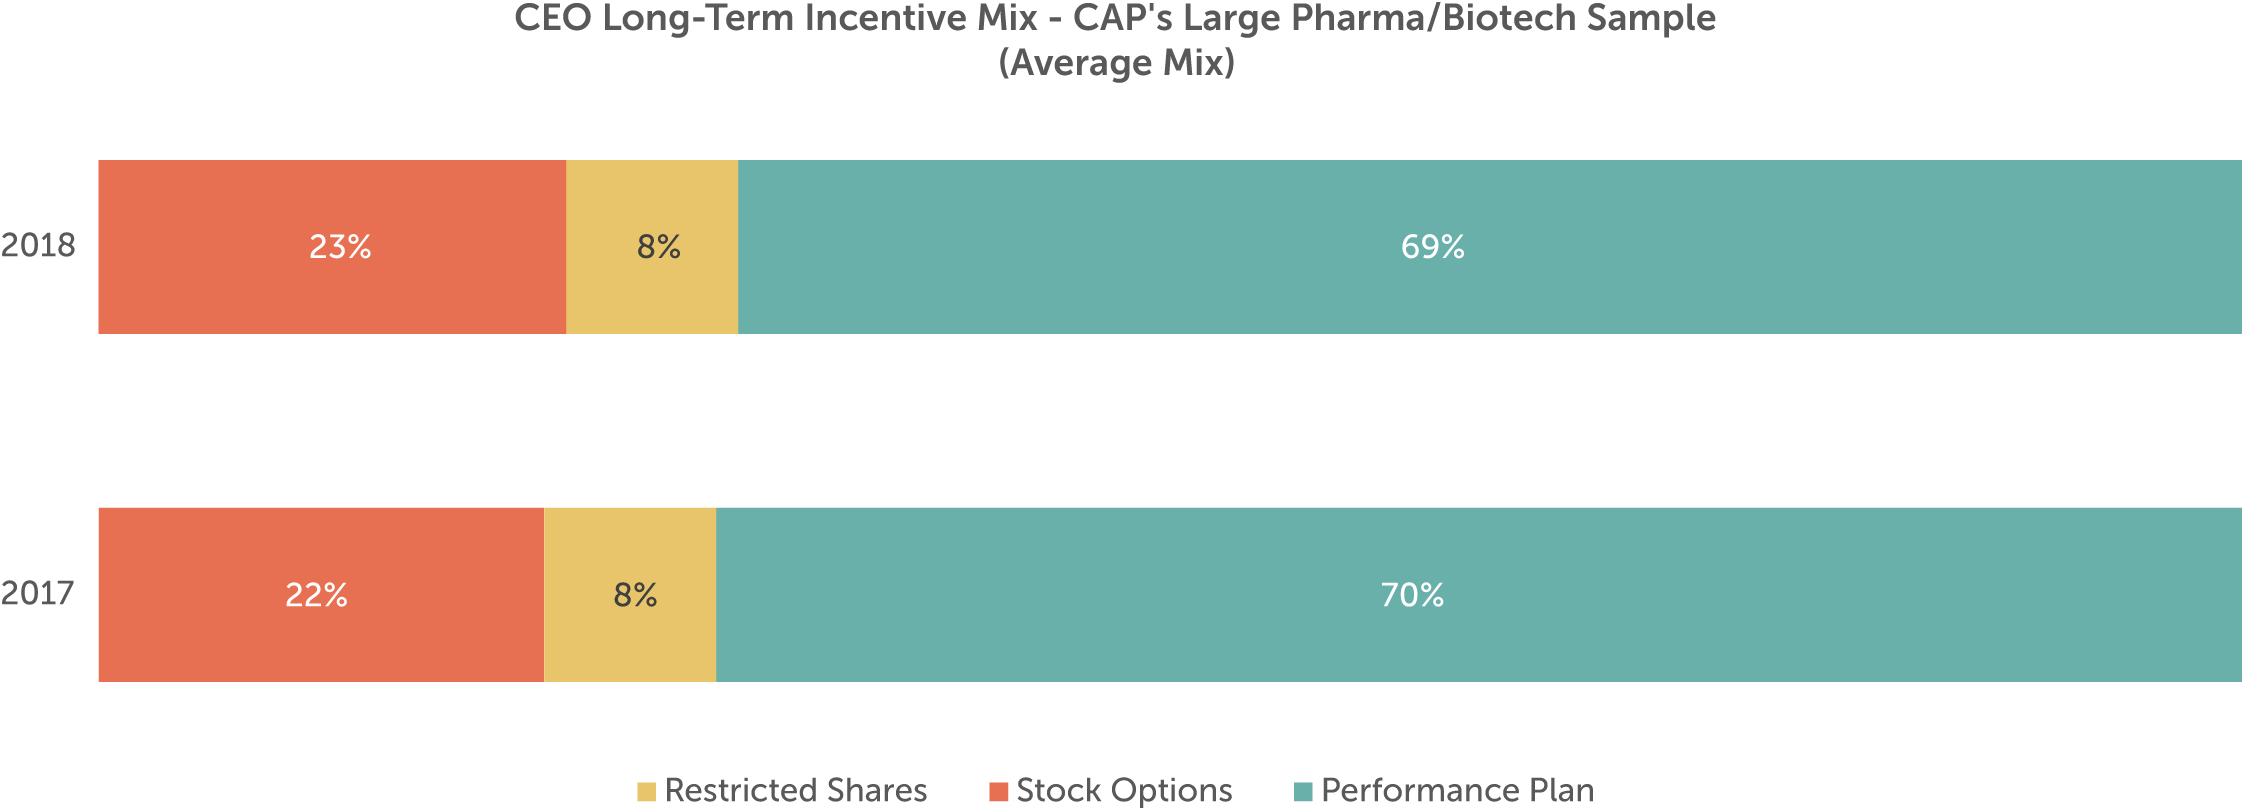
Long-term incentives comprise the largest part of compensation for CEOs in CAP’s sample (approximately 70%, on average). These awards tie executive compensation to longer-term company performance objectives and are typically delivered through equity with multi-year vesting periods.
Long-term incentive vehicles fall into three broad categories: (1) time-vested restricted stock shares (or units); (2) time-vested stock options (or stock appreciation rights); and (3) long-term performance plans. Performance plans can include performance shares (or units), performance-vested stock options, and performance-based cash compensation with multi-year performance criteria.
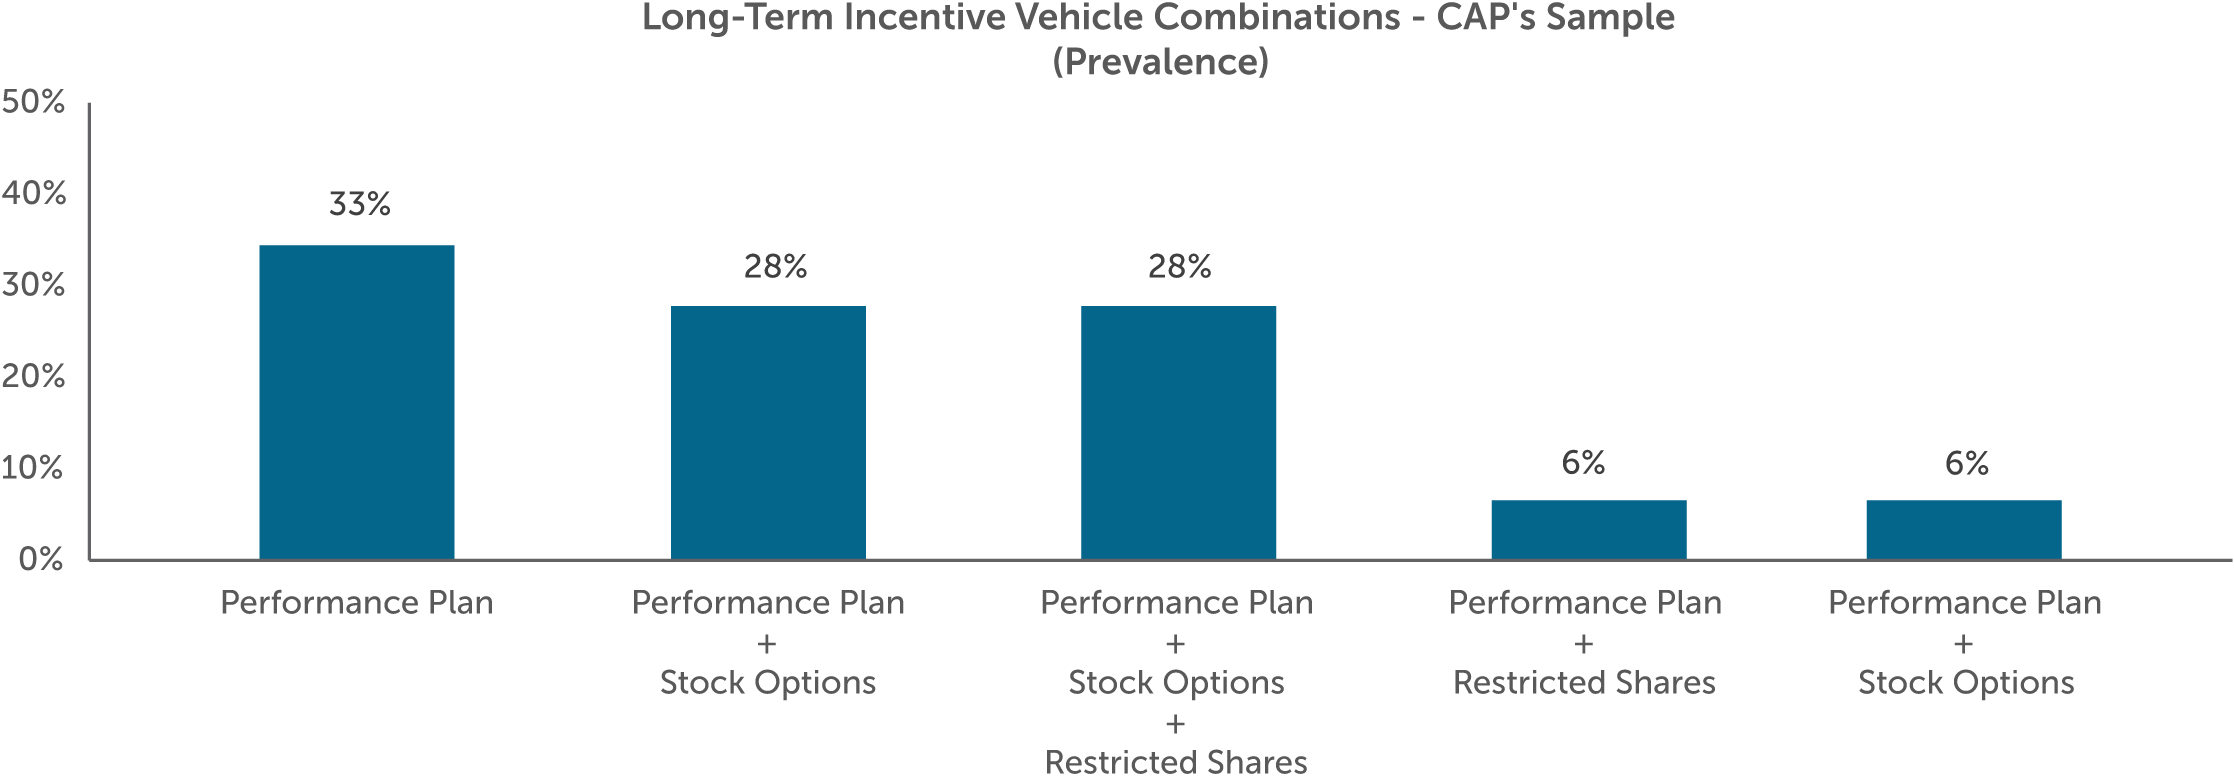
Among large public companies across industries, performance plans are the most common vehicle for delivering long-term incentives to the CEO. The same is true for CAP’s Pharma/Biotech sample. Of the companies in our sample, performance plans comprise almost three-quarters of the total long-term incentive mix, on average. About a third of companies use performance plans exclusively as their only long-term incentive vehicle.
Long-Term Incentive Performance Metrics
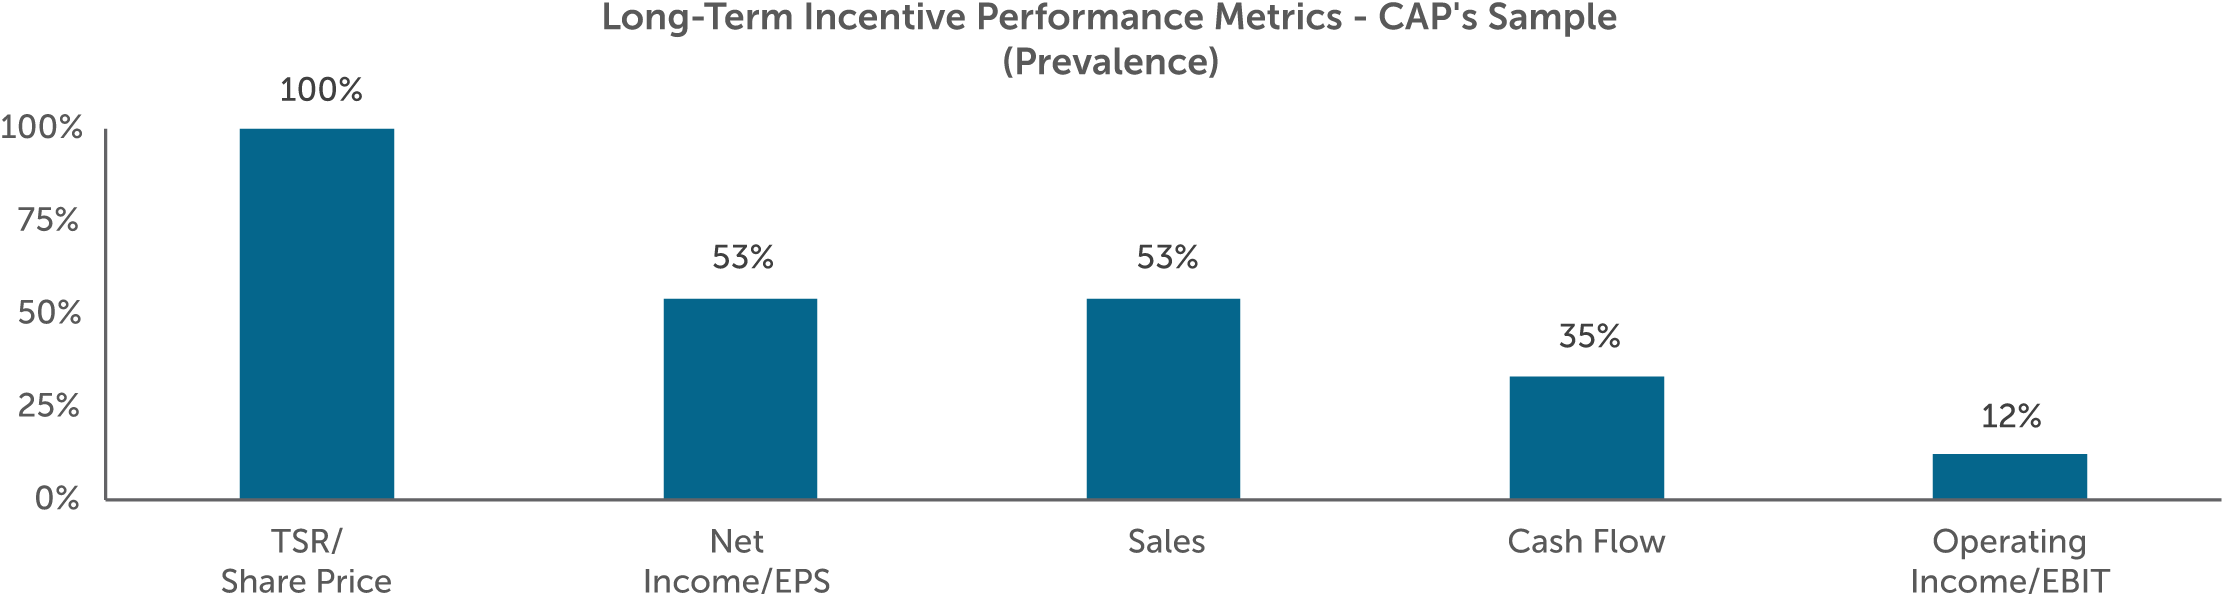
Long-term incentives generally focus on and reward value creation over a three-to-five-year timeframe. In our sample, all companies with a performance plan use either relative total shareholder return (TSR) or absolute stock price as a metric. Approximately one-third of the companies in CAP’s sample use relative TSR as a modifier to performance results.
Similar to annual incentives, long-term performance plans use growth and profitability financial metrics. The most prevalent metrics include net income/EPS, sales, and cash-flow measures.
Additional Information – Shareholder Proposals around Drug Pricing
Pharmaceutical companies have faced increased scrutiny by regulators over the last couple of years, especially around the issue of drug pricing. A handful of companies in our sample have received shareholder proposals around drug pricing and tying executive compensation to the drug-pricing process. These proposals are asking for increased disclosure on how drug pricing strategies impact executive compensation. Five pharmaceutical/biotechnology companies included this proposal in their 2019 proxy statements, with these proposals generally receiving 20 percent to 30 percent shareholder support.
Looking Ahead
2019 opened with two notable acquisitions within the industry (Bristol-Meyers/Celgene and Eli Lilly/Loxo Oncology). While the pharmaceutical/biotechnology industry is relatively compact already, consolidation may continue in the future as companies struggle with combating high R&D costs and uncertain pipeline success rates. More companies will have drugs coming off patent in the next few years, leading to more generic drug competition. With increased pressure surrounding high drug prices in the market and regulators becoming more cautious in approving new and innovative treatments, pharmaceutical/biotechnology companies will have increased pressure to maintain a successful pipeline.
Median first quarter total shareholder return for CAP’s Pharma/Biotech sample was six percent, trailing both the S&P Global 1200 (12%) and the S&P 500 (15%) Indices. We expect companies and compensation committees to continue to align CEO payouts with overall performance.
The Large Pharma/Biotech sample continues to show consistency in incentive plan design, with the different companies having similar strategic priorities. ESG issues will continue to be an area of focus, but we do not believe it will become a primary driver of incentive payouts. Companies and compensation committees will continue to evaluate their incentive plan designs to ensure alignment with organizational priorities, while considering market and regulatory developments.
For questions or more information, please contact:
Kelly Malafis, Partner
[email protected] 212-921-9357
Joanna Czyzewski, Associate
[email protected] 646-486-9746
Diane Lee and Joshua Hovden provided research assistance for this report.
CAP’s Pharma/Biotech Sample:
- AbbVie Inc.
- Allergan plc
- Amgen Inc.
- AstraZeneca PLC
- Biogen Inc.
- Bristol-Myers Squibb Company
- Celgene Corporation
- Eli Lilly and Company
- Gilead Sciences, Inc.
- GlaxoSmithKline plc
- Johnson & Johnson
- Merck & Co., Inc.
- Mylan N.V.
- Novartis AG
- Pfizer Inc.
- Roche Holding AG
- Sanofi
- Teva Pharmaceutical Industries Limited
