DOWNLOAD A PDF OF THIS REPORT pdf(0.1MB)
Contact
Kelly MalafisFounding Partner [email protected] 212-921-9357 Lauren Peek
Partner [email protected] 212-921-9374
This report summarizes 2017 CEO pay and performance, as well as incentive compensation practices, for a sample of 19 large public Pharmaceutical and Biotechnology companies. CAP’s Pharma/Biotech sample includes a balance of U.S. and non-U.S. companies.
Key Takeaways
- For the second year in a row, median annual incentive payout was well above target (124% in 2017 and 121% in 2016) reflective of consistent strong performance.
- Top-line and bottom-line metrics as well as pipeline are the most prevalent metrics in the annual incentive plan.
- Companies place a significant emphasis on performance plans in the long-term incentive (LTI) mix with all companies in our sample using performance-based LTI; on average, performance plans are 75% of the mix.
- All companies use total shareholder return (TSR) and/or absolute stock price performance to measure long-term performance, usually in combination with at least one financial metric.
- We expect external factors, such as scrutiny regarding drug pricing and continued uncertainty with healthcare reform, will continue to pose challenges for companies in the industry.
2017 Performance
The industry overall had a good year in 2017, as companies continued to grow revenue, manage expenses, and maintain operating margins. Median 2017 financial performance for CAP’s Pharma/Biotech sample was largely consistent with 2016, building on prior-year growth. Revenue growth of 6% was unchanged year over year, and adjusted operating margin held steady at 32%. Adjusted EPS growth decreased slightly, from 9% in 2016 to 8% in 2017.
| Year | Median Financial Performance – CAP’s Pharma/Biotech Sample | ||
| Revenue Growth | Adjusted Operating Margin | Adjusted EPS Growth | |
| 2016 | 6% | 32% | 9% |
| 2017 | 6% | 32% | 8% |
| Y/Y Change | No Change | No Change | -1% pts |
The industry recovered somewhat in 2017, with median total shareholder return (TSR) improving by 16 percentage points, flipping from -7% in 2016 to +9% in 2017. However, CAP’s Pharma/Biotech sample underperformed the broader market for the second year in a row. Industry-specific factors, such as public scrutiny over high drug prices globally, along with uncertainty surrounding the future of healthcare legislation in the U.S., likely contributed to this underperformance. Individual company stock price performance is highly influenced by pipeline expectations, successes, and failures.
| Group | Median Total Shareholder Return | ||
| 2016 | 2017 | Y/Y Change | |
| CAP’s Pharma/Biotech Sample | -7% | 9% | +16% pts |
| S&P Global 1200 Index | 10% | 18% | +8% pts |
| S&P 500 Index | 15% | 20% | +5% pts |
2017 CEO Pay
Consistent year-over-year financial performance translated to consistent year-over-year annual incentive payouts. Similar to the prior year, many companies provided above-target payouts.
Among the CEOs in CAP’s Pharma/Biotech sample, the median annual incentive payout for 2017 performance was 124% of target, reflecting an increase of 3 percentage points over the prior year’s median. Payout increases at the low and high ends of the range were similarly modest. The 25th percentile payout increased 2 percentage points to 111% of target, and the 75th percentile payout increased 1 percentage point to 151% of target.
| Summary Statistics | CEO Annual Incentive Payouts as a % of Target – CAP’s Pharma/Biotech Sample | ||
| 2016 | 2017 | Y/Y Change | |
| 75th Percentile | 150% | 151% | +1% pts |
| Median | 121% | 124% | +3% pts |
| 25th Percentile | 109% | 111% | +2% pts |
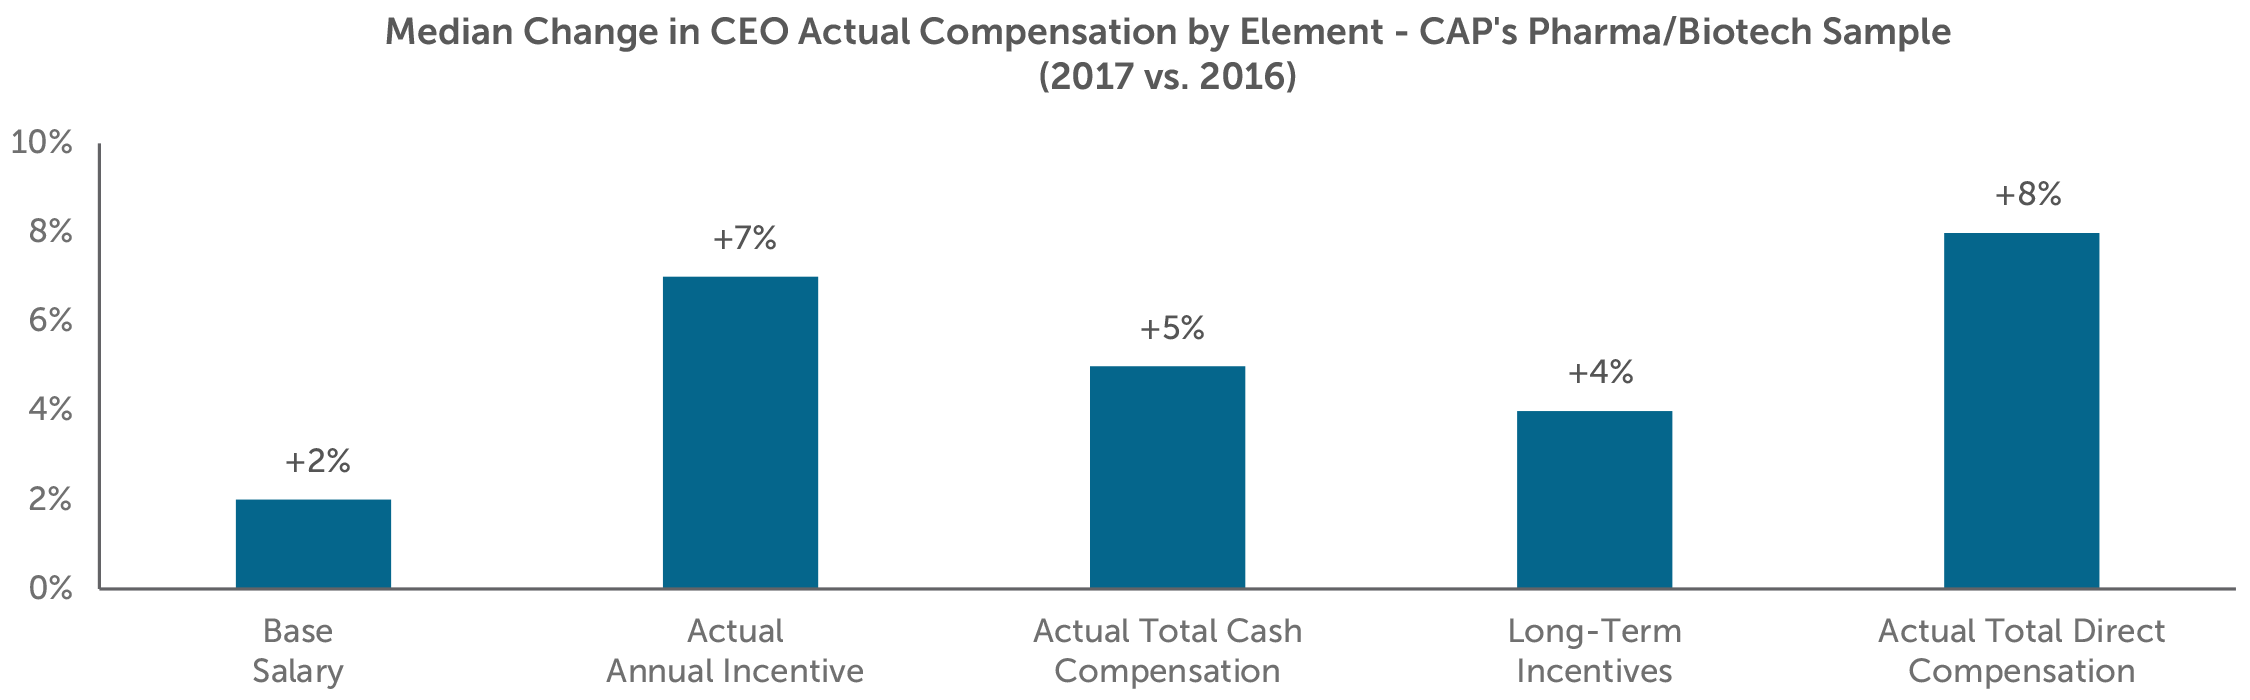
The median increase in actual total direct compensation (defined as the sum of base salary, actual annual incentive, and long-term incentives) for the CEOs in CAP’s Pharma/Biotech sample was 8% for 2017.
For the most part, increases in variable compensation (i.e., annual and long-term incentives) exceeded increases in fixed compensation. The median annual incentive increase and long-term incentive increase were 7% and 4%, respectively, while the median base salary increase was just 2%.
Incentive Compensation Practices
Target Compensation Mix
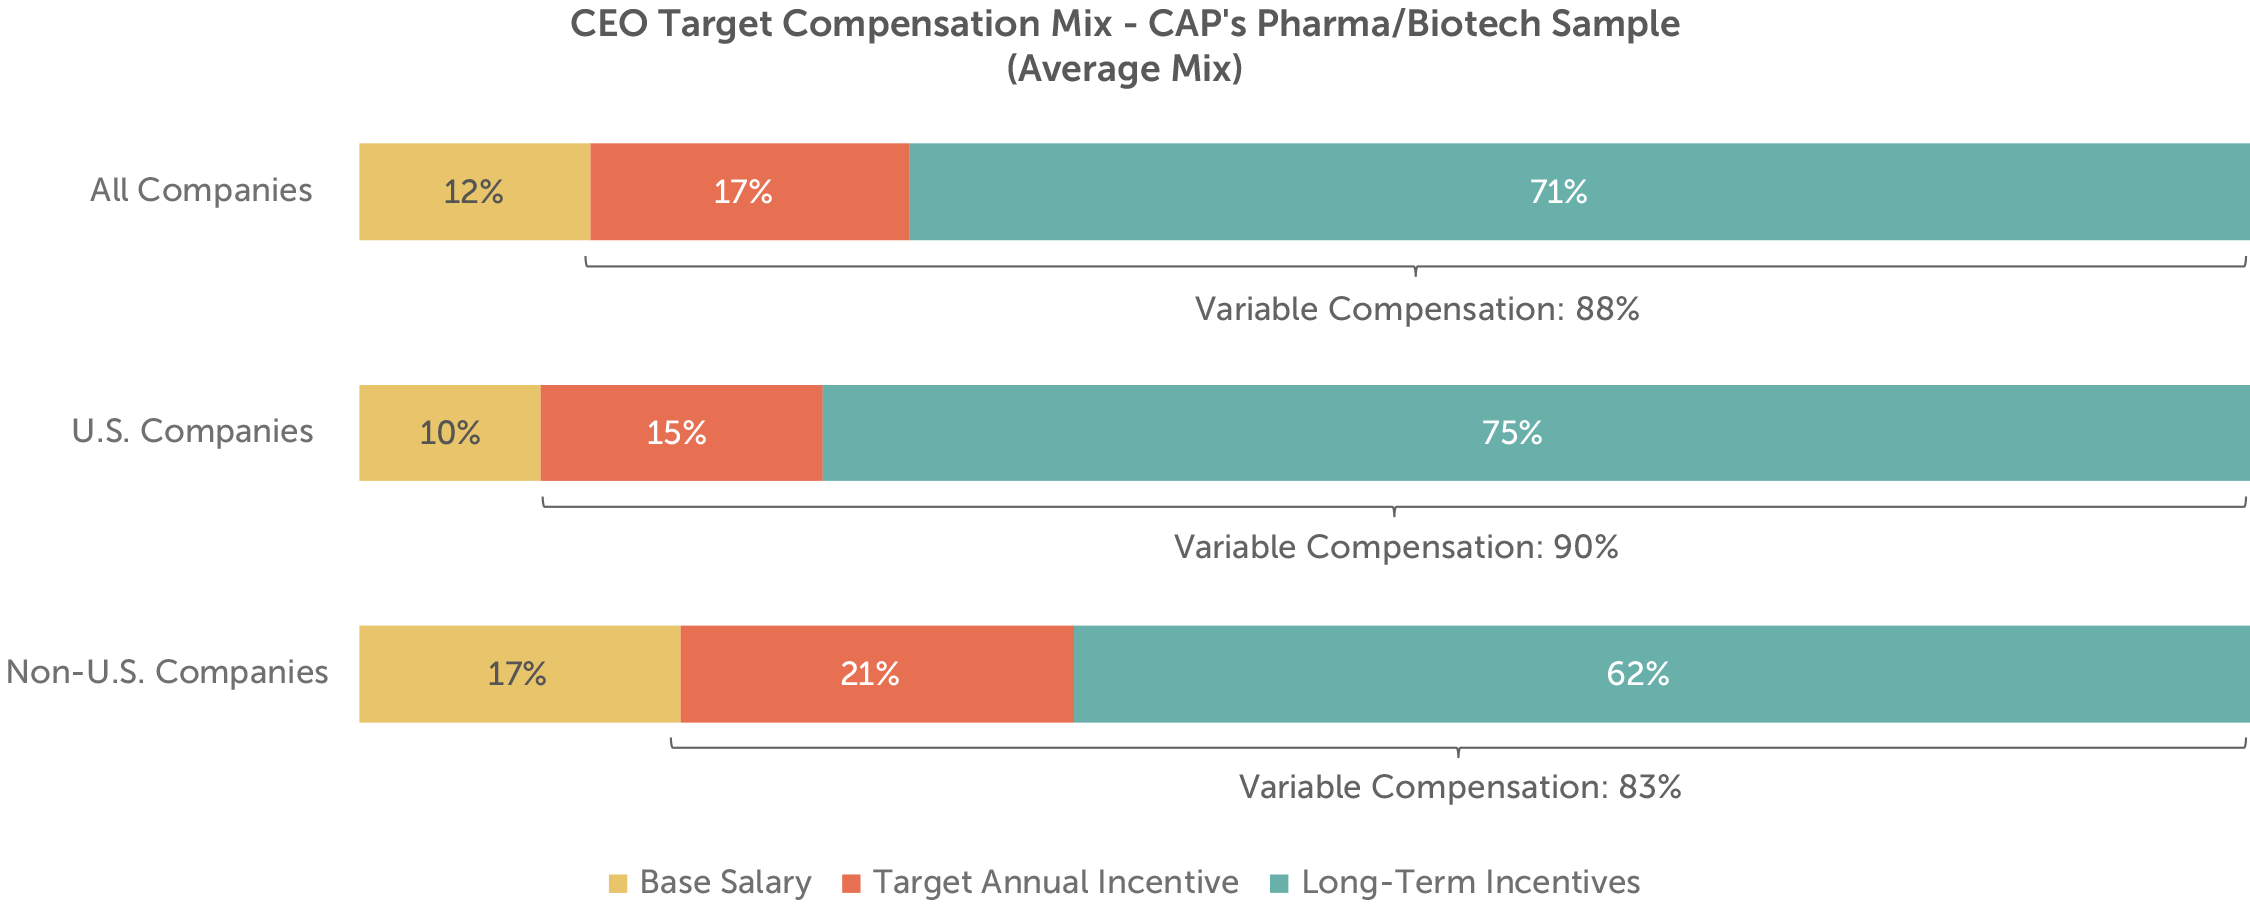
Generally, 80% to 90% of target total direct compensation for CEOs of large public companies is delivered in the form of variable compensation. Among CAP’s Pharma/Biotech sample, variable compensation accounts for 88% of target total direct compensation, on average.
Consistent with prior-year findings, there is a notable difference in target compensation mix between the U.S. companies and the non-U.S. companies in CAP’s Pharma/Biotech sample. On average, the U.S. companies place more emphasis on long-term incentives, and correspondingly less emphasis on base salary and target annual incentive.
Annual Incentive Performance Metrics
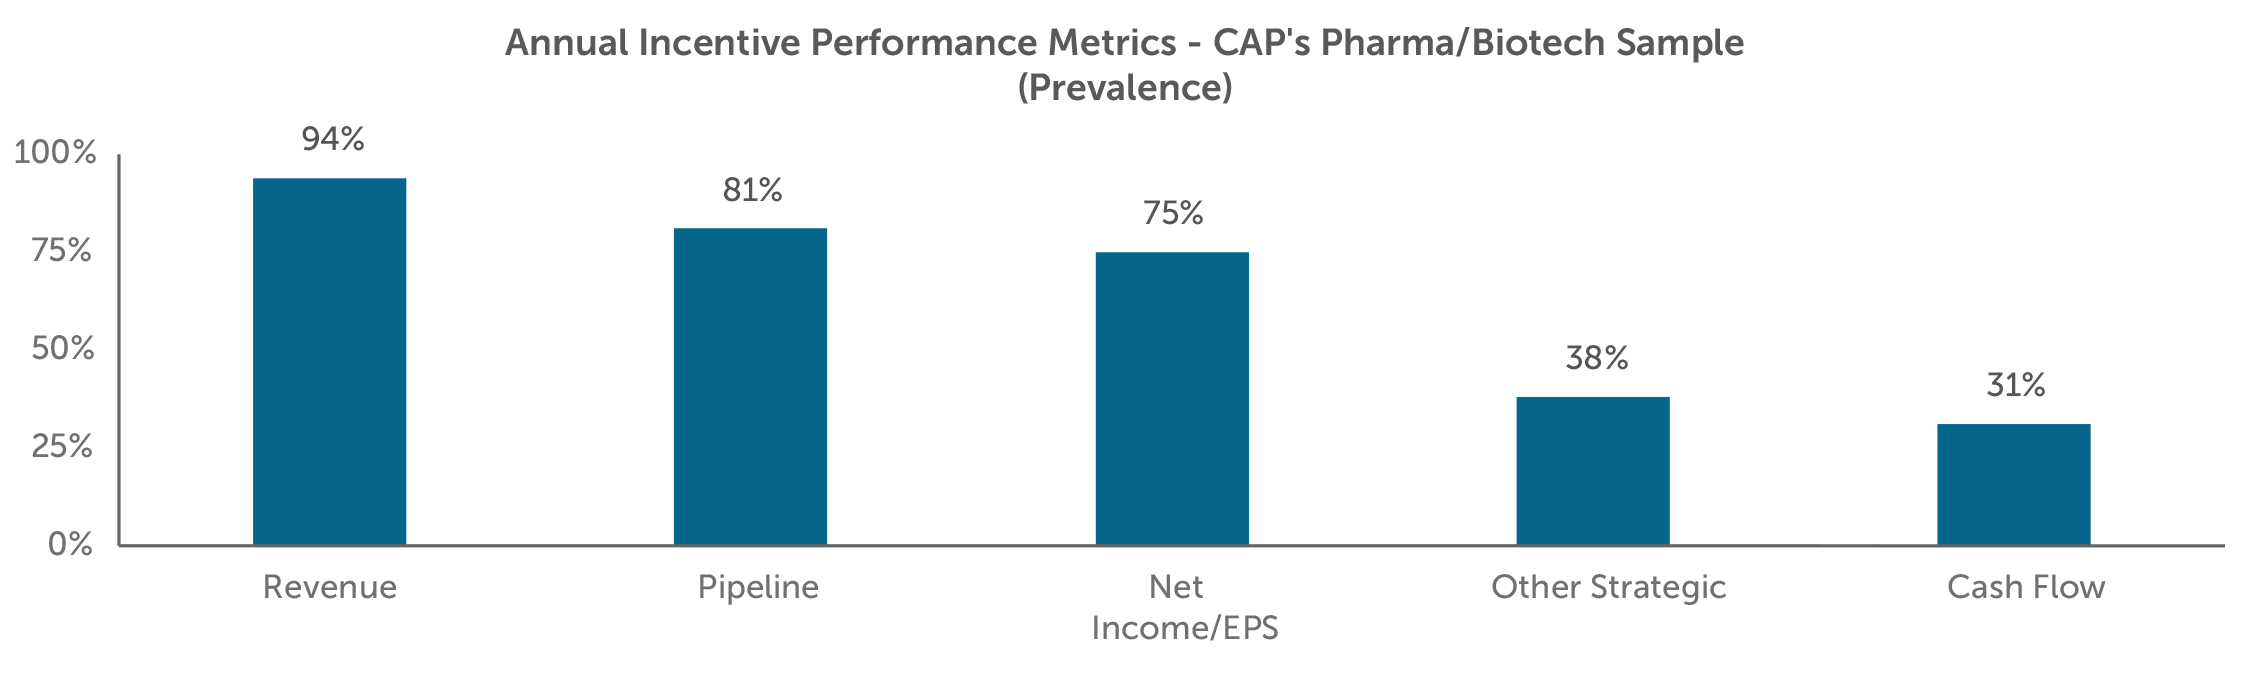
The objectives underlying annual incentive plans are often associated with short-term growth and profitability, and encourage successful performance against individual objectives. This is reflected in the two most prevalent financial performance metrics among CAP’s Pharma/Biotech sample – revenue and net income (or EPS). Almost all of the companies in CAP’s Pharma/Biotech sample use a “top-line” revenue metric in addition to one or more “bottom-line” income metrics.
The use of pipeline and other strategic metrics is also common. Tying compensation to pipeline efforts is critical, as Pharmaceutical and Biotechnology companies must continuously innovate to remain competitive. Additional reasons to focus executives on R&D are its high costs and corresponding uncertainty around success or failure. Developing a new drug can take upwards of ten years and require billions of dollars of investment, and the eventual loss of exclusivity on key products invites competition from generics and biosimilars. Among CAP’s Pharma/Biotech sample, other (i.e., non-pipeline) strategic metrics typically reward executives for the successful launch and commercialization of new products, as well as organizational accomplishments.
Long-Term Incentive Vehicles & Mix
Long-term incentives tie executive compensation to performance against longer-term company objectives. Awards are typically delivered using equity-based vehicles with multi-year vesting periods, which helps to align the interests of executives with those of shareholders, while also serving as a retention tool.
Long-term incentive vehicles can be bucketed into three broad categories: (1) time-vested restricted shares (or units); (2) time-vested stock options (or stock appreciation rights); and (3) long-term performance plans. Performance plans include performance shares (or units), performance-vested stock options, and performance-based cash compensation with multi-year performance criteria.
Among large public companies generally, a performance plan is the most common vehicle for delivering long-term incentives to the CEO. The same is true for CAP’s Pharma/Biotech sample.
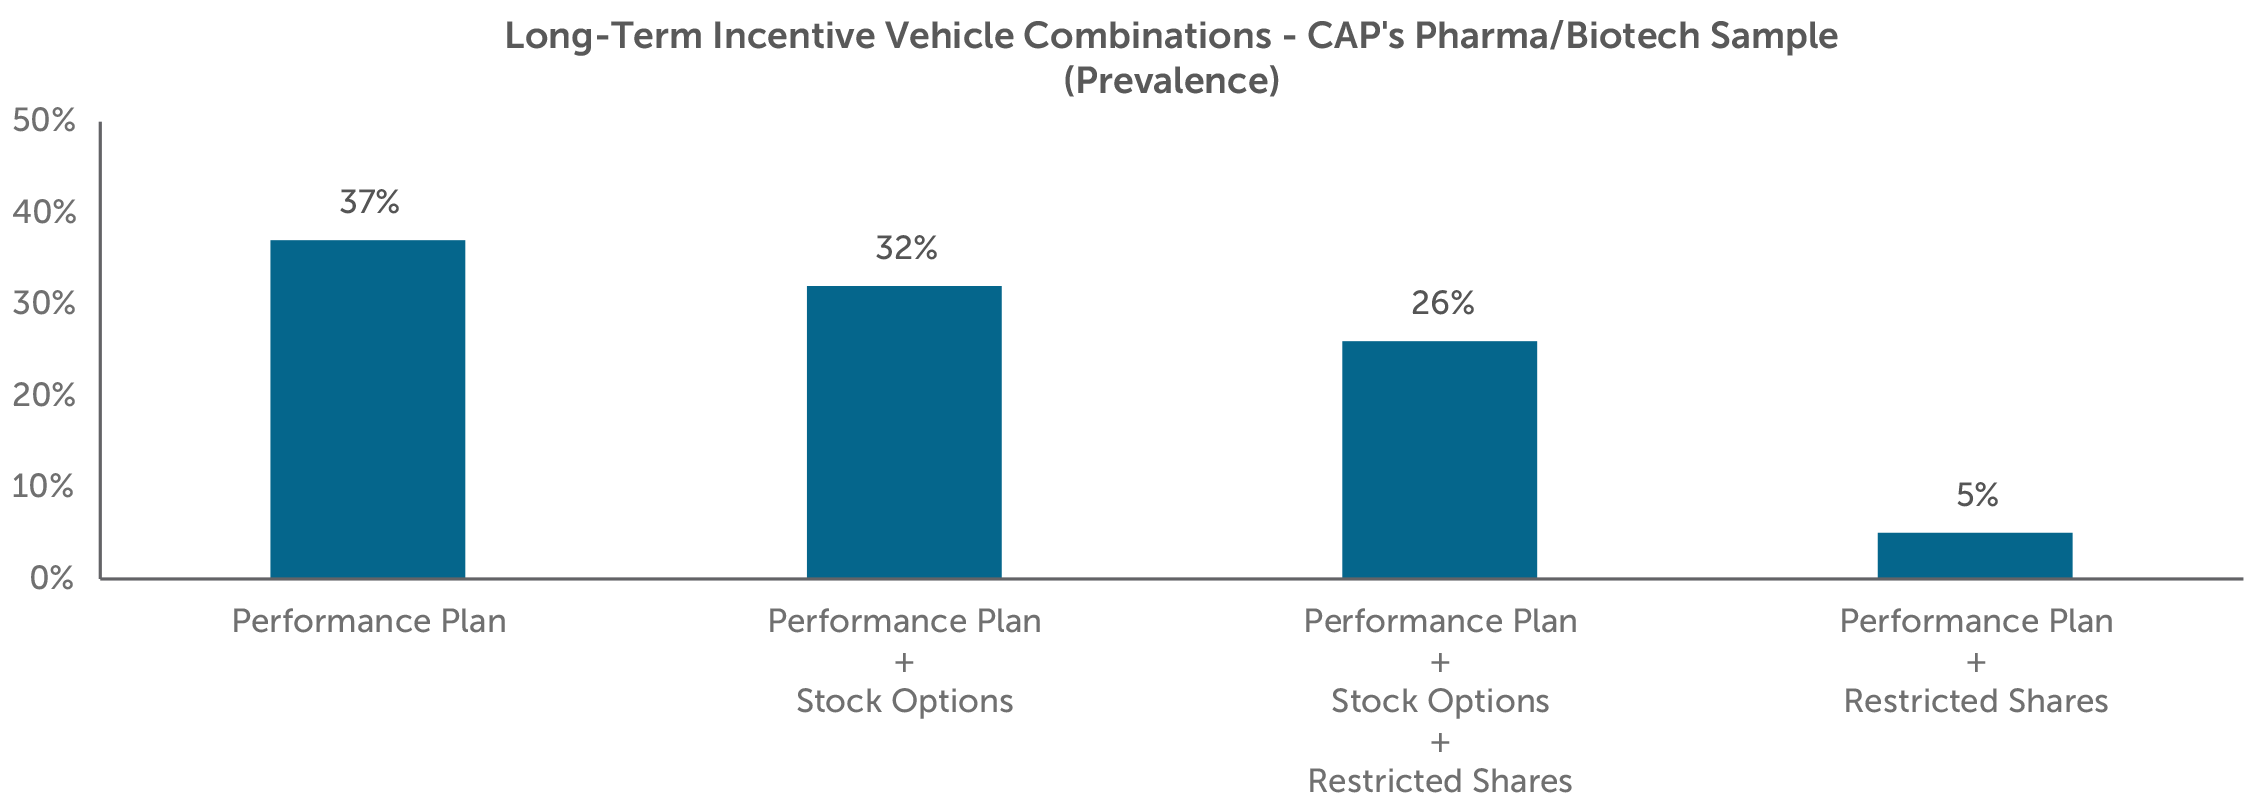
Over the past several years, the average long-term incentive mix for CEOs of large public companies has shifted toward performance plans and away from stock options and, to a lesser extent, restricted shares. Among CAP’s Pharma/Biotech sample, performance plans now make up close to three-quarters of the average long-term incentive mix, largely because all the companies in CAP’s Pharma/Biotech sample use a performance plan, and more than a third of these companies use a performance plan as the only long-term incentive vehicle.
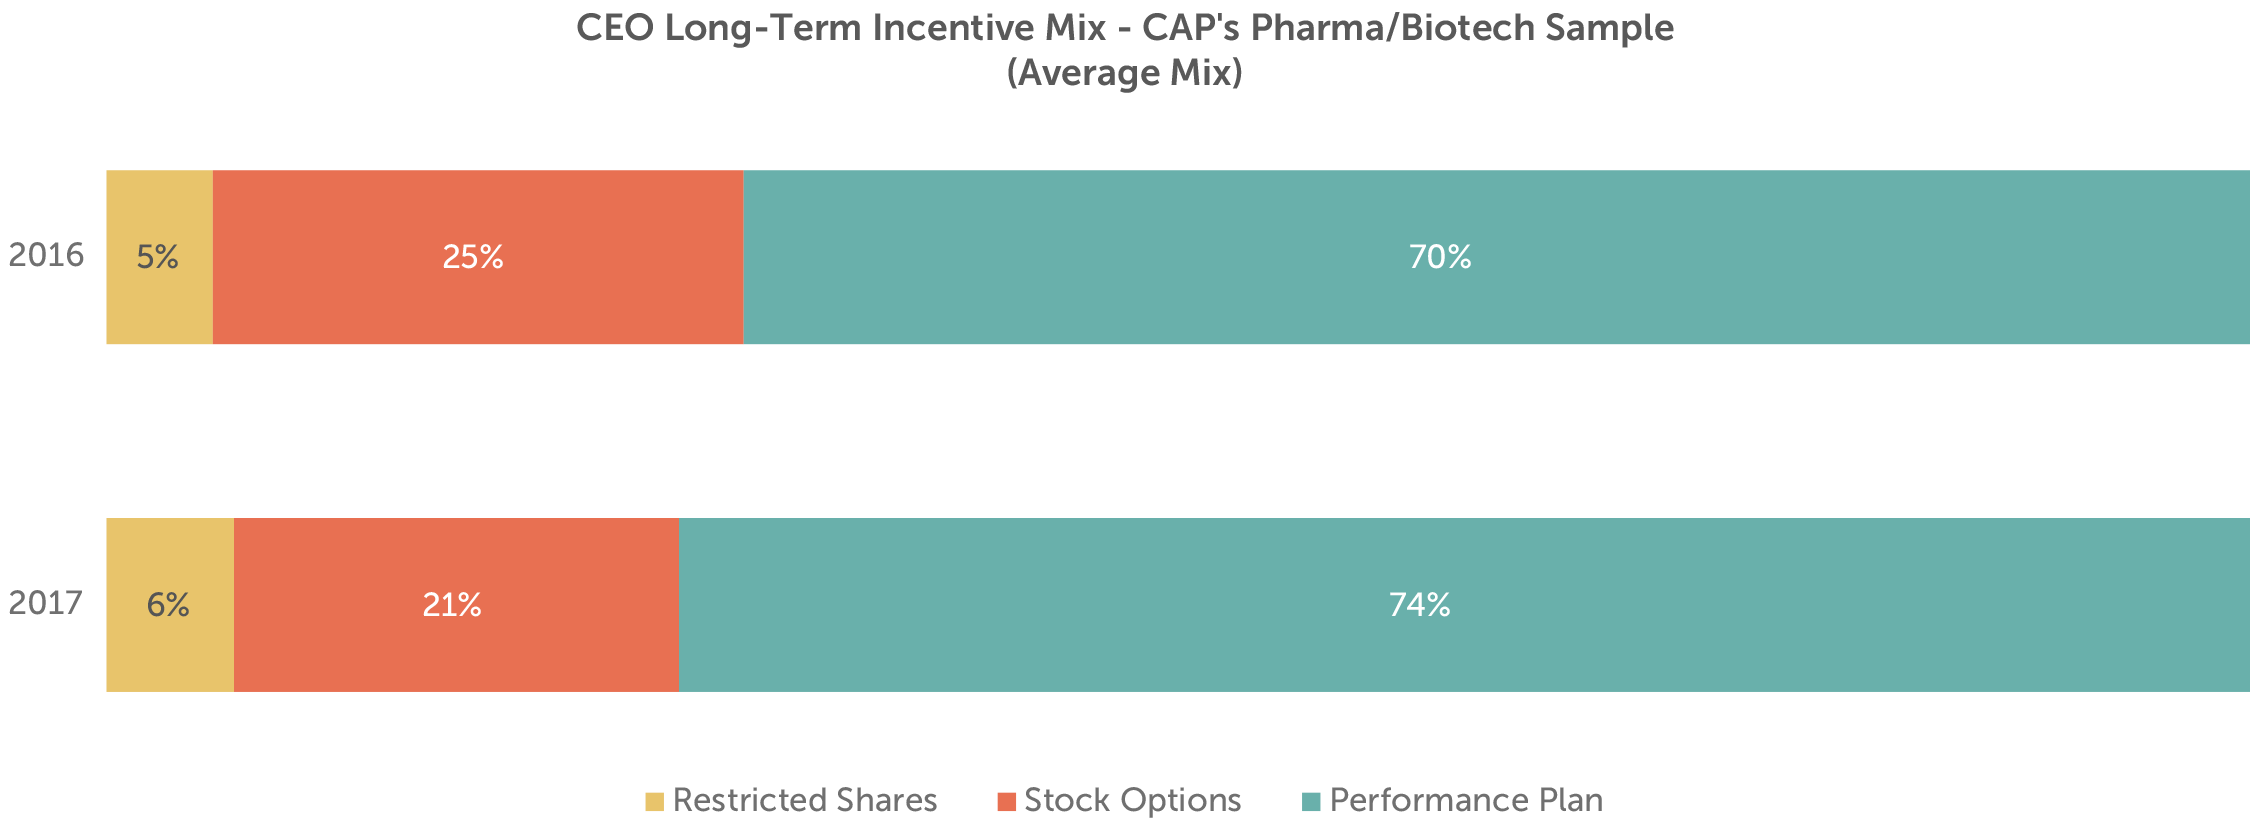
Most of the companies in CAP’s Pharma/Biotech sample supplement the use of a performance plan with stock options (32% of CAP’s Pharma/Biotech sample), restricted shares (5%), or both stock options and restricted shares (26%).
Long-Term Incentive Performance Metrics
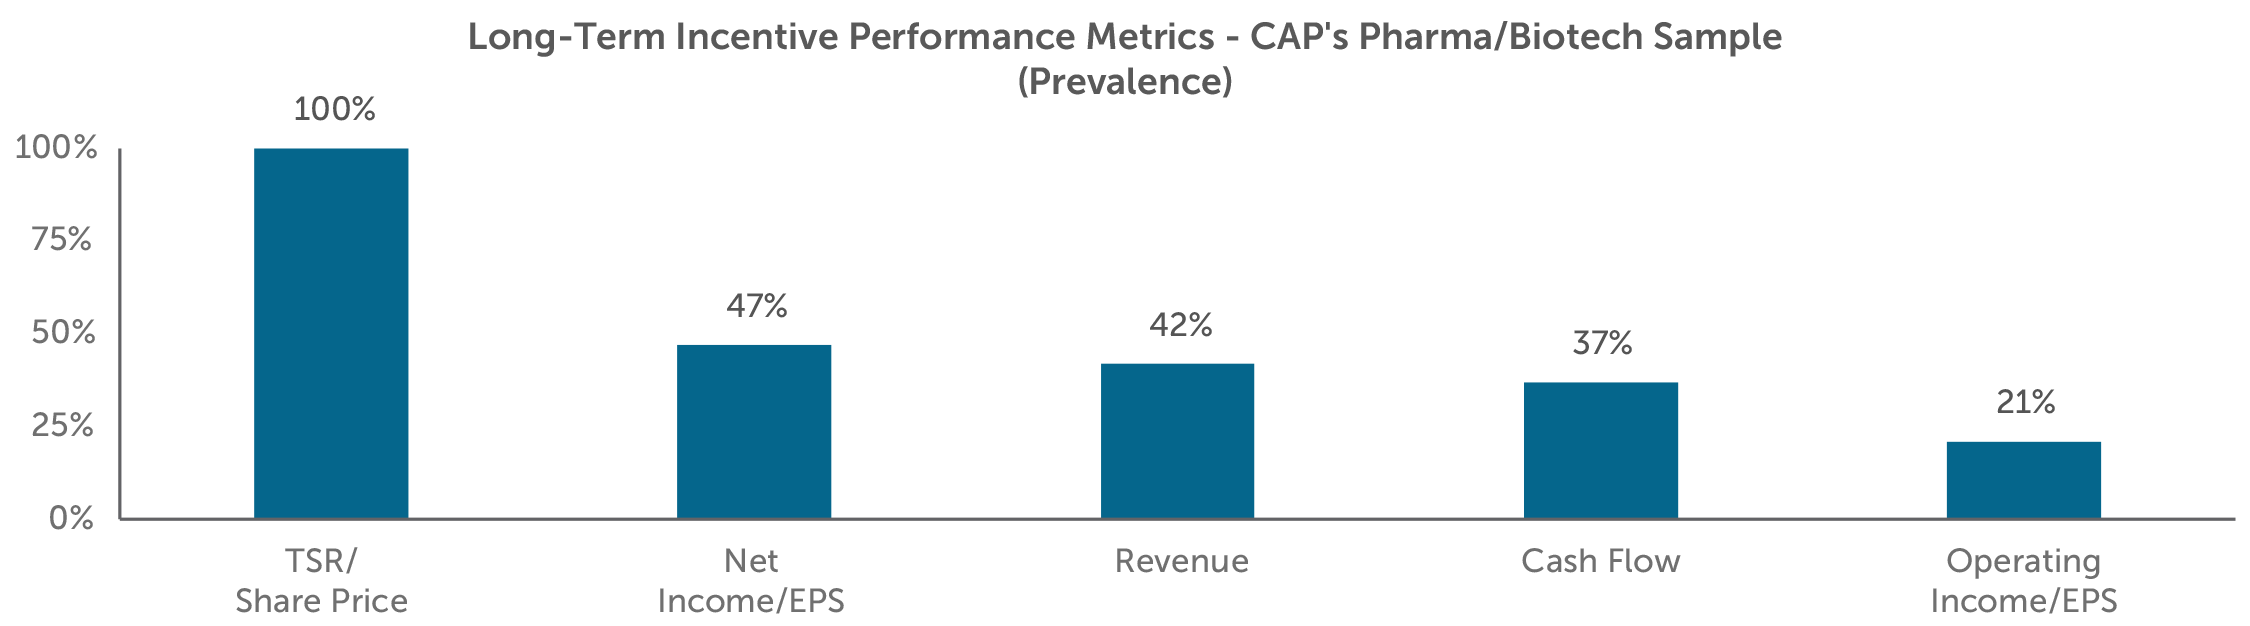
While annual incentives emphasize short-term growth and profitability, long-term incentives generally encourage and reward long-term value creation. 100% of the companies in CAP’s Pharma/Biotech sample use relative TSR or absolute share price as a performance plan performance metric. Most companies in CAP’s Pharma/Biotech sample use TSR as one of several weighted metrics or as a modifier.
Even though shareholder return metrics are ubiquitous among CAP’s Pharma/Biotech sample, they are certainly not the only metrics used. In fact, 89% of the companies in CAP’s Pharma/Biotech sample also use one or more of net income, revenue, cash flow, and operating income in their long-term performance plan.
Looking Ahead
2018 has gotten off to a good start. For the first quarter of 2018, median revenue growth for CAP’s Pharma/Biotech sample was slightly below full-year 2017 growth (4% vs. 6%). However, median first quarter adjusted operating margin was 36%, four percentage points better than 2017’s median of 32%. A decrease in the U.S. corporate tax rate influenced adjusted EPS growth among CAP’s Pharma/Biotech sample, which was 12% at median for the first quarter. Median first quarter TSR for CAP’s Pharma/Biotech sample was -3%, close to both the S&P Global 1200 (-2%) and the S&P 500 (-1%). We expect companies and compensation committees to continue to align executive compensation with overall performance.
We are not surprised by the consistency in incentive plan design and use of similar performance metrics given the continued focus of Pharmaceutical and Biotechnology companies on R&D and strategic priorities to support revenue growth and profitability. Companies in the industry will continue to face challenges, including increased competition and uncertainty surrounding drug pricing and healthcare reform. Companies and compensation committees will continue to evaluate their incentive plan designs to ensure alignment with their organizational strategies and in light of broader market and regulatory developments.
Additional Information – New CEO Pay Ratio Disclosure
Thirteen of the companies in CAP’s Pharma/Biotech sample were required to disclose the ratio of their CEO pay to that of the median employee in 2018. The reported CEO pay ratios among CAP’s Pharma/Biotech sample ranged from 62:1 to 452:1 with a median ratio of 169:1. Given the flexibility that companies have in the methodology and assumptions used to calculate the ratio, comparisons of ratios between companies are less meaningful. To date, institutional investors and proxy advisory firms have not used disclosed CEO pay ratios to inform their voting decisions. We may see some year-over-year comparisons in the second year of disclosure.
For questions or more information, please contact:
Kelly Malafis Partner [email protected] 212-921-9357
Lauren Peek Principal [email protected] 212-921-9374
Kyle Eastman Associate [email protected] 212-921-9362
Michael Bonner Associate [email protected] 646-486-9744
Diane Lee and Joshua Hovden provided research assistance for this report.
Pharmaceutical / Biotechnology Companies – Total Sample
- AbbVie Inc.
- Allergan plc
- Amgen Inc.
- AstraZeneca PLC
- Biogen Inc.
- Bristol-Myers Squibb Company
- Celgene Corporation
- Eli Lilly and Company
- Gilead Sciences, Inc.
- GlaxoSmithKline plc
- Johnson & Johnson
- Merck & Co., Inc.
- Mylan N.V.
- Novartis AG
- Pfizer Inc.
- Roche Holding AG
- Sanofi
- Shire plc
- Teva Pharmaceutical Industries Limited