DOWNLOAD A PDF OF THIS REPORT pdf(0.4MB)
Contact
Roman BeleutaPartner [email protected] 646-532-5932 Louisa Heywood
Senior Associate [email protected] 646-568-1160 Kelly Malafis
Founding Partner [email protected] 212-921-9357
CAP’s report examines compensation outcomes for Chief Financial Officers (CFOs) relative to Chief Executive Officers (CEOs). This analysis summarizes 2021 compensation actions among 130 companies with median revenue of $14 billion. Additional information on criteria used to develop the sample is included in the Appendix.
Study Highlights
Base Salary
More CFOs received increases in 2021 compared to 2020, with the median increase generally in line with 2020
- Approximately 7% more CFOs received base salary increases this past year. Overall, 62% of companies made salary increases for CFOs in 2021 and 42% made increases for CEOs
- Among executives who received salary increases, the median increase was 4.0% for both CEOs and CFOs. This increase was generally in line with the prior year’s increases (4.1% and 4.3% for CEOs and CFOs, respectively)
- Among the total sample, the median increase for CFOs was 2.5%, similar to last year’s 2.7% increase. Since 58% of CEOs did not receive an increase, the median increase for CEOs is 0%.
Bonuses
Strong 2021 financial performance, compared to performance challenges in 2020, supported higher bonuses in 2021
- Among our sample, approximately 75% of CFOs had higher bonus payouts in 2021. Median change in actual bonus payouts increased significantly – up 34% for both CEOs and CFOs
- The bonus payouts were mostly aligned with company performance during 2021. Companies whose operating income fell in 2021 paid bonuses approximately 12% lower than 2020 for CFOs (17% lower for CEOs). Companies who improved operating income paid bonuses approximately 43% higher for CFOs (36% for CEOs).
- Median target bonus opportunities remained unchanged for both CEOs (150% of salary) and CFOs (100% of salary), with the median CEO target bonus level unchanged for the last 8 years
Long-Term Incentive (LTI)
LTI awards were also up in 2021, reflective of stronger company and stock price performance
- LTI awards increased 12% for CEOs and 11% for CFOs, up from CEO and CFO increases last year (5.3% and 8.7%, respectively)
Total Compensation
2021 saw the largest year over year increases at median in the last 10 years; the last time we saw increases in the 15% – 20% range was after the financial crisis in 2008/2009
- Median 2021 increases in actual total direct compensation (i.e., cash plus equity) for CEOs and CFOs were 18% and 17%, respectively, substantially higher compared to 2020 (3% and 4%, respectively) driven by large increases in variable incentives (annual incentive payouts and long-term incentive awards)
- As in prior years, CFO total compensation continues to approximate one-third of CEO total pay
Pay Mix
The use of stock options slightly decreased in 2021 over 2020 as companies continue to emphasize performance-and time-based stock
- The emphasis on variable over fixed pay, and performance-based equity over time-based equity continues
- Use of stock options shifted down slightly (3-4%) compared to last year, and prevalence of performance- and time-based stock is consistent with 2020
- As we predicted last year, the slightly greater emphasis on time-based equity continued from 2020 into 2021
Study Results
Salaries
In 2021, prevalence of salary increases stayed consistent for CEOs (42% received increases in 2021 compared to 44% in 2020) and rose for CFOs (62% received increases in 2021 compared to 55% in 2020). At many companies, salary increases planned for 2020 may have been delayed to 2021 due to the COVID-19 pandemic. As indicated in the charts below, median 2021 salary increases were 2.5% for CFOs (or 4% for those receiving an increase) and 0% for CEOs (or 4% for those receiving an increase).
2021 Salary Increases

Changes in Actual Pay Levels
The actual total cash compensation for 2021 increased among our sample, driven by significant increases in bonus payouts. On a total compensation basis (including long-term incentive awards), the median rate of increase continued to trend much higher for both CEOs and CFOs (18% for CEOs and 17% for CFOs).
|
Median Percentage Change in Pay Components |
||||||
|
|
2018 – 2019 |
2019 – 2020 |
2020 – 2021 |
|||
|
Pay Components |
CEO |
CFO |
CEO |
CFO |
CEO |
CFO |
|
Salary |
2.5% |
3.0% |
0.0% |
2.7% |
0.0% |
2.5% |
|
Actual Bonus |
-2.2% |
-3.2% |
0.0% |
0.0% |
33.5% |
34.1% |
|
Long-Term Incentives |
6.1% |
8.3% |
5.3% |
8.7% |
11.8% |
11.0% |
|
Actual Total Direct Compensation |
4.4% |
3.6% |
3.3% |
4.1% |
17.6% |
16.7% |
As indicated above, though salary increases are consistent over year, there was a significant increase in bonus payouts and long-term incentive award values in 2021 compared to prior years.
Bonus payouts were generally aligned with performance outcomes for most companies. For companies with lower operating income in 2021, bonus payouts were down 12% at median for CFOs and 17% for CEOs, compared to +43% for CFOs and +36% for CEOs at companies with operating income growth.
Median Total Compensation Increase by Industry1

Median total compensation increases varied by industry. In 2021, industrials, consumer discretionary, IT and financials sectors had the biggest increases. Consistent with the overall study, these increases are higher than in prior years given stronger performance and higher payouts in 2021.
Target Pay Mix
The pay program structure for CEOs and CFOs over the last 10 years has remained largely unchanged. CEOs continue to receive less in the form of salary and more in variable pay opportunities, especially LTI, than CFOs.

Target Bonuses
Median target bonus opportunities as a percentage of salary remained consistent at the median and 25th percentiles, and fell at the 75th percentile. We expect target bonus will continue to remain at similar levels.

Long-Term Incentive (LTI) Vehicle Prevalence and Mix
The majority of companies (approximately 60%) deliver LTI using two different vehicles. Approximately 30% of companies in the sample use stock options, time-based stock awards, and performance plan awards.
The portion of LTI awards granted in performance plans decreased slightly in 2020 at the expense of higher time-based awards but bounced back in 2021. Stock option usage decreased in 2021. The minor increase in time-based awards was expected in 2020 due to the COVID-19 pandemic, and performance shares rebounded in 2021 when goal setting became more manageable.

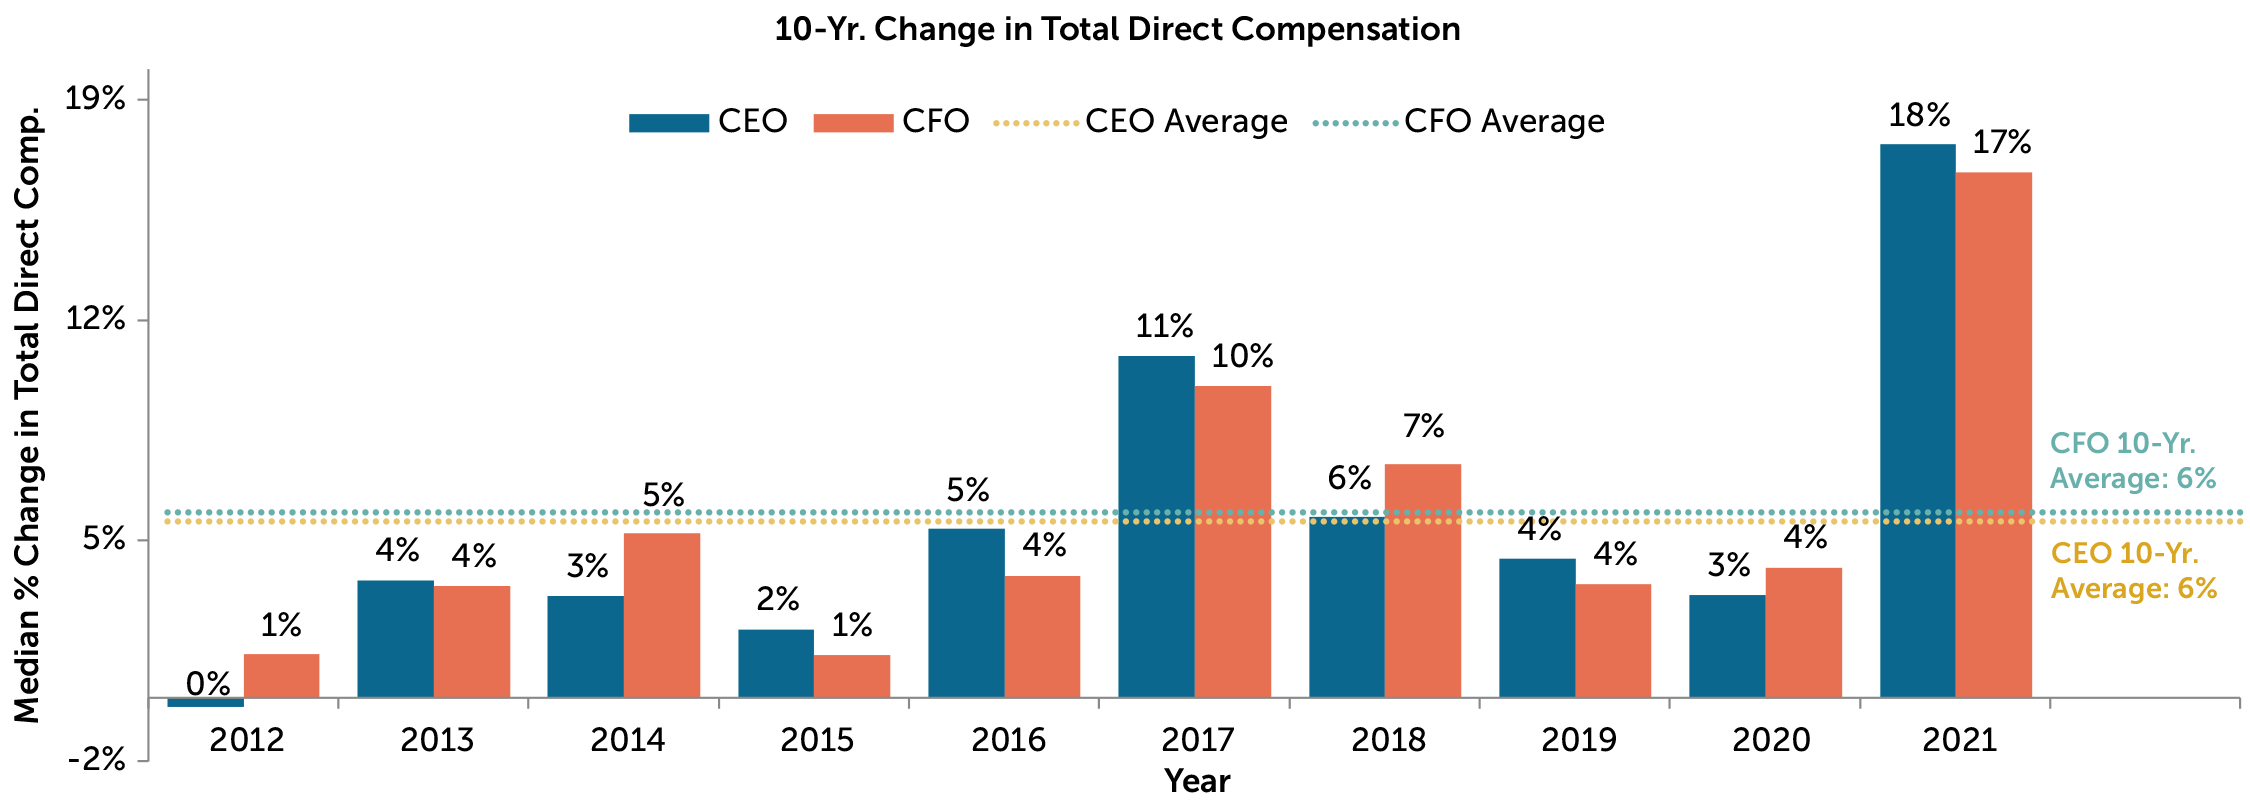
10-Year Changes in Total Direct Compensation
For its 10th year producing its annual CFO report, CAP reviewed historical changes in compensation from 2012 through 2021. CFO pay has generally tracked with CEO pay, though CEO pay has had higher highs and lower lows, as is expected for the top role. There is only one year – 2012 – that CEO pay fell compared to the prior year, but increases at median were less than 5% for most of the last 10 years for both CEOs and CFOs. 2021 saw by far the largest increases in total compensation, reflective of strong 2021 performance and compounded by below-average increases in 2020.
Conclusion
Financial performance improved dramatically in 2021 compared to the prior year. Revenue grew 18% at median and operating income increased 33%. Such exceptional financial performance explains the drastic incentive increases and indicates an overall alignment of pay outcomes and company financial performance.
Since many companies made equity grants early in 2021, prior to the impact of economic contraction into 2022, we do not expect to see increases of this magnitude next year.
APPENDIX
Sample Screening Methodology
Based on the screening criteria below, we arrived at a sample of 130 public companies with median 2021 revenue of $14B.
|
Revenue |
At least $5 billion in revenue for fiscal year 2021 |
|
Fiscal year-end |
Fiscal year-end between 9/1/2021 and 1/1/2022 |
|
Proxy Statement Filing Date |
Proxy statement filed before 3/31/2022 |
|
Tenure |
No change in CEO and CFO incumbents in the past three years |
|
Industry |
All industries have been considered for this analysis |
1 Excludes industries which had a sample less than five companies. Total compensation equals the sum of base salary, actual bonuses, and LTI awards granted in 2021.