The increases that CAP observed in 2013 are much higher than seen last year. In 2012, our study showed almost no change in CEO compensation (-0.3% at median) and a very modest increase in CFO total direct compensation (1.4% at median).
Our findings indicate that the rate of increase in total direct compensation levels for both CEOs and CFOs accelerated in 2012-2013 compared to flat pay increases in 2011-2012. This increase suggests that the economic recovery is having an impact. The higher increase in 2013 among CEOs was driven by larger increases in actual bonuses paid for 2013 and slight increases in long-term incentives (LTI). The slower rate of growth in CFO compensation may signal a leveling off of CFO pay increases – which has been increasing at a faster rate than CEO pay since 2010. On an absolute basis, CFO total direct compensation continues to total approximately one-third of CEO total direct compensation.
Methodology
Our findings are based on a sample of 92 public companies. Similar to prior years, the study analyzes executive pay data disclosed by companies with revenues ranging from $1 to $130 billion, and median 2013 revenues of $8 billion. Only companies with the same CEO and CFO incumbents in the past three years are included allowing us to measure year-over-year changes for individual incumbents. In the past, we excluded financial services firms from the study, since this industry’s compensation practices were evolving in the years after the financial crisis. This year we expanded our sample to include financial services companies in our analysis, because we believe that compensation in the financial services industry has stabilized over the last couple of years.
Study Results
Salaries
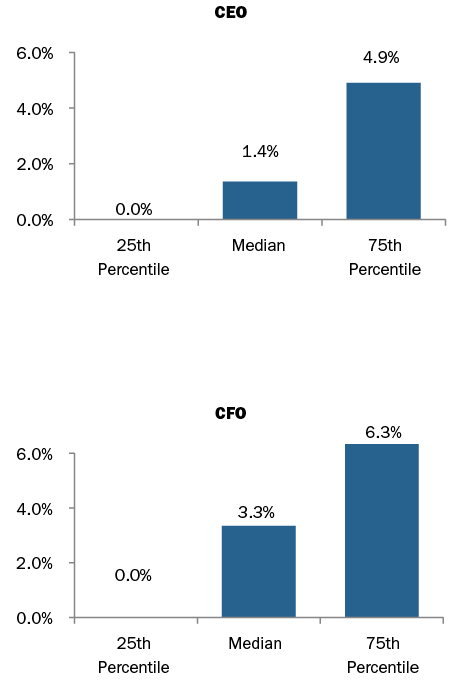
In 2013, approximately 73% of CFOs received salary increases compared to 85% in 2012. The median increase was 3.3% and the 75th percentile increase was 6.3%. In comparison, only 54% of CEOs received salary increases and the increases were smaller — 1.4% at median and 4.9% at the 75th percentile. The number of CEOs receiving a salary increase was similar to 2012. Less frequent and lower salary increases among CEOs may be explained by companies’ hesitancy to increase salaries beyond $1M.
|
% of Executives Receiving Salary Increases |
||||||
|
2010 – 2011 |
2011 – 2012 |
2012 – 2013 |
||||
|
No Increase |
Receiving Increase |
No Increase |
Receiving Increase |
No Increase |
Receiving Increase |
|
|
CEO |
34% |
66% |
47% |
53% |
46% |
54% |
|
CFO |
12% |
88% |
15% |
85% |
27% |
73% |
2013 Salary Increases
Actual Pay Levels
Our findings indicate that the rate of increase in total direct compensation levels for both CEOs and CFOs accelerated in 2012-2013 compared to flat pay increases in 2011-2012, supported by stronger performance in 2013. During 2012-2013, actual total direct compensation (salary plus actual annual incentive plus the grant date value of long-term incentives) for CEOs and CFOs increased by 5.2% and 3.2%, respectively. This year is the first year since 2010 that we see higher median increases in actual total direct compensation for the CEO versus the CFO. In addition to salary increases of 1-3%, annual bonuses were 4-5% higher at median and long-term incentives increased about 3% at median for both CEOs and CFOs.
Absolute CFO total direct compensation levels, on average, continue to be approximately 30% of CEO total direct compensation levels.
|
Median Percentage Change in Pay Components |
||||||
|
2010 – 2011 |
2011 – 2012 |
2012 – 2013 |
||||
|
Pay Components |
CEO |
CFO |
CEO |
CFO |
CEO |
CFO |
|
Salary |
1.8% |
3.5% |
0.5% |
3.0% |
1.4% |
3.3% |
|
Actual Bonus |
0.0% |
3.5% |
-2.8% |
-1.2% |
4.9% |
3.7% |
|
Long-Term Incentives |
10.0% |
10.3% |
0.0% |
2.0% |
3.2% |
3.3% |
|
Actual Total Direct Comp. |
3.6% |
7.5% |
-0.3% |
1.4% |
5.2% |
3.2% |
|
Financial Performance (Median Levels) |
|||
|
Year |
Total Shareholder Return (as of 12/31) |
1-Year Revenue Growth |
1-Year Net Income Growth |
|
2011 |
5% |
9% |
13% |
|
2012 |
14% |
3% |
2% |
|
2013 |
31% |
5% |
12% |
Since this was the first year financial services companies were included, we tested the results without financial services companies and found that the median increase in total direct compensation between the two data sets for CEOs and CFOs was within a 1% difference. However, total cash compensation yielded greater differences. For CFOs of non-financial services companies the median increase in total cash compensation was 1.9% vs. 4.6% median increase of the total sample. For CEOs the median increases were 3.1% vs. 4.2%, respectively. This is due to higher bonus payouts at financial services institutions in 2013.
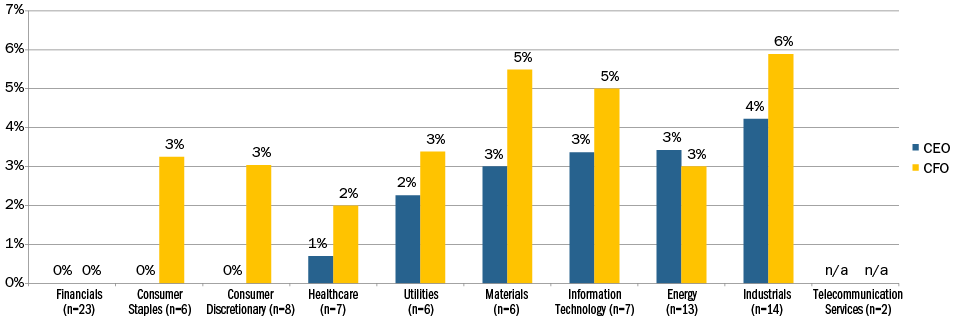
2013 Median Salary Increase by Industry
2013 Median Actual Total Direct Compensation Increase by Industry
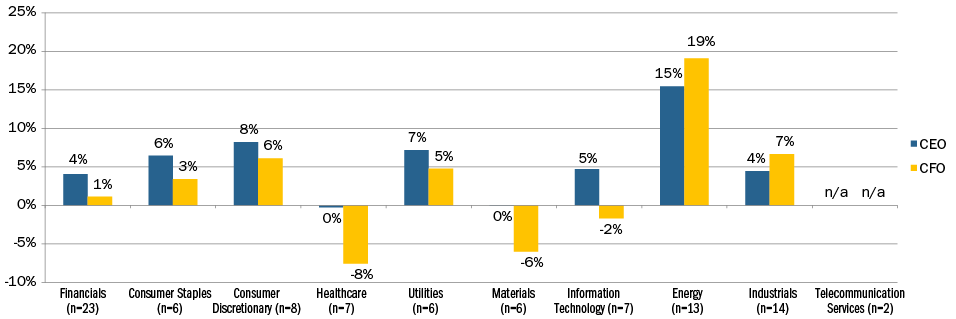
Our study breaks out 2013 CEO and CFO pay by industry classification (Financials, Consumer Staples, Consumer Discretionary, Healthcare, Utilities, Materials, Information Technology, Energy, Industrials, and Telecommunication Services). When looking at median increases in salary for both CEOs and CFOs, they tend to be in the range of 0-3%. Median salary increases over 3% occurred in the Materials and Information Technology industries for CFOs and in Industrials for both CEO and CFO. When looking at actual total direct compensation there is greater volatility in increases, which is primarily driven by industry and company performance.
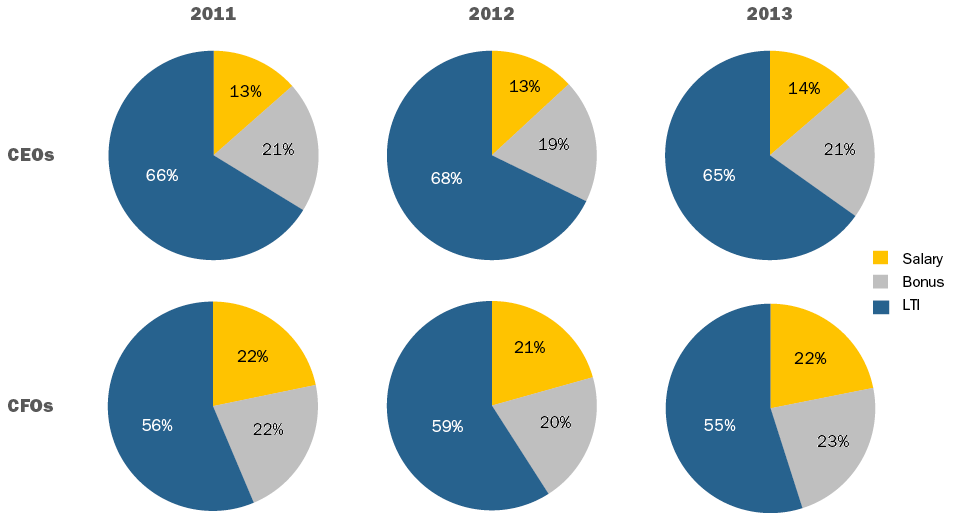
Target Pay Mix
In terms of target compensation levels, the overall pay mix remained largely unchanged from 2011 to 2013. We continue to observe a greater emphasis on at-risk pay for CEOs than for CFOs.
Long-Term Incentive (LTI) Vehicle Prevalence and Mix
LTI vehicle prevalence and mix trends have been fairly consistent over the past few years. The use of at least two long-term incentive vehicles continues to be the majority practice for CEOs and CFOs. The role of stock options has been decreasing slowly in the overall mix with companies delivering about 30% of LTI using this vehicle. On average, performance-based LTI continues to comprise approximately 50% of LTI for CEOs and CFOs. Data continues to show that about 80% of CFOs and CEOs receive some form of performance-based awards as part of their LTI program.
|
# of LTI Vehicles Used |
% in Total |
|
|
CEO |
CFO |
|
|
1 Vehicle |
25% |
27% |
|
2 Vehicles |
49% |
43% |
|
3 Vehicles |
26% |
30% |
|
Average |
2 |
2 |
|
LTI Mix |
2011 |
2012 |
2013 |
|||
|
CEO |
CFO |
CEO |
CFO |
CEO |
CFO |
|
|
Stock Options |
32% |
32% |
30% |
32% |
29% |
29% |
|
Time Vested Restricted Stock |
17% |
22% |
16% |
20% |
19% |
22% |
|
Perf. Based LTI |
51% |
46% |
53% |
48% |
53% |
49% |
Conclusion
Given the improved economy and strong stock market it is not surprising that CEO and CFO pay levels increased in 2013. The fact that CEO pay increased at a faster rate than CFOs for the first time in four years, implies that Compensation Committees are recognizing CEO performance as overall company performance improves. In the future, we expect continued pay-for-performance alignment with CEOs experiencing a greater impact on compensation for good and bad performance.
Among the 44 company sample, median revenue was $11B, median market capitalization was $23B and median 12 month Total Shareholder Return (TSR) was 27% at the end of February 2014.
What We Found
The early findings and trends from these filers generally showed a continuation of trends from the 2013 proxy season. Early in 2014 companies:
- Received high levels of shareholder Say on Pay support
- Awarded CEO bonuses that were slightly higher as a percent of target compared to prior year earned bonuses, and
- Shifted more of the long-term incentive “LTI” program to performance based vehicles and decreased the emphasis on stock options
Say On Pay (SOP) Vote Results
In 2014, all Early Filers that released SOP results to-date (n=38) received majority shareholder support and 87% of companies received greater than 90% support. Among these companies there has been a steady uptick in the level of support at the 25th percentile over the last four years.

CAP Comment: SOP levels in early 2014 to-date continue to be strong. We expect similar SOP support levels for calendar year-end companies as we approach the 2014 annual meeting dates.
CHANGES IN SHORT AND LONG-TERM COMPENSATION
Base Salary
Among Early Filers, 46% of companies disclosed an increase to the CEO’s base salary in 2013 and the overall average base salary increase was 2.7%.2 CEOs in the Industrials industry received the largest average base salary increase (8.7%) followed by Consumer Staples (3.9%).
CAP Comment: The average executive base salary increase among the Early Filers is consistent with projected merit increases in the broader market where we are generally seeing 3.0% increases for 2014.
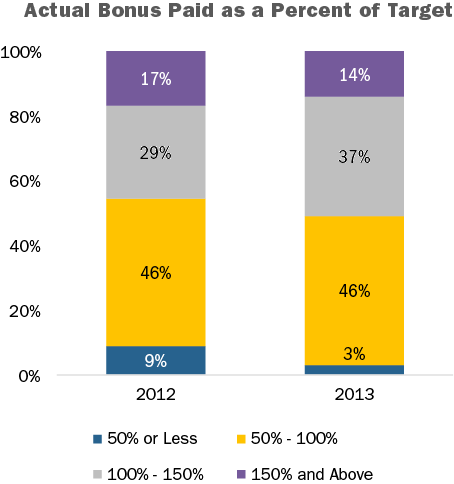
Short-term Incentive Payouts
Bonus payouts as a percent of target for the Early Filers increased slightly at the median. The median CEO bonus payout for 2013 was 100% of target compared to 97% in 2012. In general, there was a slight shift upwards in the bonus payouts when compared to the prior year. This is in-line with overall expectations as companies’ earnings and income also had modest growth year-over-year.
|
|
Annual Incentive Payout as a % of Target |
|
|
Summary Statistics |
2012 |
2013 |
|
75th Percentile |
118% |
119% |
|
50th Percentile |
97% |
100% |
|
25th Percentile |
74% |
84% |
51% of Early Filers paid above target in 2013, compared to 46% in 2012. Of the companies that paid above target, median year-over-year increases in revenue, earnings and income growth were in the 10-20% range, compared to 5% for all Early Filers companies.
CAP Comment: Year-over-year financial performance results are aligned with CEO bonus payouts for the Early Filers. Companies are putting more time and effort into the goal setting process to ensure an appropriate pay and performance alignment; investors and proxy advisory firms increasingly focus on the performance goals and rigor of the incentive plan targets.
Long-term Incentive Mix
Over the last two years, the portion of the LTI mix delivered in a performance-based vehicle has increased in the general market. Early Filers showed a continuing, consistent shift, placing more emphasis on performance-based LTI and less emphasis on stock options; the weighting on time based restricted stock remained flat.
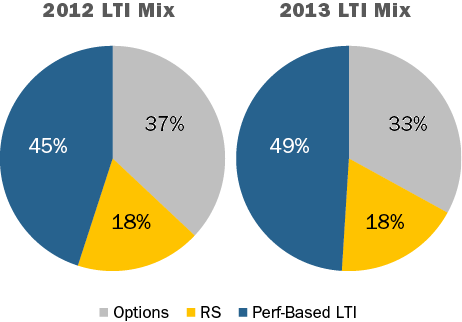
Approximately 85% of the Early Filers use two or three vehicles to deliver their long-term incentives.
CAP Comment: A general trend over the last couple of years has been a de-emphasis on stock options as part of the LTI program and an increase on the portion of performance based LTI. ISS is supporting this shift as they do not consider options to be performance-based.
Disclosed changes to compensation programs and polices
Companies continue to modify their compensation programs as they reassess program features in light of business/strategic changes and/or evolving shareholder and proxy advisory groups’ hot buttons. 36 of the 44 companies (82%) we researched disclosed making a change to their compensation programs or policies. The most prevalent change among the Early Filers was a modification to the company’s benchmarking peer group. Peer group changes are typically a result of companies trying to better align the peer group median size with that of their own company.
|
|
2013 |
% of Cos. |
|
Type of Change Reported in CD&A |
No. of Cos. |
n=44 |
|
Modified peer group |
22 |
50% |
|
Decreased weighting of options in LTI mix |
10 |
23% |
|
Increased weighting on perf.-based LTI |
9 |
20% |
|
Adopted / expanded clawback policy |
6 |
14% |
|
Adopted hedging and/or pledging |
5 |
11% |
Note: Percentages add up to greater than 100% due to multiple responses
CAP Comment: Modifications to a company’s peer group is common as Compensation Committees and management review appropriate peers for benchmarking on an annual or biennial basis. Given that ISS and Glass Lewis consider a company’s peer group when conducting their analyses, it is another reason that assessing the appropriateness of peer companies is a valuable exercise.
Similar to last year, companies continue to modify their clawback policy as a sign of good corporate governance. Companies are not universally waiting for final Dodd-Frank regulations before making adjustments to their policy. The uptick in the disclosure of hedging/pledging policies also continued, and overall, 86% of Early Filers disclose having both. Lastly, 14% of Early Filers voluntarily disclosed a supplemental table, graph or discussion of realized/realizable pay. In-line with CAP’s recent research on this topic and disclosure in 2013 proxies, these companies tend to compare realized/realizable pay with target or Summary Compensation Table pay values, as well as alignment with TSR.
Conclusions
While the Early Filers research is a sneak preview into the upcoming proxy season, we expect to see directionally consistent trends with these changes and practices indicated from our research. Companies are continuing to demonstrate good corporate governance and policies / programs that enhance company performance and pay linkages. Since there have not been significant changes in proxy advisory firm policies or expanded Dodd- Frank legislation, we do not expect to see significant program overhaul in the current proxy season. Companies with low SOP support will likely disclose more significant program modification.
1 Calendar year-end companies were not included in the analysis.
2 Based on companies whose current CEO has held the position for two years.
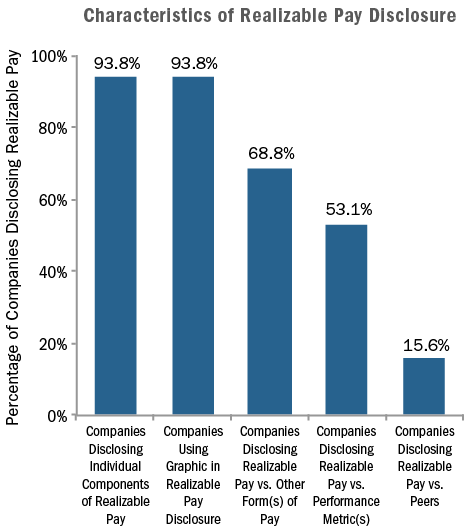
To address the limitations of SCT and GPBA data, companies have begun to disclose realized and realizable pay (see table below for definitions of realized and realizable pay). In order to evaluate this growing trend, Compensation Advisory Partners (“CAP”) reviewed the 2013 proxy statements of public Fortune 500 companies and tallied the disclosure of realized and realizable pay. For companies that presented a discussion on this topic, we recorded the use of graphics (e.g., tables and charts), we considered what methods companies used to compare different definitions of pay (e.g., vs. SCT/target pay, relative to a peer group, etc.), and we also tracked companies that supplemented their disclosure with the use of performance metrics.
|
Pay Component |
Realized |
Realizable |
|
Time Period |
1 – 5 years |
|
|
Base Salary |
Base salary disclosed in Summary Compensation Table (“SCT”) |
|
|
Bonus |
Actual bonuses/non-equity incentive (annual variable cash incentive) disclosed in the SCT |
|
|
Time-based Equity Awards |
||
|
Stock Options |
Value gained upon exercise for all stock options exercised within measurement period |
Valued at end of performance/measurement period Two alternative approaches: Intrinsic (in-the-money) value of awards granted during measurement period Updated Black-Scholes valuation of awards granted within measurement period |
|
Restricted Stock/Units |
Value at vest for all shares/units that vest within measurement period |
Value at end of measurement period, of all shares/units granted during measured period |
|
Performance-Contingent Equity Awards |
||
|
Stock/Stock Units |
Value upon payout, for all awards that paid during measured period |
Two alternative approaches: Value upon payout, for all awards that paid during measured period Awards granted, vested, and paid out during measured period; if unvested, target value of shares awarded during measured period |
|
Long-term Cash |
Long-term cash incentive payouts during measurement period disclosed in SCT |
Two alternative approaches: Long-term cash incentive payouts during measurement period disclosed in SCT Awards granted, vested, and paid out during measured period; if unvested, target value of long-term cash awarded during measurement period |
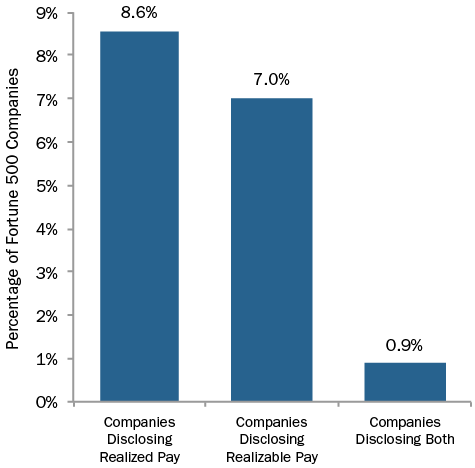
Results
Among our sample of Fortune 500 companies, 15% supplemented the SCT and GPBA with realized and/or realizable pay disclosure. Approximately 9% of our sample disclosed realized pay, 7% disclosed realizable pay, and 1% disclosed both.
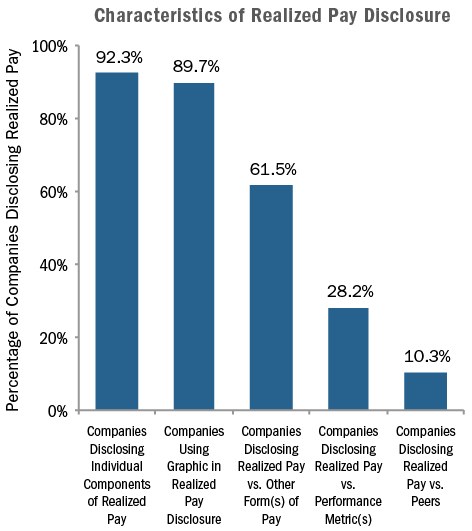
Realized Pay Disclosure
For companies disclosing realized pay, the most common methodology used was base salary actually paid, bonus actually paid, the value of restricted stock that vested during the period, and the value realized upon exercise of options during the period. In a lesser number of cases, companies also included all other compensation and the change in pension value. The majority of companies presented realized pay on an absolute basis (i.e., on an individual company basis, not against peers or some other index). CAP found that of the companies disclosing/discussing the concept of realized pay, most (90%) used some type of chart or table to discuss the concept, 62% compared their realized pay to some other definition of compensation (companies were equally divided between disclosing a comparison of realized pay to SCT pay or to the executive’s target compensation), and approximately 28% of companies compare a performance metric (most commonly TSR) to a graphic depiction of realized pay.
Companies disclosing realized pay had a median cumulative TSR of 7% and 5% on a 1- and 3-year basis, respectively—placing the majority of disclosing companies well below the median of the Fortune 500.
|
|
Cumulative TSR at 12/31/2012 |
|
|
Fortune 500 |
1-year |
3-year |
|
Median |
14.1% |
35.5% |
|
25th Percentile |
1.6% |
2.4% |
|
15th Percentile |
-3.9% |
-6.4% |
|
10th Percentile |
-10.8% |
-18.7% |
|
Companies Disclosing Realized Pay |
|
|
|
75th Percentile |
24.7% |
38.6% |
|
Median |
6.5% |
5.2% |
|
25th Percentile |
-7.8% |
-10.7% |
Realizable Pay Disclosure
As stated above, among companies that disclosed a supplemental definition of pay, approximately half used some form of realizable pay. Typically, realizable pay is calculated as base salary, actual bonus paid, and long-term incentives granted and valued at the end of the period. For restricted stock, the value is calculated by multiplying the number of shares granted by the stock price at the end of the period. For stock options, the value is most often calculated as the intrinsic (in-the-money) value based on the stock price at the end of the period (Black-Scholes option values are also used, albeit less frequently). For performance shares, the calculation is generally based on the payout for shares granted within the period or the target number of shares granted for awards that have not vested, valued at the end of the period. Most of the companies disclosing used an accompanying table or graph to demonstrate the concept and the most commonly used graphics were: tables or charts showing the side-by-side difference between grant date/target pay vs. realizable pay, realizable pay vs. total shareholder return (TSR), or some combination of the two. Approximately 90% of companies disclosing realizable pay had SCT/GPBA pay data that was greater than realizable pay.
Like realized pay companies, a majority of Fortune 500 companies disclosing realizable pay had 1- and 3-year TSR at 12/31/2012 that trailed the median of the full Fortune 500 group. More specifically, the median TSR of realizable pay companies was slightly above the 25th percentile of the Fortune 500 on a 1-year basis, and between the 15th percentile and 25th percentile on a 3-year basis.
|
|
Cumulative TSR at 12/31/2012 |
|
|
Fortune 500 |
1-year |
3-year |
|
Median |
14.1% |
35.5% |
|
25th Percentile |
1.6% |
2.4% |
|
15th Percentile |
-3.9% |
-6.4% |
|
10th Percentile |
-10.8% |
-18.7% |
|
Companies Disclosing Realizable Pay |
|
|
|
75th Percentile |
19.2% |
37.1% |
|
Median |
1.7% |
-1.8% |
|
25th Percentile |
-15.0% |
-30.0% |
Conclusion
The 2013 proxy season was the first year where we saw a meaningful number of companies disclosing realized and/or realizable pay and with the 2014 proxy season fast approaching, we fully expect to see an increase in supplementary pay disclosure, particularly for those companies with below-average TSR.
Research assistance provided by: Kyle Eastman, Michael Biagi, Ryan Colucci.
Note: For detailed findings or specific company examples, please call or email Eric Hosken at Compensation Advisory Partners. We expect to publish a more comprehensive discussion of the topic in the Q2 2014 World at Work Journal.
Email: [email protected]
Phone: (212) 921-9363
CHANGES IN ANNUAL INCENTIVE PLAN DESIGN
Overall, 37% of companies made changes to their annual incentive plan design in 2012 or 2013. The most common changes were to increase the target incentive opportunity for the CEO and/or CFO (43% of companies making a change to increase target award opportunities) or to change to the annual incentive performance metrics (35%). Companies continue to review and enhance the pay-for-performance relationship through changes to the annual incentive program.
|
Type of Change Reported in CD&A |
2012 No. of Cos. |
% of Cos. Reporting Changes |
|
|
2012 (n = 37) |
2011 (n = 43) |
||
|
Increase target award opportunities (CEO and/or CFO) |
16 |
43% |
28% |
|
Change in performance metrics used to fund awards |
13 |
35% |
42% |
|
Change in performance metric weighting/mix |
4 |
11% |
21% |
|
Adopt mandatory deferral mechanism |
4 |
11% |
n/a |
|
Change in maximum award payout |
3 |
8% |
12% |
|
Other Changes |
8 |
22% |
19% |
Note: Due to multiple responses, does not add up to 100%.
Change in Target Bonus Opportunity
Last year median target bonus opportunities for the CEO and CFO positions increased by 6 and 1 percentage points to 159% and 101% of salary, respectively. The target bonus opportunity for CEOs in the Technology industry increased by 50 percentage points in 2012 due to an increase in the target opportunity at Apple (from 50% to 100% of salary) and Verizon (from 187.5% to 250%). Conversely, in the Consumer Goods industry, target bonus opportunities decreased year over year due to new incumbents in these roles.
|
Industry |
Median Target Bonus as a % of Salary |
|||||
|
CEO |
CFO |
|||||
|
2012 |
2011 |
Change in %age Pts. |
2012 |
2011 |
Change in %age Pts. |
|
|
Automotive |
138% |
130% |
+8% |
88% |
88% |
0% |
|
Consumer Goods |
160% |
170% |
-10% |
90% |
100% |
-10% |
|
Financial Services |
n/m |
n/m |
n/m |
n/m |
n/m |
n/m |
|
Health Care |
145% |
145% |
0% |
101% |
100% |
+1% |
|
Insurance |
200% |
200% |
0% |
130% |
120% |
+10% |
|
Manufacturing |
142% |
156% |
-14% |
93% |
95% |
-2% |
|
Pharmaceutical |
150% |
150% |
0% |
97% |
91% |
+6% |
|
Retail |
190% |
168% |
+12% |
90% |
85% |
+5% |
|
Technology |
250% |
200% |
+50% |
135% |
121% |
+14% |
|
Total Sample |
159% |
153% |
+6% |
101% |
100% |
+1% |
Note: Financial Services industry is excluded since most companies in our study do not disclose target bonus opportunities for the Named Executive Officers.
Change in Performance Metrics
Of the companies that changed or plan to change the performance metric:
- Nine (9) companies added metrics to the current plan
- Two (2) companies reduced the number of metrics, and
- Two (2) companies kept the same number of metrics but replaced a metric in the incentive plan.
Several companies indicated that their rationale for changing annual incentive metrics was, in large part, to better align executive pay with the business strategy and shareholder interests:
- Caterpillar: Incorporated Operating Profit After Capital Charge (OPACC) as a measure, to reflect how the Company is utilizing its assets in order to generate shareholder value
- CIGNA: Added a customer loyalty metric in 2013 to emphasize its business strategy and focus on the customers it serves
- Hewlett Packard: Introduced year over year improvement in Return on Invested Capital as an annual incentive metric to focus executives on the business turnaround
ANNUAL INCENTIVE PLAN DESIGN / PRACTICES
Award Leverage
Most companies reviewed did not disclose a threshold level of performance required to receive a bonus payment. Instead, these companies disclosed a minimum bonus of $0. For the 37 companies that did disclose a threshold bonus, 50% of target is the most prevalent payout percentage. However 20 companies, disclose a minimum bonus payout of less than 50% of target with a majority of these companies paying out for results based on one of multiple plan metrics. A majority of companies (58%) have a maximum bonus opportunity of 200% of target bonus. Thirteen (13) companies have a maximum bonus of 250% of target or higher. Four (4) of these companies are in the Consumer Goods industry and three (3) are in the Technology industry.
|
Threshold as a % of Target (n=37) |
||
|
Range |
# of Cos. |
% of Cos. |
|
< 25% |
10 |
27% |
|
25% < 50% |
10 |
27% |
|
50% |
12 |
32% |
|
50% < 75% |
1 |
3% |
|
75 <100% |
4 |
11% |
|
Maximum as a % of Target (n = 78) |
||
|
Range |
# of Cos. |
% of Cos. |
|
100% < 150% |
2 |
3% |
|
150% < 200% |
16 |
21% |
|
200% |
45 |
58% |
|
200% < 250% |
2 |
3% |
|
> 250% |
13 |
17% |
Of the six (6) companies that made changes to their maximum bonus potential in 2012/2013, three (3) companies increased the maximum bonus potential and three (3) companies reduced the maximum. Two (2) of these companies (Allstate and Colgate-Palmolive) changed the maximum payout for the CEO only.
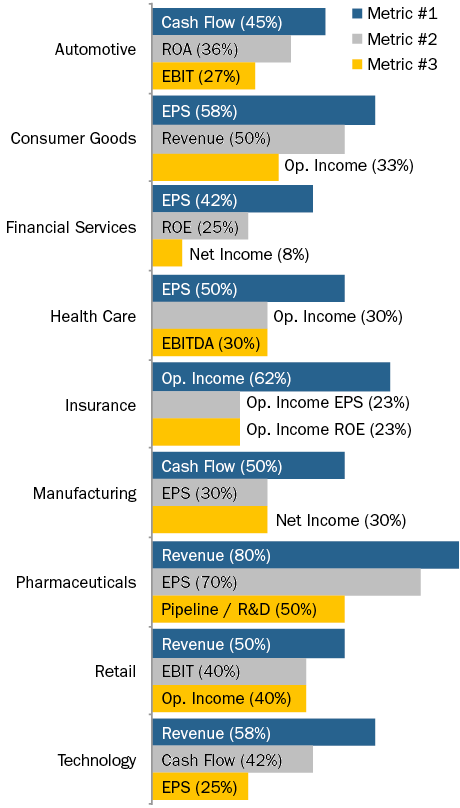
Annual Incentive Plan Metrics
Similar to 2011, Revenue, EPS, Cash Flow and Operating Income continue to be the most prevalent metrics used across all companies, although we see some variation in metrics by industry. In 2013, 30% of companies disclose using two (2) metrics in their annual incentive programs, 29% use three (3) metrics, and 12% of companies use four (4) or more metrics. Approximately 85% of these companies use a profit-based metric in combination with Revenue and/or Cash Flow.
Refer to the chart below for the three (3) most prevalent metrics by industry:
|
Industry |
Actual Bonus as a % of Target Bonus – CEO |
|||||
|
2012 |
2011 |
|||||
|
25th%ile |
Median |
75th%ile |
25th%ile |
Median |
75th%ile |
|
|
Automotive |
69% |
102% |
131% |
130% |
153% |
186% |
|
Consumer Goods |
94% |
103% |
137% |
78% |
132% |
149% |
|
Financial Services |
44% |
80% |
120% |
111% |
114% |
130% |
|
Health Care |
103% |
127% |
157% |
116% |
127% |
159% |
|
Insurance |
112% |
130% |
144% |
85% |
106% |
130% |
|
Manufacturing |
100% |
107% |
146% |
119% |
136% |
162% |
|
Pharmaceutical |
125% |
142% |
156% |
130% |
144% |
161% |
|
Retail |
79% |
117% |
136% |
112% |
129% |
147% |
|
Technology |
90% |
99% |
124% |
75% |
100% |
149% |
|
Total Sample |
93% |
112% |
144% |
105% |
133% |
156% |
Note: Most companies in the Financial Services industry does not disclose target bonus. Figures for the Financial Services industry reflects actual bonus as a percentage of 3-year average actual bonus.
2012 Actual Bonus Payout
Similar to 2011, approximately 95% of companies awarded bonuses to their Named Executive Officers for 2012 performance. Overall, the median CEO bonus was 112% of target compared to 133% in 2011, indicating that 2012 performance generally exceeded par, but was not as strong as 2011 performance. Median 2012 bonus payouts in the Health Care, Insurance, Pharmaceutical and Retail industries exceeded target by 15 – 40 percentage points while payouts in the Automotive, Consumer Goods, Manufacturing and Technology industries were closer to target.
15% of companies in our study require executives to defer all or a portion of their annual incentive payout. Nearly 50% of companies that require a portion of the annual incentive award to be deferred are in the Financial Services industry. Among companies with mandatory deferrals outside of the Financial Services industry, two (2) companies pay a portion of the annual incentive in restricted stock units if the total payout exceeds a specific level:
- HCA Holdings: Any bonus payout above target is delivered 50% in cash and 50% in restricted stock units
- 3M: Annual incentive payouts in excess of 200% of target are paid in the form of restricted stock units
CONCLUSIONS
Companies are continuing to refine their annual incentive program to ensure executive pay is aligned with the Company’s business strategy and key success indicators. These recent trends also indicate that companies are modestly increasing CEO pay through the bonus opportunity and award leverage. Actual payouts for 2012, however, indicate stronger performance goals and moderately above target payouts, yet lower than the previous year. Revenue, EPS, Cash Flow and Operating Income continue to be the most prevalent annual incentive plan metrics with a majority of companies using two (30%) or three (29%) metrics to reward executives for company performance. We expect companies to continue to refine metrics and performance goals / leverage linkages in the annual incentive plan as shareholders and proxy advisory firms scrutinize the executive compensation program.
Among the 100 company sample, median revenue was $33B, median market capitalization was $37B and median Total Shareholder Return (TSR) was 19% in 2012.
What We Found
Although shareholder support for Say on Pay has been increasing year-over-year with a significant majority of companies receiving over 90% support, companies continue to regularly review and modify their executive compensation programs in response to shareholders, proxy advisory firms and good governance practices. Consistent with our findings last year, companies continue to modify clawback policies and scale back perquisites. New to our research in 2013, hedging /pledging polices have also gained traction as a result of Dodd-Frank and ISS’ policies.
Dodd Frank
The Dodd Frank Wall Street Reform and Consumer Protection Act (Dodd Frank) was signed into law in 2010 and will require the following governance practices:
- Companies must implement a clawback policy for executive officers that allows for recoupment of any incentive compensation, with a three-year look back, due to any restatements
- Companies must disclose whether they have a policy that prohibits hedging of company shares (e.g., through the purchase of derivatives that protect executives from stock price swings)
- Companies must disclose whether they have a policy to address pledging of company shares (e.g., as collateral for a loan)
The SEC has yet to release guidance on these areas and the timing of future guidance is uncertain. As such, many companies have taken steps to implement policies on their own.
Clawbacks
Dodd Frank requires a broader definition of clawbacks compared to Section 304 of SOX, which applies to CEOs and CFOs. When clawback policies were first adopted by Dodd Frank many companies took a “wait and see” approach; however, with the continued delay in final regulations, companies have been more proactive in modifying their policies.
Nearly all of our research companies – 94 of 100 (94%) – have some form of clawback policy, compared to 86% and 80% in 2011 and 2010, respectively. In 2012, 10 companies adopted a new policy and 11 modified existing provisions. The two industries that saw the most changes to their clawback polices included automotive (45% of companies) and financial services (45% of companies). Typically financial services firms expanded their clawback policies to cover all incentive awards and situations beyond just financial restatements.
As was the case in prior years, a financial restatement (83%) and misconduct (75%) are the most common triggers for a clawback.
Under nearly all policies, it is most common for companies to include the ability to recoup compensation previously granted and it is less prevalent to clawback any future incentive compensation. While the final rules are not expected to include future compensation, we expect companies that already have this provision may continue to include it.
|
Compensation Subject to Clawback |
2012 |
2011 |
2010 |
|||
|
No. of cos |
% of Cos. n=94. |
No. of cos. |
% of Cos. N=98 |
No. of Cos. |
% of Cos. n=89 |
|
|
Prior LTI |
88 |
95% |
95 |
97% |
79 |
89% |
|
Prior Annual Incentive |
86 |
92% |
92 |
94% |
81 |
91% |
|
Future Annual Incentive |
19 |
20% |
16 |
16% |
20 |
22% |
|
Future LTI |
18 |
19% |
15 |
15% |
14 |
16% |
Note: Percentages add up to greater than 100% due to multiple responses
Coverage extends to NEOs in 91% of companies, which is consistent with our findings in 2010 and 2011. Of the other 9% of companies, most define coverage as, “executive officers, officers, senior executives or senior management.” Companies are not required to disclose the level of program detail in the proxy, but we expect most program provisions are more broad-based.
Similar to our findings in 2010 and 2011, less than a quarter of companies indicate the length of the look-back period during which compensation can be recovered after a financial restatement. Of the 20 companies that disclosed a time frame, the most common is 1 year (47% of companies) from date of restatement, followed by 3 years (26% of companies). While not common practice, some companies disclose a different time period for annual incentives and long-term incentives.
While many companies are waiting for the SEC to adopt final rules before making comprehensive changes to their policies, companies have been proactive over the last 3 years in adopting clawback policies. On their own merits, such provisions:
- Provide the Board with flexibility to clawback for unforeseen circumstances
- Allow flexibility for the Board to access whether the reinstatement had implications for shareholders (e.g., economic issue or accounting issue)
- Increase executive accountability
- Garner positive reaction from shareholders
- Receive credit by ISS in the QuickScore evaluation (under Equity Risk Mitigation topic)
As we await for the SEC to propose final rules, there are several practical challenges to clawing back compensation, such as how to clawback equity gains, how to claw back from former employees and the tax implications of clawbacks.
HeDGING AND PLEDGING
Hedging and pledging have become shareholder/ corporate governance issues, especially now that ISS views any hedging and significant pledging by insiders to be indicative of a potential failure of risk oversight on behalf of a company’s Board. The Board’s policy regarding these practices is most commonly reflected in the company’s insider trading policy, but it can be addressed through Board resolutions or a stand-alone policy.
Hedging is viewed as a poor practice as it insulates executives from stock price movement and reduces alignment with shareholders. Pledging, in modest amounts, may not be viewed as negatively as hedging, yet can become problematic if there were a significant decline in stock price and which necessitated a sale of shares. Given the potential negative perception of insider hedging and pledging, companies have begun to adopt policies to limit these provisions. Anti-hedging and pledging policies are in place at 91% and 59% of companies studied, respectively; 59% of companies have both policies in place and 32% only have a hedging policy.
|
Hedging / Pledging Policy |
2012 |
|
|
No. of cos |
% of Cos. n=100 |
|
|
Hedging |
91 |
91% |
|
Pledging |
59 |
59% |
|
Both |
59 |
59% |
|
Hedging Only |
32 |
32% |
Note: Percentages add up to greater than 100% due to multiple responses
An example of typical disclosure of a prohibition on hedging/pledging is reflected in PepsiCo’s proxy disclosure:
“Our insider trading policy prohibits executive officers from using any strategies or products (such as derivative securities or short-selling techniques) to hedge against the potential changes in the value of PepsiCo Common Stock. In addition, executive officers may not hold PepsiCo securities in a margin account or pledge PepsiCo stock or PepsiCo stock options as collateral for a loan.”
Pledging was not addressed in Dodd-Frank per se, and we do not know what the SEC’s position will be in the future. We do however expect more companies to adopt pledging policies going forward given ISS’ 2012 policy statement that identified pledging of company stock by executives as a poor practice.
To improve Say on Pay results, many companies have already have already implemented policies that prohibit hedging and pledging.
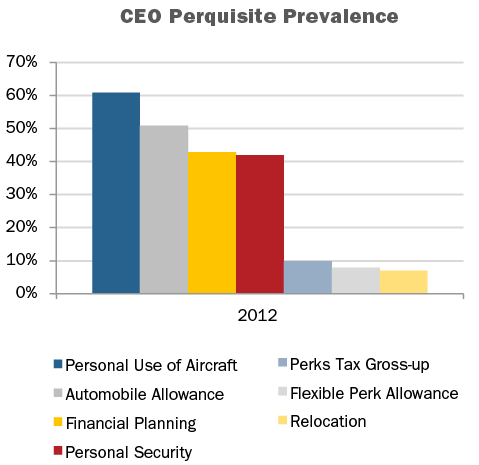
Perquisites
In 2012, companies in our research (91%) provided one or more perquisites to the CEO. Most commonly provided perquisites to the CEO include personal use of aircraft (61%), automobile allowance (51%), financial planning (43%) and personal security (42%).
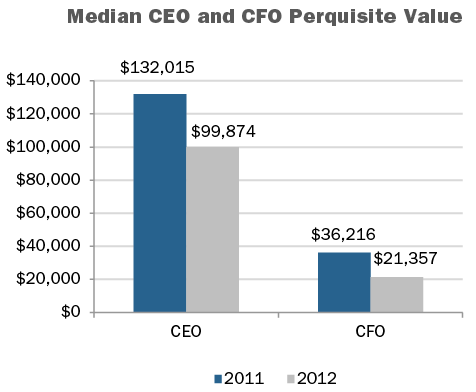
The value of perquisites offered to executives however, has continued to decrease. Median perquisite values disclosed for the CEO and CFO in 2012 were $99,874 and $21,357, respectively. This is a 32% decrease for CEOs and a 70% decrease in value for CFOs in our research. The manufacturing industry had the highest median perquisite values of $319,793 and $69,069 for the CEO and CFO, respectively.
Perquisites tend to be a small proportion of an executive’s total compensation, yet are often highly visible. Shareholders prefer to see pay delivered in performance-based vehicles vs. perquisite programs. Over the past few years, companies have been making changes to these programs in reaction to increased shareholder scrutiny and specific feedback received from shareholders or the likes of ISS or Glass Lewis. In 2012, 9 of 100 companies (9%) disclosed making a change to their perquisite program, a continuation of the trend to reduce perquisites that took hold several years ago.
|
Perquisite Change Reported in 2012 CD&A |
2012 |
2011 |
2010 |
|||
|
No. of Cos. |
% of Cos. n=9 |
No. of Cos. |
% of Cos. n=14 |
No. of Cos. |
% of Cos. n=20 |
|
|
Eliminated tax gross-ups on perquisites |
4 |
44% |
6 |
43% |
8 |
40% |
|
Eliminated perquisite |
2 |
22% |
9 |
64% |
11 |
55% |
|
Reduced perquisite program/value |
1 |
11% |
1 |
7% |
2 |
10% |
|
Changed perquisite program |
1 |
11% |
0 |
0% |
3 |
15% |
Note: Percentages add up to greater than 100% due to multiple responses
Occasionally, a company eliminates a perquisite and offsets some of the lost value or reduction through a salary increase or a one-time payment. An example from 2012 is Lear Corp, which disclosed the following:
“Effective January 1, 2012, we eliminated a separate annual perquisite allowance by adding this amount to the base salary of our Named Executive Officers. However, for purposes of determining incentive awards in 2012 and 2013, which are specified as a multiple of salary, the prior perquisite amount is excluded.”
Importantly, Lear excluded the amount of this increase for purposes of incentives, eliminating the potential to provide an even greater, unintentional increase, in total.
The changes in 2012 include two companies eliminating perquisite allowances, one company approving residential security measures for the CEO and one company reducing the allowance for personal use of aircraft for the CEO and CFO. We expect this trend to sustain as more and more companies are responding to the concerns of their shareholders, which can be voiced through a company’s Say on Pay vote.
Conclusions
With Say on Pay votes held annually for a majority of companies, we continue to see companies stay ahead of the curve and track “best practices” in order to satisfy shareholders and proxy advisory firms. This results in reevaluations of company pay and governance practices, and as our research shows, continued modification of perquisite programs and clawback policies, and adoption of hedging and pledging policies. The goal continues to be closer alignment of executive compensation with shareholder interests. We expect companies and Boards to more proactively monitor proxy advisory firm policies and Dodd-Frank legislation when considering changes to pay programs.
ISS Policy Update – RDA Test
For the past two years ISS has used three quantitative pay vs. performance tests related to CEO pay and company performance (absolute Pay-TSR Alignment / PTA; Multiple of Median / MOM; and Relative Degree of Alignment / RDA) to screen for companies where a potential pay-for-performance misalignment may exist. In addition to the quantitative screen, ISS will always conduct a qualitative analysis of the pay program. If Medium or High concern is identified through the quantitative pay vs. performance screen, the qualitative analysis will be more robust.
For 2014, ISS modified the RDA test. In the past the RDA screen had been calculated as the difference between the company’s TSR rank and the CEO’s total pay rank within a peer group, as measured over one-year and three-year periods. The one-year and three-year periods were weighted 40% and 60%, respectively. The new methodology is focused on three years only. In addition, the RDA policy updates indicates that companies with less than three years of pay and performance data will still be subject to the RDA test, which reflects a change versus past practice.
CAP Perspective: We agree with ISS’ decision to apply a longer-term focus to the quantitative RDA test; i.e., solely a three-year timeframe for both pay and performance. However, we believe that recent Committee decisions best relate to company performance over time.
Board Response to Majority Supported Shareholder Proposals
For 2014, ISS made three changes to its policy on Board responsiveness to majority-supported shareholder proposals.
- ISS will review the responsiveness of a Board to any shareholder proposal that receives one year of a majority of votes cast support (rather than the previous “triggers” of either two years of a majority of votes cast in a three-year period, or one year of a majority of shares outstanding);
- ISS adopted a case-by-case approach, including a list of factors for Analysts to consider, for assessing implementation of majority vote proposals;
- Finally, ISS provided Analysts with broader discretion when determining which directors to hold accountable in the event the level of responsiveness is found to be insufficient.
We note here that ISS included “the Board’s rationale as provided in the proxy statement” as one of the factors in the case-by-case analysis.
CAP Perspective: Using the proxy statement as a communication (marketing) document in addition to a compliance document has been an often stated best practice over the past few years, which gains additional support from this ISS policy update.
This “comply or explain” policy update from ISS encourages the Board to enact a majority supported shareholder proposal, but gives an important second route. We believe there are instances where the Board should be able to exercise its discretion to respond in a manner that it believes is in the best interest of the company. However, we believe that providing rationale in these instances is also important.
Conclusion
ISS policies and tests should not determine, but rather be one input to the compensation program design and annual decision making process. Therefore, an understanding of ISS’ policies and tests, both retrospectively and prospectively (projection) is important. We encourage our clients to review how ISS’ 2014 policy updates are likely to impact them.
CAP submitted comments to ISS on the draft policy updates, which can be found at: http://www.issgovernance.com/2014draftpolicycommentperiod.
Reflecting a change with past practice, ISS is opening a new consultation period on approaches to certain benchmark policies for consideration for longer term policy changes (beyond 2014). An example of the type of area that this will cover is evaluation of new share requests. As more information on the consultation period and related topics becomes available, we will update our clients. The current consultation period closes in February 2014, which will eventually be followed by the more traditional process which includes a policy survey followed by release of draft policies for comment.


