On July 1, 2015, the SEC proposed rules directing the stock exchanges to expand listing standards to require companies to adopt clawback policies. These clawback policies would require executive officers to pay back incentive compensation that was awarded in error under an accounting restatement. According to SEC Chair Mary Jo White, the express purpose of the rules are ‘increased accountability and greater focus on the quality of financial reporting, which will benefit investors and markets.” With these proposed rules, the SEC has now addressed all of the executive compensation governance reforms included in the Dodd-Frank Wall Street Reform and Consumer Protection Act of 2010.
Where Do We Go From Here?
- Most major companies have already implemented clawback policies
- SEC proposal on clawbacks does not align with current market practice
- Includes current and former executive officers
- Triggered exclusively by an accounting restatement resulting from an error
- Triggered regardless of whether executive has committed fraud or misconduct related to the accounting restatement
- Includes a 3-year look-back period
- Generally precludes board discretion
- Accompanied by onerous disclosure rules
- Assess your company’s current clawback policy against the proposed rules
- Brief senior management and the board on the scope of the proposed rules
- Await further developments after the public comment period ends and final rules are issued
Broad Scope
The SEC’s proposal amends the Securities Exchange Act of 1934 (the “Exchange Act”) by adding new Exchange Act Rule 10-D1. Other amendments would apply to filings by foreign private issuers and certain investment companies. As a result, the clawback rules will apply to virtually all listed issuers of equity securities, debt and preferred securities, including emerging growth companies, smaller reporting companies, foreign private issuers and controlled companies.
New Rule 10-D1
As proposed, an issuer would be subject to delisting if it fails to (1) adopt a clawback policy that complies with the new requirements, (2) disclose the policy and (3) comply with the policy to recover compensation under an accounting restatement. Under the proposal, clawback of incentive compensation would be required from current and former executive officers who received excess incentives during the three fiscal years prior to the date on which a company is required to prepare an accounting restatement to correct a material error. The clawback provision applies on a “no fault” basis, regardless of whether misconduct occurred and regardless of whether an individual had any responsibility for the error.
The amount subject to clawback would be the amount that exceeds the amount that the executive officer would have received if the incentive compensation had been determined using restated financial statements. The proposed rules direct companies to use reasonable estimates of the effect that an accounting restatement would have on stock price and total shareholder return to determine amounts subject to recovery.
Limits on Board Discretion
Under the proposal, the situations where a Board could elect not to pursue recovery are limited. The SEC specified situations where the direct expense related to enforcing recovery would exceed the amount recovered. However, even in these situations, the Board would have to go through the process of determining the amount subject to clawback and make an attempt at recovery before deciding not pursue enforcement of the recovery. In addition, foreign private issuers could elect not to comply when clawback would violate home country law.
Trigger for Recovery
New Rule 10-D1 would trigger a clawback in the event that the issuer prepares a restatement of previously issued financial statements to correct an error that was material. Note that the requirement to restate financial statements is enough to trigger the clawback provisions, allowing the SEC to avoid the potentially thorny question of what constitutes a material error. Under GAAP, an error may include mathematical mistakes, mistakes in the application of GAAP principles, or oversights or misuse of facts when the financial statements were prepared. The proposal indicates several types of changes to financial statement that are not error corrections and would not trigger clawback, including
- Retrospective application of a change in accounting principle;
- Retrospective revision to reportable segment information due to a change in the structure of the issuer’s organization;
- Retrospective reclassification due to a discontinued operation;
- Retrospective application of change in reporting entity, such as from a reorganization;
- Retrospective adjustment to provisional amounts in connection with a prior business combination; and
- Retrospective revision for stock splits.
3-Year Look-Back Period
The proposed clawback will apply to excess incentives during a 3-year period prior to the date on which the issuer is required to prepare an accounting restatement. The proposal defines this date as the earlier of:
- The date the issuer’s board of directors, a committee of the board of directors, or the officer or officers of the issuer authorized to take such action if board action is not required, concludes , or reasonably should have concluded , that the issuer’s previously issued financial statements contain a material error; or
- The date a court, regulator or other legally authorized body directs the issuer to restate its previously issued financial statements to correct a material error.
The SEC notes that the first proposed date would generally coincide with the filing of Form 8-K, but Form 8-K is not necessary for recovery. Further, the obligation to clawback does not depend on whether or when restated financial statements are filed.
Application to Executive Officers
The proposed clawback rules apply to current or former executive officers who received incentive compensation. Under the proposal, executive officer is defined as the issuer’s president, principal financial officer, principal accounting officer (or controller), any vice president to the issuer in charge of a principal business unit, division or function (such as sales, administration or finance), any other officer who performs a policy-making function, or any other person who performs a similar policy-making functions for the issuer.
This proposed definition of executive officer is modeled on the definition used in Section 16, so it will apply to a reasonably large group of senior executives. The proposal also specifies that individuals who served as an executive officer at any time during the performance period for incentive compensation subject to recovery will be subject to clawback. This would include incentive compensation authorized before the individual becomes an executive officer and inducement awards granted in new hire situations.
Compensation Subject to Clawback
The SEC proposal contains a very broad definition of “incentive-based compensation” subject to clawback. As proposed, this would be defined as “any compensation that is granted, earned or vested based wholly or in part upon the attainment of any financial reporting measure.” The rules would also specify that “financial reporting measures” are measures determined and presented in accordance with the accounting principles used to prepare the issuer’s financial statements, any measures derived wholly or in part from such financial information and stock price and total shareholder return.
This definition wraps in accounting-based measures, as well as non-GAAP measures. Notably the SEC proposal includes stock price and total shareholder return. Although these are not accounting-based measures, the SEC included them because these measures are affected by accounting information and subject to current disclosure (i.e., stock performance graph and disclosure of high and low stock prices for each quarter within the two most recent fiscal year and any subsequent interim periods). Importantly, stock options and restricted stock that vest solely based on continued service are not subject to clawback.
The SEC acknowledges the complexities associated with trying to determine the amount of excess compensation related to the relationship between an accounting error and stock price. The SEC recognizes that complex analyses may be required. As a solution, the SEC suggests that issuers be permitted to make reasonable estimates and requires disclosure of these estimates.
The proposal includes examples of compensation that would be subject to clawback, as well as compensation that would be excluded:
|
Compensation Subject to Clawback |
Compensation Excluded from Clawback |
|
Non-equity incentive plan awards that are earned based wholly or in part on satisfying a financial reporting measure performance goal |
Salaries |
|
Bonuses paid from a bonus pool, the size of which is determined based wholly or in part on satisfying a financial reporting measure performance goal |
Bonuses paid solely at the discretion of the Compensation Committee or Board, not paid from a pool determined wholly or in part on satisfying a financial reporting measure goal |
|
Restricted stock, RSUs, performance shares, stock options and SARS that are granted or become vested wholly or in part on satisfying a financial reporting measure performance goals |
Bonuses paid on subjective standards (e.g., leadership) and/or completion of a specified employment period |
|
Proceeds received upon the sale of shares acquired through an incentive plan that were granted of vested based wholly or in part on satisfying a financial reporting measure performance goal |
Non-equity incentive plan awards earned solely upon satisfying one or more strategic measures (e.g., consummating a merger or divestiture) or operational measures (e.g., opening a specified number of stores, completion of a project, increase in market share) |
|
Equity awards for which the grant is not contingent upon achieving any financial reporting measure performance goal and vesting is contingent solely upon completion of a specified employment period and/or attaining one or more non-financial reporting measures |
Proposed Disclosure Requirements
Proposed new Rule 10D-1 would require disclosure of the issuer’s policy related to clawback of erroneously awarded compensation. The clawback policy would need to be filed as an exhibit to Form 10-K for listed U.S. issuers.
The proposal contains additional disclosure requirements that are extensive when a restatement was completed or an outstanding balance of excess incentive-based compensation relating to a prior restatement. In these instances, the proposed disclosure would include:
- For each restatement, the date on which the listed issuer was required to prepare an accounting restatement, the aggregate amount of excess incentives and the aggregate amount that remains outstanding as the end of the most recent completed fiscal year;
- The estimates used to determine the excess incentive compensation related to a stock price or total shareholder return measure;
- The name of each person subject to clawback for whom the listed issuer decided not to pursue recovery, the amount forgone and a description of the reason the issuer decided not to pursue recovery; and
- The name and amount due from each person from who, at the end of the last completed fiscal year, excess incentive-based compensation had been outstanding for 180 days or longer.
The proposed disclosure would be included as a separate item, not part of the CD&A. However, companies would have the option of providing the information in the CD&A to provide all information related to the clawback policy in one place.
The proposed rules also include amendments to Summary Compensation Table disclosure. Amounts previously reported would be reduced by the amount recovered by clawback with a footnote explanation. Finally, the required disclosure would be provided as interactive using XBRL block-text tagging.
Other Important Provisions
The proposed rules are incorporated in a 198 page filing. They are very detailed and complex. This article necessarily serves as a summary of the most important points that we see as being of general interest. But there are other details that shed light on the SEC’s thinking, as follows:
- Incentive-based compensation recovery will apply to pre-tax amounts.
- Clawback may occur simultaneously under new Rule 10D-1 and SOX Section 304. If an individual reimburses the Company under Section 304, a credit will be recorded for purposes of new Rule 10D-1.
- Lack of compliance with a clawback policy threatens a company with delisting, depending on the stock exchange’s assessment of whether the company was making a good faith effort to clawback compensation.
- Companies may not indemnify executive officers or former executive officers against the loss of erroneously awarded compensation.
- If an executive purchases third-party insurance, companies would be prohibited from paying the premiums for this insurance.
Timing of New Rules
The SEC’s proposal calls for prompt implementation. The current comment period extends for 60 days. After final rules are adopted, the SEC is calling for the stock exchanges to file their proposed amended listing standards within 90 days. Following the effective date of the stock exchange listing standards, each listed company would be required to adopt a clawback policy within 60 days. Clawback would apply to all excess incentive-based compensation received for any fiscal year ending on or after the effective date of new Rule 10D-1. Similarly, disclosure requirements would become effective immediately on or after the date on which the stock exchange listing standards become effective.
Annually, Compensation Advisory Partners (CAP) evaluates pay levels for Chief Financial Officers (CFOs) and Chief Executive Officers (CEOs). This year’s analysis is based on a sample of 108 companies with median revenues of $12.4 billion. For more information on how we developed the sample of companies, please see below under Sample Screening Methodology.
Highlights
- Salary increases were provided much more frequently to CFOs, with approximately 70% receiving a salary increase, than to CEOs
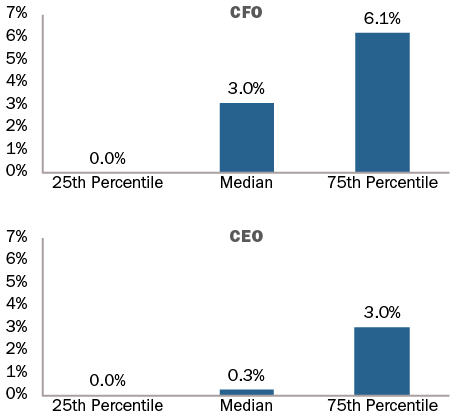
- The median salary increase was only 0.3% for CEOs, while CFO salaries grew by 3.0%
- Similar to last year, the median increases in actual total direct compensation (i.e., cash plus equity) for both CEOs and CFOs, were in the low single-digits
- 2014 median increases in actual total direct compensation were 3.2% for CEOs and 5.2% for CFOs
- Slightly higher pay growth for CFOs was partially driven by higher annual bonus target opportunities in 2014
- On an absolute basis, CFO total compensation continues to approximate one-third of CEO total compensation
- Little or no changes observed in how long-term incentives are delivered to CEOs and CFOs; Long-term incentive mix continues to emphasize performance-based equity
Study Results
Salaries
In the last 2 years, approximately 70% of CFOs received salary increases. The median salary increase for CFOs was 3.0% and the 75th percentile salary increase was 6.1%. In comparison, only about half of CEOs received salary increases. The median salary increase for CEOs was only 0.3% at median and the 75th percentile salary increase was 3.0%.
|
% of Executives Receiving Salary Increases |
||||
|
|
2012 – 2013 |
2013 – 2014 |
||
|
|
No Increase |
Receiving Increase |
No Increase |
Receiving Increase |
|
CEO |
52% |
48% |
49% |
51% |
|
CFO |
31% |
69% |
28% |
72% |
2014 Salary Increases
Actual Pay Levels
Our findings indicate a median rate of increase in actual total direct compensation levels for both CEOs and CFOs in the low-single digits. The median increases over the last two years ranged between 3% and 5%. During 2013-2014, actual total direct compensation (salary plus actual annual incentive plus the grant date value of long-term incentives) for CEOs and CFOs increased by 3.2% and 5.2%, respectively.
Industry Trends
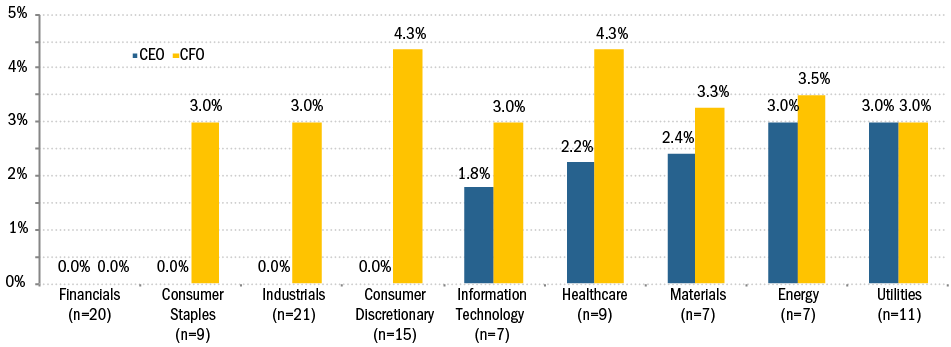
2014 Median Salary Increase by Industry
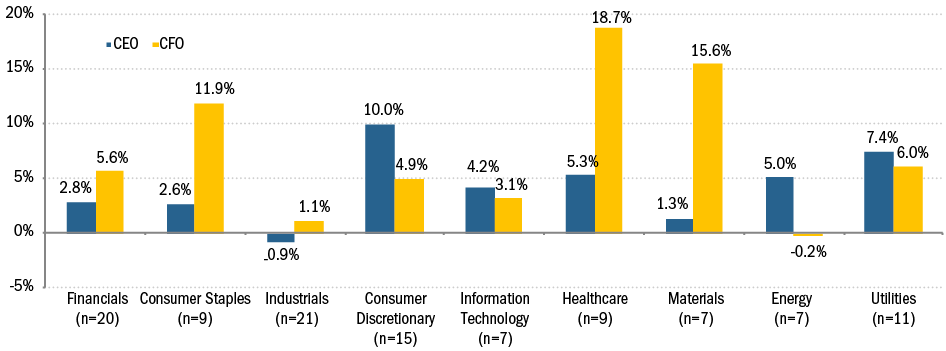
2014 Median Actual Total Compensation Increase by Industry
|
Median Percentage Change in Pay Components |
||||
|
|
2012 – 2013 |
2013 – 2014 |
||
|
Pay Components |
CEO |
CFO |
CEO |
CFO |
|
Salary |
0% |
3.0% |
0.3% |
3.0% |
|
Actual Bonus |
4.1% |
3.7% |
4.3% |
7.8% |
|
Long-Term Incentives |
2.3% |
3.1% |
3.7% |
4.2% |
|
Actual Total Direct Compensation |
3.7% |
3.6% |
3.2% |
5.2% |
As seen in the table above, the median 2014 increase in actual bonus for CFOs was double the median increase for CEOs. This large increase in annual bonus is partially driven by higher bonus target opportunities in 2014 for CFOs, with the median target bonus increasing from 90% to 100% of salary. In contrast, CEO target bonus opportunities remained relatively flat at approximately 150% of salary.
|
Target Bonus as % of Salary |
||||
|
|
2013 |
2014 |
||
|
Pay Components |
CEO |
CFO |
CEO |
CFO |
|
25th Percentile |
125% |
75% |
125% |
80% |
|
Median |
147% |
90% |
150% |
100% |
|
75th Percentile |
170% |
100% |
165% |
105% |
When analyzed by industry, median increases in salary for CEOs are generally less than 3%. Median salary increases to CFOs are much more robust, generally in the range of 3-4%. Median salary increases over 3% are seen for CFOs in the following industries: Consumer Discretionary, Energy, Healthcare, and Materials. The Financials industry is the only industry were the median change in salary was 0% for both CEOs and CFOs.
When we look at actual total direct compensation by industry, greater volatility is observed. The volatility in year-over-year changes is primarily driven by industry and company performance. Some of the largest increases in compensation levels are seen in Consumer Staples, Healthcare and Materials.
Target Pay Mix
The average total target compensation pay mix remained largely unchanged. At-risk pay continues to be more emphasized for CEOs than for CFOs.
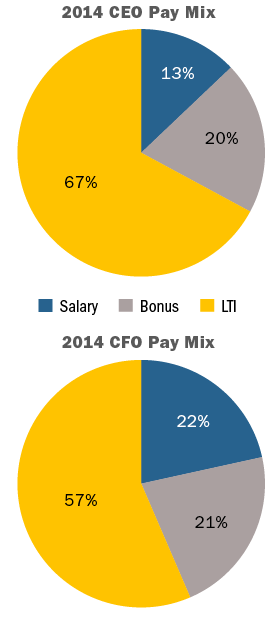
Long-Term Incentive (LTI) Vehicle Prevalence and Mix
Equity mix and vehicles used for LTI awards remained fairly consistent for the past several years. The majority of companies continue to use two different vehicles to deliver long-term incentives to CEOs/CFOs and a quarter of companies studied use all three equity vehicles (time-based stock awards, awards under a performance plan, and stock options)
Performance plans account for roughly 50% of LTI awards, about 25% is delievered in stock options, and about 25% in time-vested restricted stock awards. The overall percentage of performance-based awards (performance plans and stock options) for both CEOs and CFOs continues to range between 75% – 80%.
|
LTI Mix |
||||
|
|
2013 |
2014 |
||
|
|
CEO |
CFO |
CEO |
CFO |
|
Stock Options |
27% |
27% |
26% |
25% |
|
Time Vested Restricted Stock |
17% |
22% |
21% |
26% |
|
Performance Plans |
56% |
51% |
53% |
49% |
Conclusion
In terms of performance, 2014 was a good year for our sample of companies with median total shareholder return of 15%, median revenue growth of 5% and median net income growth of 9%. We believe the 2014 pay changes were aligned with performance for the year. For CEOs, salary increases were modest, but increases in actual bonus and long-term incentives contributed to a median increase in actual total direct compensation of 3.2%. Pay progression opportunities for CFOs were even stronger, with a median increase of 7.8% in actual bonus and 4.2% in long-term incentives yielding a 5.2% median increase in actual total direct compensation.
In terms of compensation program design for senior executives, we saw relatively little change. The increase in annual target bonus opportunity for CFOs was noteworthy, but long-term incentives practices are similar to last year’s study. The increase in performance-based long-term incentives is significant and we expect this to remain the mainstream practice.
Sample Screening Methodology
Based on the screening criteria below, we arrived at a sample of 108 public companies with median 2014 revenue of $12.4B.
|
Revenue |
At least $5B in revenue for fiscal year 2014 |
|
Fiscal year-end |
Fiscal year-end between 9/1/2014 and 12/31/2014 |
|
Proxy Statement Filing Date |
Proxy statement filed before 3/31/2015 |
|
Tenure |
No change in CEO and CFO incumbents in the past three years |
|
Industry |
All industries have been considered for this analysis |
Proposed amendments to Item 402 of Regulation S-K outline additional disclosure requirements designed to implement Section 14(i) of the Securities Exchange Act of 1934 (the “Exchange Act”), as added by Section 953(a) of the Dodd-Frank Wall Street Reform and Consumer Protection Act (“Dodd-Frank”).
The SEC recently updated its regulatory agenda, impacting select compensation-related rulemaking that resulted from the 2010 Dodd-Frank Wall Street Reform and Consumer Protection Act (“Dodd-Frank”). As part of the update, the deadline to issue final CEO Pay Ratio rules, final Hedging Disclosure rules, and proposed Compensation Clawback rules was pushed back to April 2016 (from October 2015).
- Implication (Pay Ratio): if final rules are adopted in April 2016, companies with a December 31 fiscal year end are not expected to be required to comply with pay ratio rules/disclosure until publication of 2018 proxy statements
- Implication (Hedging Disclosure): if final rules are adopted in April 2016, companies with a December 31 fiscal year end are not expected to be required to comply with disclosure rules until publication of 2017 proxy statements. However, if the rule is released early, by the end of 2015, disclosure requirements could still be effective for 2016 proxy statements
- Implication (Compensation Clawback): No information regarding effective date(s) is currently available
These timeline changes reflect a new deadline, not the date rulemaking will be published, proposed or adopted.
We will provide additional updates as this issue continues to evolve.
On Wednesday April 29, the SEC held an open meeting and approved by a vote of 3-2 a staff proposal to amend Section 14(i) of the Securities Exchange Act of 1934 to expand disclosure requirements for executive compensation. The proposed amendment was added by Section 953(a) of the Dodd-Frank Wall Street Reform and Consumer Protection Act of 2010. The proposed rules will require clear disclosure of the relationship between executive compensation actually paid and company financial performance.
The SEC’s objectives – enhanced disclosure, more transparency, alignment of pay and performance – are praiseworthy, but some of the new rules are complex. CAP predicts that compliance will prove to be burdensome for most companies.
Highlights of the Proposed Rules
Publication of a New Table: The proposed rules add a new table to the current disclosure on executive compensation. This new table will include:
- Executive compensation actually paid for the principal executive officer and the average amount actually paid to the remaining named executive officers. For purposes of the table, compensation actually paid is total compensation as disclosed in the summary compensation table with adjustments to the amounts included for pensions and equity awards.
- The total executive compensation reported in the summary compensation table for the principal executive officer and an average of the reported amounts for the remaining named executive officers.
- The company’s total shareholder return (TSR) on an annual basis as presented in the existing stock performance graph. The definition of TSR is provided for the stock performance graph in Item 201(e) of Regulation S-K.
- The TSR of the companies in a peer group or index, using either the peer group identified by the company in its stock performance graph or in its compensation discussion and analysis.
CAP predicts that graphic representations, similar to the Stock Performance Graph, will be a popular approach.
Additional Disclosure: In addition to the new table, companies will be required to provide a clear explanation for the relationship between compensation actually paid and the company’s TSR performance. An explanation of the company’s TSR performance and the TSR performance of the peer group or index is also required. Companies will have the flexibility to provide this explanation as a narrative, in a graph or by using both.
Adjustments to Calculate Compensation Actually Paid: Companies will need to make two adjustments to total compensation reported in the summary compensation table to calculate compensation actually paid. The adjustments relate to equity award values and pension values. Companies will be required to disclose the adjustments to the compensation reported in the summary compensation table in a footnote.
First, the reported grant date value of equity will be subtracted from reported total compensation and the fair value of equity vesting in that year and re-valued on the date of vesting will be added to calculate compensation actually paid. Companies will need to disclose the vesting date valuation assumptions if they differ materially from the assumptions used for financial statements as of the grant date.
In the second adjustment, the reported change in pension value will be subtracted from reported total compensation and the change in pension value attributable to the actuarially determined service cost for services rendered by the executive during the applicable year will be added.
Time Period Covered: The disclosure will be required for the last five fiscal years, provided a company was subject to disclosure rules during this period.
Interactive Data Format Required: Companies will be required to tag the disclosure in an interactive data format using eXtensible Business Reporting Language, or XBRL.
Covered Companies: The proposed rules apply to all reporting companies, except that foreign private issuers, registered investment companies and emerging growth companies are exempt.
Transition Period: The proposed rules provide a phase-in for all companies. In the first year, companies will be required to provide the information for three years. The fourth and fifth years of disclosure will be added in each subsequent year’s annual proxy filing that requires this disclosure.
Rules for Smaller Reporting Companies: These companies are required to provide disclosure for only the last three fiscal years, rather than for five fiscal years. Smaller reporting companies will not be required to include peer group TSR, since they do not disclose either a stock performance graph or a compensation discussion and analysis. In addition, smaller reporting companies will not be required to make adjustments to pension amounts because they are subject to scaled compensation disclosure requirements that do not include disclosure of pension plans. The requirement to tag disclosure in an interactive data format will also be phased-in for smaller reporting companies, so that they will not be required to comply with the tagging requirement until the third annual filing in which the pay-versus-performance disclosure is provided. Initially, smaller reporting companies will provide the information for two years, adding an additional year in the next annual proxy or information statement.
Process: The proposed rules will be published on the SEC’s website and in the Federal Register. The comment period for the proposed rules will last for 60 days after publication in the Federal Register.
Adjustment to equity award values adds complexity and creates disconnects. By revaluing equity on the date of vesting, timing differences between the TSR calculation and the date(s) of vesting will occur. In addition, compensation actually paid will include tranches of different awards that happen to vest in a particular year so Board decision-making on pay and performance in the year of grant will be unclear.
CAP’s Initial Assessment of the Proposed Rules
We applaud the SEC’s attempt to improve disclosure and we agree that pay and performance alignment is critical to good governance and effective executive compensation programs. We also agree that some standardization is necessary. Our research indicates that approximately 15% to 20% of S&P 250 companies provide supplemental disclosure of either realized or realizable pay. Currently, there is no standard definition for either formulation of total compensation. Supplemental pay disclosure is frequently compared to TSR performance, but a consistent approach that can be compared across companies does not exist. The proposed rules impose a standard approach, but at what cost?
We are concerned that the proposed rules are too prescriptive and overly complex. Implementation will burden many companies. The proposed definition of compensation actually paid stands out as our biggest concern. The SEC proposal requires companies to re-value equity awards that vest in each year as of the date of vesting. This approach instantly creates timing differences between the stock prices used in the TSR calculation and the stock prices on the date(s) of equity award vesting. Vesting dates occur throughout the year, but occur most frequently in February – April for calendar year companies. As a result, the proposed approach allows for a re-valuation of equity awards at a more current stock price, but that stock price will likely not correlate with the fiscal year end stock price used in the TSR calculation. This is an obvious disconnect.
In addition, the re-valuation of equity awards for most companies will be composed of tranches of different awards that were granted in different years — likely spanning a three to five year period — that happen to vest in a single year. This approach contributes to confusion around the Board’s thinking on pay and performance alignment, rather than increasing clarity. Instead of focusing on the date of vesting, a better approach would be to re-value equity awards granted in a single year using a year-end stock price consistent with the TSR calculations.
Finally, to the extent that a company uses stock options, updating the assumptions used in option pricing models, such as Black-Scholes, to reflect the date of vesting will be time-consuming at best. This means that stock options will not only be re-valued at a new stock price, but that other assumptions, such as expected life, volatility, dividend yield and risk-free rates, must also be updated.
Two other aspects of the proposed rules contribute greatly to the compliance burden. First, the requirement to include compensation of the average of the remaining named executive officers in the new table in addition to the compensation of the CEO will be very complicated for companies to work through. Publication of this average based on equity grants made over a three to five year span to at least four executives for five years potentially requires dozens of calculations. The SEC should have limited the new disclosure to the CEO since that would greatly reduce the compliance burden and arguably allow for a simpler and more targeted explanation of the Board’s thinking. After all, the CEO normally sets the tone for the entire organization!
The second aspect of the proposed rules that increase the compliance burden is the decision to publish five years of information, rather than three years. Arguably longer time frames are positive when assessing TSR performance, but the summary compensation table shows three years of compensation. Most supplemental disclosure of realized and realizable pay out there today incorporates only three years of compensation and performance data. Even though the SEC provides transition relief, building out the new table to cover five years will be burdensome.
Adjustment to change in pension value is appropriate since it eliminates the impact of changes in assumptions for mortality and discount rates.
We will refine our initial assessment and provide more finely tuned comments back to the SEC during the public comment period. We would not be surprised if the SEC backs off on the date of vesting re-valuation of equity in favor of date of grant re-evaluation. Many will recall that when the proxy disclosure rules were initially proposed, equity award values reflected the amounts recognized for financial reporting purposes. After much public discussion and pushback, the SEC amended the disclosure rules in 2009 to incorporate the grant date fair value of equity awards.
More to come on these points in the next few months! We hope that the SEC achieves consensus on effective pay and performance disclosure before the 2016 proxy season begins.
Highlights
- Median increase of 15% in total compensation for CEOs delivered through both above target bonus payouts and higher long-term incentive awards (“LTI”)
- More companies are paying above target bonuses for 2014 performance. 72% of companies had a payout at or above target versus 40% and 46% of companies in 2013 and 2012, respectively
- Companies with higher bonus payouts demonstrated correspondingly higher levels of financial performance, including stronger top-line growth and greater profitability
- Companies continue to shift a greater portion of total LTI into a performance-based vehicle although time-based stock options and restricted stock remain prevalent
- Performance-based long-term vehicles represent the largest portion of LTI with many companies incorporating TSR as a metric
Total Compensation
Among Early Filers with CEOs who held their position for at least two years (37 companies), actual total compensation in 2014 increased 15% from 2013. The increase in total pay was delivered mostly through the annual and long-term incentive awards, with median increases of 18% and 14% increases year over year, respectively.
|
Compensation Element |
% Increase at Median |
|
Base Salary |
1.5% |
|
Annual Incentive |
18% |
|
Total Cash |
9% |
|
Long-Term Incentive (LTI) |
14% |
|
Total Compensation |
15% |
Base Salary
Among the Early Filers, companies continue to provide modest salary increases to the NEOs. Salary increases for incumbent CEOs ranged from 0 – 5%. Approximately 50% of companies did not increase their CEO's salary in 2014.
Annual Incentive Compensation
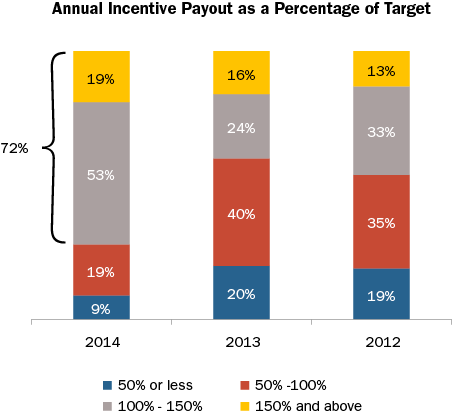
2014 was a strong financial year for the Early Filers, reflected in 8.8% EPS growth at median and 15% TSR for the year. This resulted in higher annual incentive payouts compared to both 2013 and 2012. 72% of companies had a payout at or above target versus 40% and 46% of companies in 2013 and 2012, respectively.
The companies that paid a bonus at or above target had stronger financial performance than both the S&P 500 and all Early Filers. Higher performance among companies with higher bonus payouts was evident in all three financial metrics examined, including Revenue growth, Pre-tax Income growth and EPS growth. For example, median EPS growth for these higher performers was 13.3% (versus 9.9% among the S&P 500 and 8.8% among all 50 Early Filers). Higher performance for companies with above target bonus payouts demonstrates that pay and performance is well-aligned. One-year TSR performance (as of February 2015) was similar across all groups.
|
Financial Metric |
Median 1-Yr Performance |
||
|
S&P 500 |
All Early Filers (n=50) |
Companies with at or above target payout (n=36) |
|
|
Revenue Growth |
5.2% |
5.7% |
6.4% |
|
Pre-Tax Income Growth |
8.3% |
6.2% |
9.7% |
|
EPS Growth |
9.9% |
8.8% |
13.3% |
|
TSR |
15.7% |
15.2% |
15.2% |
Median annual incentive payout as a percentage of target for all Early Filers was 111% in 2014 which was higher than the median in both 2013 and 2012.
|
Summary Statistics |
Annual Incentive Payout as a % of Target |
||
|
2014 |
2013 |
2012 |
|
|
75th Percentile |
136% |
116% |
130% |
|
Median |
111% |
94% |
100% |
|
25th Percentile |
99% |
75% |
72% |
Although 2014 was a strong year, companies are continually refining their annual incentive plan to ensure executive pay is aligned with performance. Among companies in our study, 34% made changes to the annual incentive plan with a majority of companies making changes to annual incentive metrics.
The chart below illustrates all changes companies made to their annual incentive plan:
|
Type of Change Reported |
Companies Reporting Changes (n = 17) |
|
|
# of Cos. |
% of Cos. |
|
|
Change in performance metrics used to fund awards |
12 |
71% |
|
Change in performance metric weighting / mix |
4 |
24% |
|
Increased target annual incentive award opportunity (CEO and/or CFO) |
4 |
24% |
|
Other |
4 |
24% |
Note: Percentages add to greater than 100% due to multiple changes by select companies.
Long-Term Incentive Compensation
The use of time-based LTI (stock options and restricted stock) continues to be prevalent, yet performance-based LTI continues to play the strongest role in the overall LTI mix.
Approximately 50% of companies in our study made changes to their overall LTI program. Most changes involved the mix of vehicles, which continues the recent trend of increasing performance-based LTI and reducing the reliance on time-based long-term incentives. The table below indicates all changes made by the Early Filers:
|
Type of Change Reported |
Companies Reporting Changes (n = 26) |
|
|
# of Cos. |
% of Cos. |
|
|
Mix of LTI award vehicles |
11 |
42% |
|
Increased or reduced LTI award target opportunity level (CEO and/or CFO) |
8 |
31% |
|
Performance plan metric |
7 |
27% |
|
Add or eliminate LTI vehicle |
7 |
27% |
|
Vesting/performance period |
4 |
15% |
|
Other |
2 |
8% |
Note: Percentages add to greater than 100% due to multiple changes by select companies.
Among the companies that changed their LTI mix, most increased the emphasis on performance-based LTI while reducing stock option use. The portion of LTI awarded in the form of time-based restricted stock remained relatively unchanged. Overall, nearly 90% of companies use performance-based LTI, 74% use stock options and 62% use time-based restricted stock.
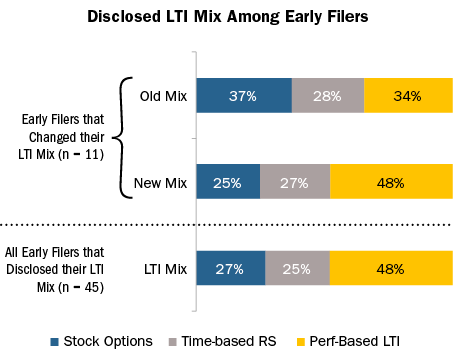
Among the Early Filers that grant performance-based LTI awards, approximately 60% use two or more metrics. The use of multiple metrics provides balance and rewards executives based on holistic performance.
Approximately two-third of companies use relative Total Shareholder Return ("TSR") as a performance metric. Companies incorporate TSR as a long-term incentive metric for multiple reasons including aligning with the shareholder experience, simplifying the goal-setting process and conforming to proxy advisory firms’ preference for TSR. Among the companies that use relative TSR as a standalone metric, it typically represents 25-50% of the total performance award. Some companies use financial performance (either absolute or relative) to fund the payout of the performance award and use relative TSR to modify the final payout, thereby incorporating it as an LTI metric but reducing its overall effect on payouts.
|
Weighting of TSR Metric in the LTI Plan (n = 28) |
Number of other LTI Metrics |
% of Companies |
|
25% |
1 – 2 |
11% |
|
50% |
1 |
29% |
|
Weighting not disclosed |
2 |
7% |
|
100% |
0 |
32% |
|
Modifier |
2 – 3 |
21% |
Say on Pay (SOP) Vote Results
In 2015, 98% of Early Filers that released SOP results this year received majority shareholder support; most companies (approximately 75%) received greater than 90% support. Compensation program design changes can and do improve Say on Pay results! Among the companies that made changes to either their annual or long-term incentive plan in 2014 (n = 29), 97% received majority shareholder support with approximately 70% receiving greater than 90% support. However, making a change to the incentive program design does not guarantee shareholder approval of the executive compensation program.
When fundamental problems with the compensation program exist – such as high pay levels or misalignment with performance – companies may fail the SOP vote. Additionally, poor SOP results can be attributed to shareholders expressing dissatisfaction with other aspects of the company’s business, its management or TSR performance.
Conclusion
2014 annual incentive payouts among the Early Filers were higher than 2013 which, when combined with the rise in LTI award levels, resulted in a 15% increase in total compensation. We saw a big increase in the number of companies with at or above target bonus payouts, as well as higher performance among these companies. Nearly 65% of companies use TSR as a long-term incentive metric, suggesting that companies are trying to enhance alignment between executive pay and shareholder experience.
Companies continue to make changes to their annual incentive and LTI plans, with a strong focus on enhancing the pay for performance relationship through modification of the annual incentive metrics and/or the long-term vehicle mix. Among companies that changed their LTI vehicle mix, they tended to increase the role of performance-based LTI. Our experience suggests these trends are consistent with the broader market practice. While changes to the incentive plan will likely lead to a favorable Say on Pay vote, companies should be aware of that other factors may affect the vote.
Key Takeaways
- Compensation Committees face intense scrutiny with respect to executive annual bonus payouts and their alignment with performance
- Over a multi-year period, executives tend to earn an annual incentive payout approximately 90% of the time
- As a general rule of thumb, based on analysis of the past 6 years, the degree of difficulty, or “stretch”, embedded in performance goals translates to:
- A 90% chance of achieving Threshold performance
- A 70% chance of achieving Target performance
- A 15% chance of achieving Maximum performance
- This pattern indicates that threshold and target performance goals are set at attainable levels, but maximum payouts commonly reflect rigorous goals and superior performance
- Annual incentive payouts have generally been aligned with financial performance over the past six years for the companies reviewed
Background
Goal setting is one of the most challenging aspects of the compensation process. Compensation Committees struggle with this critical activity and try to determine if they are “getting it right”. Goals tied to annual incentive compensation face scrutiny from both internal and external stakeholders, pressuring Committees to achieve a balance between the rigor and the attainability of their goals. Appropriate performance targets will motivate and retain executives while driving corporate performance and creating returns for shareholders.
Summary of Findings
Plan Design
Annual incentive plans can be categorized as either “Goal Attainment” plans or “Discretionary” plans. Goal attainment plans contain traditional performance and payout scales that consist of a pre-determined minimum, target and maximum level of performance and corresponding payouts. Discretionary annual incentive plans allow the Committee to determine payouts by using discretion and targets are not necessarily defined up front.
In this study, we found that 71% of the sample companies have goal attainments plans. Discretionary plans are most prevalent among Financial Services companies. Our analysis focuses on those companies with goal attainment plans.
|
Plan Type |
|||
|
Industry |
Sample Size |
Goal Attainment |
Discretionary |
|
Auto |
n= 7 |
100% |
0% |
|
Consumer Discretionary |
n= 10 |
90% |
10% |
|
Consumer Staples |
n= 11 |
91% |
9% |
|
Financial Services |
n= 12 |
17% |
83% |
|
Healthcare |
n= 10 |
100% |
0% |
|
Industrials |
n= 14 |
79% |
21% |
|
Insurance |
n= 11 |
45% |
55% |
|
IT |
n= 12 |
75% |
25% |
|
Pharma |
n= 10 |
60% |
40% |
|
Total |
n= 97 |
71% |
29% |
Performance Metrics
In most goal attainment plans, awards are earned based on corporate performance related to two or three metrics. While the metrics vary by industry, some of the most common metrics are revenue and profitability. These metrics are popular because they are indicators of financial health to the investment community. From an internal perspective, revenue and profitability are simple to understand and in the “line of sight” for most executives in that the correlation can be seen between actions/decisions and results. From an external perspective, most shareholders would support an above target payout for executives who are driving top-line growth while maintaining or expanding margins.
|
# of Metrics Used in Goal Attainment Plan |
||||
|
Industry |
1 Metric |
2 Metrics |
3 Metrics |
4+ Metrics |
|
Auto |
0% |
43% |
57% |
0% |
|
Consumer Discretionary |
33% |
22% |
45% |
0% |
|
Consumer Staples |
20% |
40% |
10% |
30% |
|
Financial Services |
0% |
50% |
50% |
0% |
|
Healthcare |
20% |
50% |
20% |
10% |
|
Industrials |
27% |
55% |
9% |
9% |
|
Insurance |
0% |
40% |
40% |
20% |
|
IT |
11% |
22% |
56% |
11% |
|
Pharma |
0% |
0% |
50% |
50% |
|
Total |
16% |
36% |
33% |
15% |
Pay and Performance Scales
At companies with goal attainment plans, Compensation Committees must annually approve minimum, target and maximum goals and corresponding payout levels, for each metric in the incentive plan. Among companies included in our research, the most prevalent payout scale awarded executives 50% of target for threshold performance and 200% of target for maximum performance. Companies most often structure payout scales so that executives will earn 100% of their target annual incentive award for target performance and the actual payout is interpolated between threshold and target and target and maximum.
Annual Incentive Plan Payouts Relative to Goals
All Companies
Based on CAP’s review of annual incentive payouts, companies achieve threshold performance goals 90% of time. Annual incentive payouts most often fall between target and maximum. Companies’ annual incentive plans pay at this level 48% of the time or approximately one out of every two years. Executives earn bonuses in the range of threshold to target about 20% of the time, roughly once in every five years. Approximately 10% of the time, companies do not achieve threshold and executives do not earn a bonus. Payouts for the total sample are distributed as indicated in the following charts:
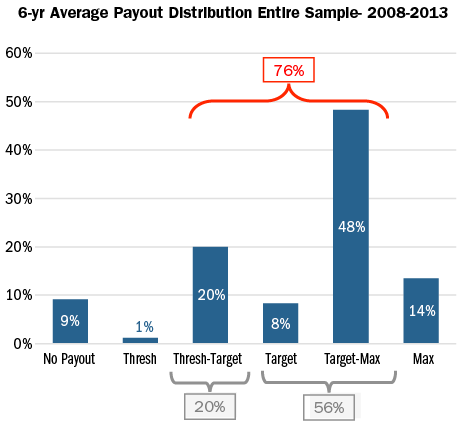
This analysis of the payout distribution is helpful in defining the degree of difficulty, or “stretch”, embedded in performance goals. Our analysis can be summarized with the following rule of thumb where Compensation Committees structure annual bonus performance goals with:
- A 90% chance of achieving Threshold performance
- A 70% chance of achieving Target performance
- A 15% chance of achieving Maximum performance
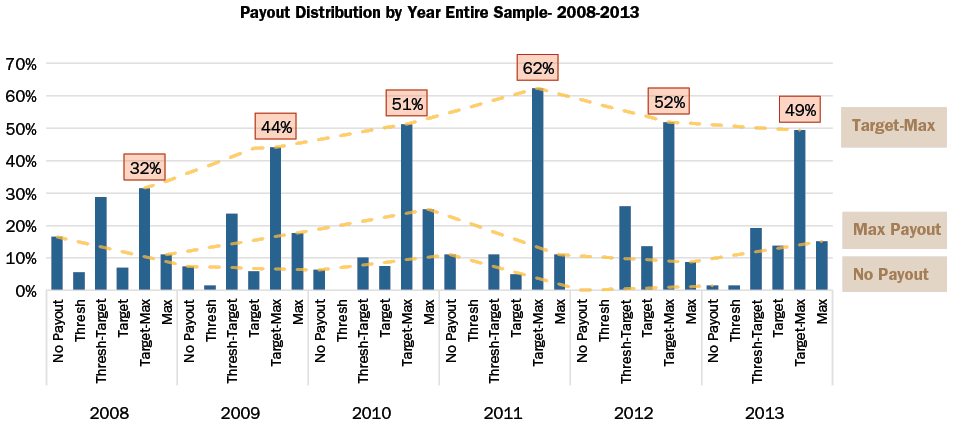
When the payout distributions are reviewed by year, the percentage of companies that paid target to maximum steadily increased from 2008-2011. This reflects an improvement in the overall economy since the financial crisis in 2008 as well as a greater ability to forecast performance in a more stable environment.
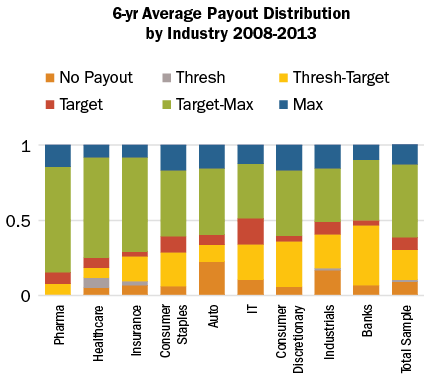
By Industry
While historical payout levels vary by industry, all industries, on average, have most frequently paid bonuses between target and maximum. The Auto and Industrials industries are notable outliers in that executives received zero payouts once in every four years and once in every five years, respectively, likely indicative of industry dynamics and macro-economic conditions more than overly rigorous goal setting. Most cases when Auto companies did not pay annual incentives occurred in 2008, the peak of the financial crisis. Average payouts for each industry are distributed as indicated in the following chart:
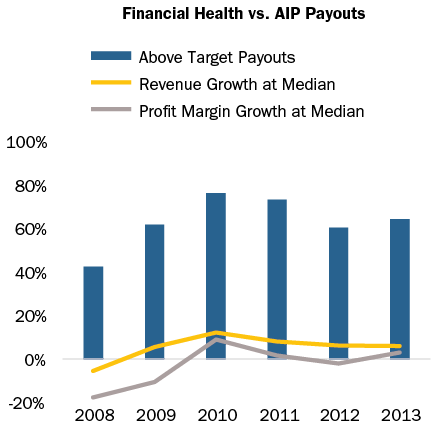
Relative to Performance
Over the past 6 years, the number of above target annual incentive payouts in a given year has generally tracked revenue growth and profit margin growth in the same year. In particular, payouts at Industrial and Pharmaceutical companies have aligned directionally with revenue and profit margin growth. This pay and performance relationship is key to aligning executives’ interests with those of shareholders. If the company exceeds anticipated performance, executives will earn above target payout levels without contest from internal or external stakeholders; however, if an executive is able to achieve extraordinary levels of pay without extraordinary performance, Committees risk facing opposition from shareholders and proxy advisory firms.
The chart below depicts the relationship between median revenue and profit margin growth and above target annual incentive payouts.
Conclusion
Threshold and target annual incentive performance goals are intended to be challenging but attainable. Maximum performance goals are meant to be attained only when executives achieve exceptional performance, exceeding internal/external expectations. Our study supports the formulation of a general rule of thumb, based on analysis of the past 6 years, where the degree of difficulty, or “stretch”, embedded in performance goals translates to:
- A 90% chance of achieving Threshold performance;
- A 70% chance of achieving Target performance; and
- A 15% chance of achieving Maximum performance.
This distribution indicates that Compensation Committees have built an appropriate degree of stretch into annual incentive plans overall.
We believe that when Committees set performance goals, they are influenced by prior year performance as well as economic and industry outlooks. Yet when measuring the directional trend over the past six years, we believe that Compensation Committees are adequately aligning internal performance goals with incentive payout objectives, and developing rational stretch above and below target — thus striking the right balance between the size and frequency of annual incentive payouts.
Methodology
Compensation Advisory Partners (“CAP”) reviewed the annual incentive plan designs of approximately 100 large companies representing a cross-section of industries. The companies included in this study have median revenues of $33 billion, a median market cap of $52 billion and a median 6-year total shareholder return of 9%, through year end 2013.
CAP analyzed the annual incentive plan payouts of the companies in the sample over the past 6 years to determine the distribution of incentive payments and the frequency with which executives typically achieve target payouts. In this analysis, CAP categorized actual bonus payments (as a percent of target) into one of six categories based on payout ranges as depicted in the following chart:
|
Payout Category |
Payout Range |
|
No Payout |
0% |
|
Threshold |
Up to 5% above Threshold |
|
Threshold – Target |
5% above Threshold to 5% below Target |
|
Target |
+/- 5% of Target |
|
Target – Max |
5% above Target to 5% below Max |
|
Max |
5% below Max to Max |


