HIGHLIGHTS
- Most large public companies have maintained consistent approaches to delivering annual incentives to their executive leadership teams.
- We frequently see minor adjustments to annual incentive plan designs — most often modifying performance measures – rather than wholesale change.
- Most companies use multiple measures to ensure the annual incentive plan provides balance and aligns with overall business strategy.
- Median CEO annual target bonuses increased 10 percentage points to 170% of salary in 2014.
- In contrast, CFO annual target bonuses remained the same at 100% of salary.
- Overall, 2014 annual incentive payouts were slightly lower than in 2013.
CHANGES IN ANNUAL INCENTIVE PLAN DESIGN
32% of companies in CAP’s database changed their annual incentive plan design in 2014 or 2015. The most common changes were modifications to the performance metrics used to fund awards and increases to the target award opportunities offered to the CEO or CFO. Another common change was to adjust the weightings/mix applicable to performance metrics. These changes, as well as other modifications shown in the chart below, illustrate that companies continue to review and enhance the pay-for-performance relationship through changes to the annual incentive program.
|
Type of Change Reported in CD&A |
2014 No. of Cos. |
% of Cos. Reporting Changes |
||
|
2014 (n = 32) |
2013 (n = 34) |
2012 (n = 37) |
||
|
Change in performance metrics used to fund awards |
16 |
50% |
47% |
43% |
|
Increased/Reduced target award opportunities (CEO and/or CFO) |
12 |
38% |
32% |
11% |
|
Change in performance metric weighting/mix |
5 |
16% |
32% |
35% |
|
Change in maximum award payout |
4 |
13% |
9% |
8% |
|
Other changes |
3 |
9% |
12% |
22% |
Note: Due to multiple changes, does not add up to 100%.
Modifications to Performance Metrics
Among the companies that changed the performance metrics used for annual incentives, the most common approaches were to either maintain the same number of metrics or reduce the number of metrics. This avoids adding complexity to annual incentive while allowing for better alignment of pay with performance:
- Six (6) companies kept the total number of metrics the same, but replaced a metric;
- Six (6) companies reduced the number of metrics; and
- Four (4) companies added metrics to the current plan.
Changes made by many companies were done so to better align incentives with their business strategy:
- Bristol-Myers Squibb: Added a new pipeline metric as a measure to highlight the importance of pipeline delivery to the near-term and long-term success of the company.
- Intel: Moved from a single set of company-wide operational goals to business-unit-specific operational goals – significantly reducing the number of performance goals, in order to drive a sharper focus on key strategic initiatives, increase visibility into those initiatives, and enhance accountability.
- Verizon Communications: Consistent with Verizon’s strategic plan, adjusted the weightings of the financial measures from 2013 to place a greater emphasis on free cash flow, given the importance of cash generation and debt reduction following the acquisition of sole ownership of Verizon Wireless. In addition, a sustainability measure was introduced, reflecting Verizon’s commitment to reducing the environmental impact of its operations.
Increases in Target Bonus Opportunity
CAP’s database tracks the size of target annual bonus awards for both CEOs and CFOs. When we looked across all industries in 2014, we found that the median target bonus opportunity increased for CEOs by 10 percentage points to 170% of salary. By industry, the largest increase we saw was in Automotive, where CEO target bonus awards increased by 15 percentage points. Significantly, none of our industry groups registered a decline in CEO target annual bonuses, although Financial Services do not typically define target bonuses.
When we looked across all industries at CFO target bonus opportunities, we saw no change year-over-year. The median target bonus for CFOs remained the same at 100% of salary. By industry, Technology CFOs saw the greatest increase (25 percentage points). Across other industries, median target CEO/CFO bonus increases were generally between 0 and 10 percentage points. Similar to the CEO data, no industry group saw a decline in CFO annual bonus targets.
|
Industry |
Median Target Bonus as a % of Salary |
|||
|
CEO |
CFO |
|||
|
2014 |
2013 |
2014 |
2013 |
|
|
Automotive |
150% |
135% |
95% |
85% |
|
Consumer Goods |
165% |
160% |
100% |
93% |
|
Financial Services |
n/m |
n/m |
n/m |
n/m |
|
Health Care |
150% |
150% |
100% |
100% |
|
Insurance |
210% |
200% |
125% |
120% |
|
Manufacturing |
153% |
147% |
90% |
88% |
|
Pharmaceutical |
150% |
150% |
100% |
98% |
|
Retail |
200% |
200% |
125% |
125% |
|
Technology |
220% |
210% |
150% |
125% |
|
Total Sample |
170% |
160% |
100% |
100% |
Note: Companies among all industries that did not disclose target bonus opportunities were excluded from both the 2013 and 2014 target bonus analysis. Financial Services industry is excluded since most companies in our study do not disclose target bonus opportunities for the Named Executive Officers.
ANNUAL INCENTIVE PLAN DESIGN PRACTICES
Award Leverage
CAP reviewed proxy disclosure to understand how companies are establishing the payout range (i.e., the threshold payout and the maximum payout expressed as a percentage of the target payout) for annual incentives. Most companies that we reviewed identify the minimum payout as zero and do not separately disclose a threshold level of performance. For the 37 companies that did disclose a threshold bonus payout, a payout of 50% of target is the most common percentage. Twenty companies, however, disclose a minimum bonus payout of less than 50% of target which scales down to 25% or lower.
Approximately 75% of companies disclose the maximum bonus opportunity. A majority of companies in our sample (60%) have a maximum bonus opportunity of 200% of target bonus. Ten (10) companies have a maximum bonus of 250% of target or higher. Most of these companies are in the Consumer Goods, Pharmaceutical, and Technology industries.
|
Threshold Payout as a % of Target (n = 37) |
||
|
Range |
# of Cos. |
% of Cos. |
|
< 25% |
10 |
27% |
|
> 25% < 50% |
10 |
27% |
|
50% |
13 |
35% |
|
> 75% < 100% |
4 |
11% |
|
Maximum Payout as a % of Target (n = 73) |
||
|
Range |
# of Cos. |
% of Cos. |
|
> 125% < 150% |
2 |
3% |
|
> 150% < 200% |
14 |
19% |
|
200% |
44 |
60% |
|
> 200% < 250% |
3 |
4% |
|
> 250% |
10 |
14% |
Annual Incentive Plan Metrics
EPS, Revenue, Cash Flow and Operating Income are the most common metrics used in annual incentive plans. Similar to last year, our findings suggest that EPS is used more broadly across industries while Revenue tends to be used in consumer-driven industries.
Most companies use multiple performance metrics in the annual incentive plan. 33% of companies disclose using two (2) metrics, 31% use three (3) metrics, and 16% use four (4) or more metrics.
The use of multiple performance metrics allows for annual incentive payouts to be tied more closely to overall company performance. For example, companies using bottom-line measures in the annual incentive plan will often also include top-line measures for balance. Among CAP’s sample, 36% of “multiple-metric” companies that use a measure of profit (EPS, Operating Income, etc.) also use Revenue.
In addition to financial measures, approximately 15% of companies disclose using non-financial measures in their annual incentive plans such as talent, culture, and diversity initiatives. 55% of companies disclose that individual performance considerations impact annual incentive payouts.
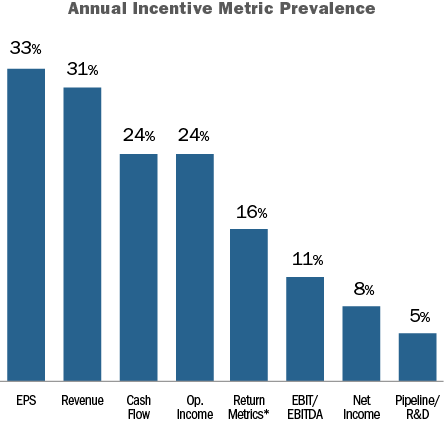
*Return metrics include: ROE, ROA, and ROI/ROIC.
The chart below shows the three (3) most common metrics by industry in 2014:
|
Industry |
Metric #1 |
Metric #2 |
Metric #3 |
|
Automotive |
Cash Flow (45%) |
EBIT (45%) |
ROA (27%) |
|
Consumer Goods |
Revenue (67%) |
EPS (58%) |
Cash Flow (33%) |
|
Financial Services |
EPS (33%) |
ROE (17%) |
Op. Income (8%) |
|
Health Care |
EPS (40%) |
Op. Income (30%) |
EBIT (30%) |
|
Insurance |
Op. Income (46%) |
Op. ROE (23%) |
Op. EPS (15%) |
|
Manufacturing |
Cash Flow (30%) |
EPS (30%) |
Revenue (20%) |
|
Pharmaceuticals |
Revenue (70%) |
EPS (70%) |
Pipeline/R&D (50%) |
|
Retail |
Revenue (40%) |
Op. Income (40%) |
EBIT (30%) |
|
Technology |
Revenue (58%) |
Cash Flow (50%) |
Op. Income (33%) |
Note: Percentages reflect the prevalence of companies disclosing the metric.
2014 Actual Bonus Payouts
Nearly all companies (94%) awarded bonuses to their CEO for 2014 performance. Three companies did not pay a bonus to the CEO as a result of company performance: Coca-Cola, McDonalds, and Target.
Overall, the median CEO bonus payout was 114% of target (or 225% of salary, at median). Across industries, bonuses for Pharmaceutical CEOs exceeded target by the greatest amount (146% of target, at median). 3 of the 9 industries CAP surveyed had a median bonus payout of less than 100%: Retail (82%), Consumer Goods (92%), and Technology (95%).
|
Industry |
Bonus Payout at a Percent of Target |
|||||
|
75th Percentile |
Median |
25th Percentile |
||||
|
2014 |
2013 |
2014 |
2013 |
2014 |
2013 |
|
|
Automotive |
146% |
183% |
122% |
165% |
103% |
120% |
|
Consumer Goods |
148% |
133% |
92% |
112% |
33% |
70% |
|
Financial Services |
124% |
142% |
112% |
126% |
97% |
102% |
|
Health Care |
149% |
149% |
124% |
127% |
108% |
116% |
|
Insurance |
139% |
170% |
132% |
150% |
110% |
123% |
|
Manufacturing |
155% |
119% |
115% |
111% |
98% |
98% |
|
Pharmaceutical |
173% |
158% |
146% |
138% |
118% |
122% |
|
Retail |
100% |
119% |
82% |
78% |
75% |
68% |
|
Technology |
127% |
121% |
95% |
88% |
86% |
69% |
|
Total Sample |
145% |
150% |
114% |
122% |
95% |
95% |
Note: Most companies in the Financial Services industry do not disclose a target bonus for the CEO. For these companies, 3-year average actual bonus was used as a proxy for target bonus.
Conclusion
In our experience, most companies strive to achieve the following with regard to annual incentive plan design:
- Alignment with the company’s business plan
- A balanced portfolio of performance metrics
- An appropriate mix of corporate versus business unit / strategic performance considerations
- The proper amount of structured discretion and/or individual performance
These objectives can be achieved by continuing to assess plan design in relation to strategy and making minor modifications, such as changes to performance metrics and their weightings, as necessary. Short of a major economic shift or regulatory change, we expect to see only modest changes to annual incentive plan designs.
In our experience, “activist investors” were more vocal and influential in boardrooms during 2015 than during other recent years. As a result, Compensation Advisory Partners (“CAP”) analyzed circumstances at nine companies that had proxy contests in 20151 where in each case, one area of activist focus was executive compensation. We found that executive compensation issues were often supportive and complimentary to other, larger internal issues at the target companies. While these activists may have targeted executive compensation, this was not the main driver in engaging with the company. Activist complaints tend be more focused on strategic/financial issues and they use compensation as a point of discussion to identify where their views differ. For example, if return on capital is not a utilized metric in incentive plans and the company has completed several low return acquisitions, the activist may use this as support that strategy is flawed and that compensation reinforces that flaw.
“Activist investors” are individuals (i.e. hedge fund managers) or groups (i.e. alternative investment companies) who purchase a stake in a target company’s outstanding equity shares with the end-goal of influencing company decision making by acquiring seats on the Board of Directors. Once on the Board, activists will try to effect changes (i.e., by divesting or acquiring a business segment, cutting expenses, increasing distributions to shareholders, etc.) that ultimately increase the company’s value and the value of the activist’s investment.
What We Found
Compared to prior years, 2015 saw an increase in proxy contests. Among companies in the Russell 3000 Index, there were 20 proxy contests initiated by activist investors during 2015. This compares to 14 proxy contests in 2014 and 16 in 2013.
Of the 20 proxy contests initiated by activist investors in 2015, nine (45 percent) specifically took issue with the executive compensation program at the target company. In each case, “issues” with executive compensation were a part of the supporting statements for the dissident slate of directors. This is a stark contrast to 2014 and 2013, where 4 (29 percent) and 1 (6 percent) proxy contests took issue with executive compensation, respectively.
Specific compensation practices highlighted in 2015 include:
|
Executive Compensation Issue |
Number of Companies (n=9) |
Percentage of Companies |
|
Pay for Performance Misalignment |
7 |
78% |
|
High CEO Compensation |
4 |
44% |
|
Choice of / Adjustments to Performance Metrics |
4 |
44% |
|
Weak Corporate Governance Structure |
3 |
33% |
|
High / Increase to Board of Director Compensation |
3 |
33% |
|
Awards of Special Grants to Executives |
2 |
22% |
|
Outsized Peers |
1 |
11% |
Ultimately, we found that activist investors frequently use executive compensation and pay for performance disconnect as levers to bolster their argument for receiving seats on the target company’s Board of Directors.
Target Companies
Of the nine activist campaigns which specifically took issue with executive compensation practices, the companies that were being targeted generally had lagging TSR performance, both in absolute terms and relative to competitors. Further, low Say on Pay results in 2014 also provided activists with an additional reason for targeting certain companies.
As the below table demonstrates, where activists were successful in securing Board seats, the most recent Say on Pay support was generally low and either the company’s 1-year TSR, 3-year TSR, or both were relatively low.
Successful Activist Campaigns
Of the nine proxy contests that specifically targeted aspects of executive compensation, four ultimately resulted in the activist investor gaining Board seats at the target company. The four companies, which are noted in the chart below, include: Myers Industries, Imation Corp., The Children’s Place2 and Shutterfly, Inc.
The main common denominator, from a compensation perspective, among the successful activist campaigns was a perceived disconnect between executive pay and financial performance at the target company. More specifically, at Myers, Imation and The Children’s Place, the activists were able to show that, despite poor TSR (in both absolute and relative terms), the executives at these companies were still being rewarded either through salary increases, above target annual incentive payouts or equity grants.
|
Company Name |
Say on Pay Results |
Total Shareholder Return |
|||
|
2013 |
2014 |
2015 (Year of Proxy Contest) |
1 Year * |
3 Year CAGR * |
|
|
Activist Gained Board Seat (n=4) |
|||||
|
Myers Industries Inc. |
75% |
75% |
60% |
-17.8% |
12.6% |
|
Imation Corp. |
95% |
50% |
34% |
-17.8% |
-12.9% |
|
The Children's Place, Inc. |
17% |
61% |
94% |
13.8% |
6.3% |
|
Shutterfly, Inc. |
55% |
50% |
22% |
-18.3% |
22.4% |
|
Activist Did Not Gain Board Seat (n=5) |
|||||
|
Hill International, Inc. |
n/a (triennial) |
54% |
n/a (triennial) |
-0.3% |
-9.3% |
|
Ethan Allen Interiors Inc. |
86% |
92% |
80% |
-14.1% |
5.1% |
|
E. I. du Pont de Nemours and Company |
95% |
98% |
96% |
14.4% |
17.3% |
|
Biglari Holdings Inc. |
33% |
31% |
50% |
-21.7% |
2.8% |
|
Select Comfort Corporation |
98% |
93% |
96% |
26.9% |
6.7% |
* As of Fiscal Year End
Further, with regard to Shutterfly’s executive compensation program, activists made the case that executives were being rewarded for performance against metrics that were not “shareholder friendly” (i.e. metrics focusing on top line growth as opposed to earnings growth). In response to the activist criticism, Shutterfly’s Compensation Committee established several changes to their 2015 and 2016 executive compensation program performance targets to “further reflect shareholders views”. However, the lead activist investor (Marathon Partners) ultimately deemed these changes inadequate and requested further, more fundamental, adjustments to the entirety of the compensation program, namely, to begin prioritizing profit over scale.
It is not surprising that activist investors are most successful at winning Board seats at their target companies when they can tie executive compensation to the poor financial performance of the company. If shareholders are not realizing a desired return on their investment in any given company, it is reasonable to expect that they would show more support for an activist investor hoping to gain access to the target’s Board if it could potentially lead to financial improvement. When executive compensation can be tied to poor financial results, it simply provides activists, and shareholders alike, with another reason as to why a shift in leadership could be desirable or change in strategy could be advisable (e.g. CEO change).
ISS also tends to influence the outcome of these proxy contests. ISS supported at least one of the nominees on the dissident slate of directors at each of the four companies that lost at least one Board seat to the activist investor.
Ultimately, of the four companies who lost Board seats to activist investors, three companies (Imation Corp., Myers Industry and Shutterfly) have made changes to their executive leadership teams as these CEOs have stepped down. Further, while DuPont was able to win its proxy contest and keep dissident nominees off of its Board, five months after the Annual Meeting, the CEO announced her retirement.
Conclusion
We are seeing increased activity where activist investors are accumulating stakes in companies with the intention of agitating for change. Their hope is to make changes that will enhance the company’s value. While our analysis reflected proxy contests specifically focusing on executive pay (e.g. pay for performance misalignment), there are a number of circumstances where companies settle with the activist investors, avoiding a contentious public battle, and allow the activist a seat or multiple seats on the Board. Some examples include Baxter International settling with Third Point LLC, Freeport McMoRan settling with Icahn Enterprises and Citrix Systems settling with Elliott Management.
In order to be well positioned, Boards and Compensation Committees should be proactive:
- Ensure the Company and Board have a clear strategic focus and stick to it
- Make sure the metrics used in incentive plans align with the company’s strategic vision
- Confirm the Board has a game plan for shareholder and activist engagement
- Encourage the Company and Board to use external advisors to provide guidance
- Highlight company performance against goals
- Emphasize pay for performance relationship through the validation of relative performance and pay positioning
- Proactively seek feedback from shareholders throughout the year
- Assess program features which may not have a lot of value to executives but are viewed as problematic pay practices (i.e., eliminate excise tax gross-up, eliminate / reduce perquisites, move from single to double trigger equity vesting in the event of a change in control)
It is critical for the Board to work with management to ensure pay practices are defensible and supportable in light of company performance and good governance standards.
Appendix
Summary of Activist Campaigns
|
Company |
Activist |
Executive Compensation Issue Highlighted By Activist |
Contest Result |
|
Hill International, Inc. Program and project management company |
Bulldog Investors, LLC ISS supported both dissident director nominees |
|
No dissident nominees elected to the Board |
|
Ethan Allen Interiors International interior design and manufacturing company |
Sandell Asset Management Corp ISS supported 3 of 6 dissident director nominees |
|
No dissident nominees elected to the Board |
|
E.I. Du Pont International science and technology company |
Trian Fund Management ISS supported 2 of 4 dissident director nominees |
|
No dissident nominees elected to the Board CEO stepped down 5 months after the conclusion of the contest |
|
Biglari Holdings Owns and operates Steak N’ Shake |
Groveland Capital ISS did not support dissident director nominees |
|
No dissident nominees elected to the Board |
|
Myers Industries International manufacturing and distribution company |
GAMCO Asset Management ISS supported 1 of 3 dissident director nominees |
|
Three dissident nominees elected to the Board CEO stepped down |
|
Imation Corp. Data storage and information security company |
Clinton Group ISS supported all dissident director nominees |
|
Three dissident nominees elected to the Board CEO stepped down |
|
Select Comfort Corporation Designer, manufacturer, retailer and services of a Sleep Number beds |
Blue Clay Capital ISS did not support dissident director nominees |
|
Activist dropped proxy contest before it went to shareholder vote |
|
The Children’s Place (settled proxy fights prior to Annual Meeting) Children’s specialty apparel retailer |
Macellum Advisors GP and Barington Capital Group ISS supported 1 of 2 dissident director nominees |
|
Settled prior to contest – activist received one Board seat |
|
Shutterfly, Inc. Manufacturer and retailer of photo-based products |
Marathon Partners ISS supported 2 of 3 dissident director nominees |
|
Two dissident nominees elected to the Board CEO stepped down |
Note: The comments in the above chart are paraphrased or direct quotes from activist investors’ proxy contest materials/filings and do not reflect the view of CAP.
ISS released their finalized 2016 policy changes, which are consistent with the proposed changes previously announced. The changes are relatively minor and the key changes are related to
- Director Overboarding
- Negative director election vote recommendations for directors that have taken unilateral board actions
- Proxy Access
- Compensation-related votes at externally-managed issuers and Shareholder Proposals related to equity retention
- Shareholder Proposals: Hold Equity Past Retirement or for a Significant Period of Time
The changes are as follows:
- Director Overboarding
- Previously, ISS recommended an “Against” or “Withhold” for a director if the director sits on more than 6 public company boards or 2 public company boards for the CEO (besides their own for CEOs)
- ISS changed the threshold to 5 for a regular board member and made no changes for CEOs, though they did propose reducing the CEO threshold to 1 in the draft guidelines
- This change will be in effect for meetings on or after Feb. 1, 2017
- Negative director election vote recommendations for directors that have taken unilateral board actions
- ISS clarified that it will generally issue “Against” vote recommendations for directors, committee members or entire board for bylaws amendments, without shareholder approval, calling to classify the board or introducing supermajority vote requirements (policy will also apply if directors amended the bylaws immediately prior to an IPO)
- Negative vote recommendations will be issued until the unilateral reduction is reversed or approved by a shareholders vote
- Proxy Access
- ISS clarified current policy that vote recommendations for directors nominated using proxy access will be evaluated using similar criteria to those used in proxy contests
- Compensation-related votes at externally-managed issuers
- ISS will generally recommend “Against” say-on-pay proposals if there is insufficient disclosure for ISS to perform a comprehensive pay-for-performance analysis [limited situations and often impacts externally managed issuers like REITs]
- Sharholder Proposals: Hold Equity Past Retirement or for a Significant Period of Time
- ISS has broadened the policy to encompass executive retention proposals more generally, eliminating the need for a separate policy covering the proposals seeking retention of 75% of net shares
- The proposed retention ratio and required duration of retention are just some of the several factors that ISS will consider in its case-by-case analysis
For further details on the updated policies for 2016, please visit https://www.issgovernance.com/file/policy/2016-americas-policy-updates.pdf
Key CAP Findings
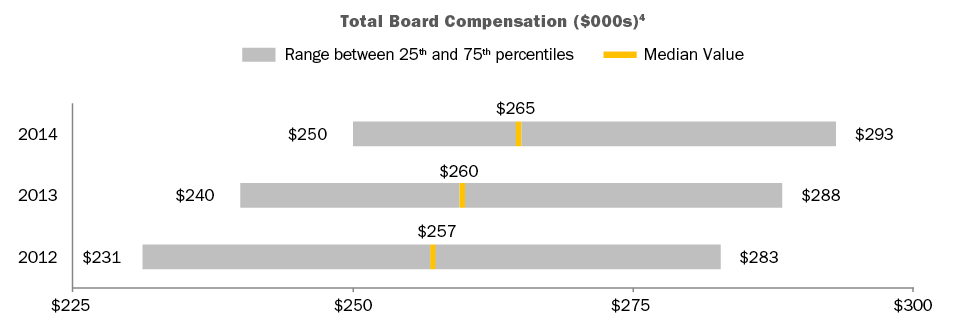
Board Compensation. little/no change
- Total Fees. Generally flat year-over-year (median is $265K, versus $260K in prior year).
- Retainers. Large companies rely on annual retainers (cash and equity) to compensate directors. Pay programs are typically simple and viewed more as an “advisory fee” than an “attendance fee.”
- Meeting fees. Provided by only 12 percent of companies (versus 15 percent in prior year). In general, companies have moved to a fixed retainer pay structure, with a component in cash and a component in equity.
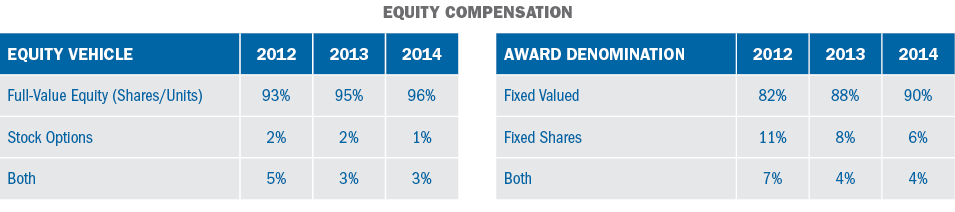
- Equity. Full-value awards (shares/units) are most common and only four percent of companies use stock options. 94 percent of companies denominate equity awards (stock or options) as a fixed value, versus a fixed number of shares which is considered best practice as it manages the value each year.
- Pay Mix. On average, 58 percent equity-based vs. 42 percent cash-based. Alignment with long-term shareholders is reinforced by delivering a majority of compensation in equity.
Committee Member Compensation. little/no change
- Overall Prevalence. 45 percent of companies paid committee-specific member fees1.
- Total Fees. Among companies paying committee member fees, the median is $15.5K.
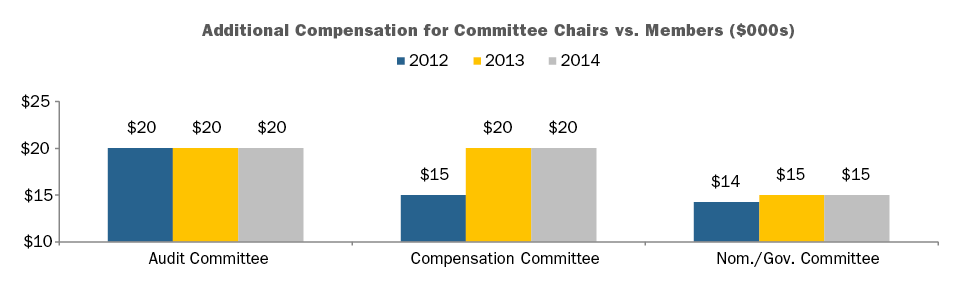
Committee Chair Compensation. little/no change
- Overall Prevalence. Approximately 90 percent of companies provide additional compensation to committee Chairs, typically through an additional retainer, to recognize additional time requirements, responsibilities, and reputational risk.
- Fees. At median, $20K in additional compensation (vs. members) was provided to Audit and Compensation Committee Chairs, and $15K additional to Nominating/Governance Committee Chairs.
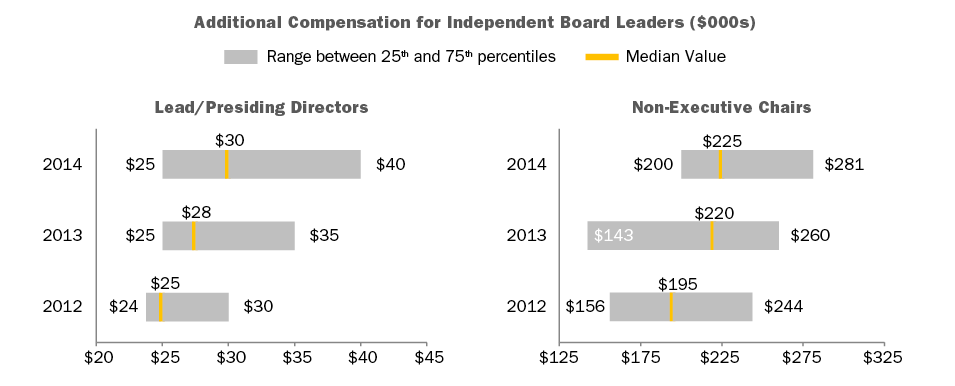
Independent Board Leader Compensation. little/no change
- Non-Exec Chair. Additional compensation is provided by all companies with this role, $225K at median. As a multiple of total Board Compensation, total Board Chair pay is 1.84x a standard Board member, at median.
- Lead Director. Additional compensation – $30K, at median – is provided by nearly all companies with this role2. The differential in pay versus non-executive Chairs is in line with typical differences in responsibilities. Median additional compensation was flat – $25K – for the five years prior to 2013 (median in 2013 was $28K).
Perquisites. little/no change
- Prevalence. Overall, limited use. One-third of companies provide gift matching/charitable contribution.
Pay Limits. little/no change
- 21 percent of companies that amended or adopted new equity plans in 2015 implemented specific limits for director compensation. In total, 27 percent of Fortune 100 companies now have such limits.
CAP Perspective
Board Pay Levels and Structure
We believe director compensation has leveled off – for the time being – and expect to see only modest increases in the next year.
In terms of pay program, fixed retainer structures are now the norm and meeting fees – already minority practice – continue to decline in prevalence as director compensation is now often viewed more as an “advisory fee” than an “attendance fee.”
Director Pay Limits
A number of companies have implemented limits on director compensation. The limits are largely due to advancement of litigation in Delaware court where the issue has been that directors approve their own annual compensation, and the shareholder approved long-term incentive plan did not provide “meaningful limits” on the maximum award that could be granted to a director.
Currently, 27 percent of companies studied (vs. 23 percent in prior year) have included limits for non-employee director compensation in their shareholder approved long-term incentive plan. These limits range from $250K to $3.5 million, $770K at median (vs. $800K in prior year), and typically apply to just equity-based compensation. Some companies have applied the limits to both cash and equity-based compensation, while others have excluded initial at-election equity awards, committee Chair pay, and/or additional pay for Board leadership roles from the limit.
We expect director pay limits to become majority practice within the next few years.
Lead Director Compensation
The Lead Director role has evolved, especially in companies where the CEO and Chairman roles are combined. For example, Boards are engaging in more outreach and meeting with shareholders to talk about governance practices, CEO succession and executive compensation, among other issues, and many investors want to hear from the Lead Director. Nearly all companies studied now provide additional compensation for the Lead Director role.3 However, additional compensation provided for the Lead Director role continues to be quite different than the non-executive Chair role. At median, an additional $30K was provided for the Lead Director role, versus $225K for the non-executive Chair role. The differential in pay is generally in line with typical differences in responsibilities.
Providing additional compensation to the Lead Director sends a signal to investors regarding expectations for the role, including time commitment, responsibilities, and authority. Many times, companies have been able to settle (or argue against) shareholder proposals to split the CEO and Chairman roles by instituting (or emphasizing) a strong Lead Director role and delineating the specific responsibilities of the position. Boards can also reassure investors concerned about overall governance practices at a company by increasing Lead Director responsibilities.
Best in Class Director Compensation Process & Practices
|
Best in Class PROCESS |
|
|
Best in Class PRACTICES |
|
Appendix
1 Audit, Compensation and/or Nominating and Governance committee members.
2 Excludes controlled companies. Also excludes instances where Lead Director role is assumed by Chair of Nominating and Governance Committee, who receives compensation for that role.
3 Excludes controlled companies. Also excludes instances where Lead Director role is assumed by Chair of Nominating and Governance Committee, who receives compensation for that role
4 Total Board Compensation reflects all cash and equity compensation for Board and committee service, excluding compensation for leadership roles such as committee Chair, Lead/Presiding Director, or non-executive Board Chair.
- Perquisites represent only a small portion of the total pay program for a CEO or CFO. However, perquisite based pay is – and we expect will continue to be – highly scrutinized
- In 2014 83% of companies provided perquisites to their CEO, and 81% of companies provided perquisites to their CFO
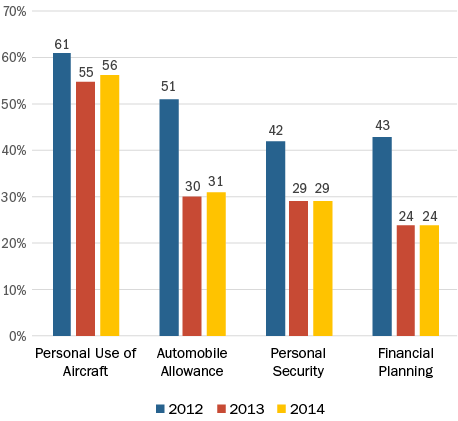
- The four most common CEO/CFO perquisites in 2014 were: personal use of corporate aircraft, auto allowance, personal security and financial planning
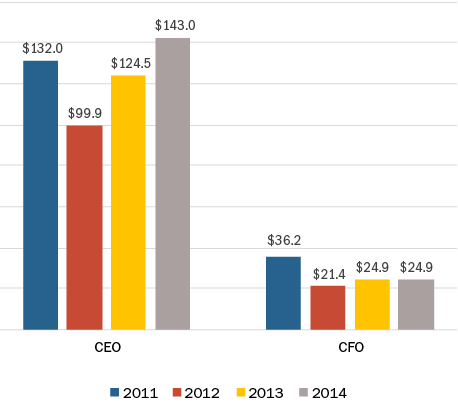
- The median value of total perquisites provided to CEOs increased by approximately 15% to $143,000 in 2014, and was flat at approximately $25,000 for CFOs
Our Survey Sample
Compensation Advisory Partners (“CAP”) reviewed 2015 proxy disclosures at a sample of 100 companies among the Fortune 500, representing nine industry groups. Industry groups included: Automotive, Consumer Goods, Financial Services, Health Care, Insurance, Manufacturing, Pharmaceutical, Retail, and Technology. For the companies studied, the median revenue size and market capitalization was $34 billion and $56 billion respectively.
What We Found
The percentage of companies in our research sample providing perquisites to their CEO stayed constant at 83% from 2013 to 2014. The percentage of companies providing perquisites to CFOs increased 5% from 2013 to 2014 to 81%.
In 2014, the four most common CEO perquisites were: personal use of corporate aircraft (56%), automobile allowance (31%), personal security (29%) and financial planning (24%). While the prevalence of personal use of corporate aircraft was generally flat from 2012 to 2014, the prevalence of automobile allowances, personal security and financial planning decreased sharply (approximately 30– 40%) over the past two years.
CEO Perquisite Prevalence
Although the prevalence of major perquisites remained steady in 2014 for CEOs compared to the prior year, the median total value for CEO perquisites increased 15% to $143,000. This value has ranged from $100,000 to $143,000 over the last four years. In contrast, the median value of perquisites for CFOs was relatively flat year-over-year, and has ranged from $21,000 to $36,000 since 2011.
Median CEO and CFO Perquisites Value ($000s)
Perquisites represent only a small portion of an executive’s total compensation, yet are often highly scrutinized. Shareholders prefer that pay be delivered in performance-based vehicles instead of through perquisites. Over the past few years, a number of companies changed their perquisite programs in reaction to increased shareholder scrutiny and specific feedback received from shareholders or proxy advisory firms. However, given fairly consistent prevalence over the past 2 years, data suggests that changes to company perquisite programs may have leveled off. PNC was the only company making a change to a perquisite program in our sample for 2014, increasing their annual perquisite limit from $10,000 to $20,000 for each NEO, other than for the CEO.
|
Perquisites Change Reported in CD&A |
2014 n=1 |
2013 n=7 |
2012 n=9 |
2011 n=14 |
||||
|
# of Cos. |
# of Cos. |
# of Cos. |
# of Cos. |
# of Cos. |
# of Cos. |
# of Cos. |
# of Cos. |
|
|
Eliminated perquisites |
0 |
0% |
6 |
75% |
2 |
22% |
9 |
56% |
|
Eliminated tax gross-ups on perquisites |
0 |
0% |
1 |
13% |
4 |
44% |
6 |
38% |
|
Reduced perquisite program/value |
0 |
0% |
1 |
13% |
2 |
22% |
1 |
6% |
|
Changed perquisite program |
1 |
100% |
0 |
0% |
1 |
11% |
0 |
0% |
Note: Percentages do not add up to 100% due to multiple changes by companies
Conclusion
While Compensation Committees continue to monitor the appropriateness (and competitiveness) of perquisite programs, as well as dollar values and overall executive usage, the degree to which executive perquisites are provided appears to have leveled off. We expect that companies will continue to closely align executive compensation with shareholder interests by limiting non-performance-based compensation, such as perquisites. We caution that any potential (perceived) misuse of executive perquisites will continue to raise the ire of shareholders and proxy advisory firms and provide for headline news.
Compensation Advisory Partners LLC (“CAP”) appreciates the opportunity to comment on proposed rules for clawbacks. As a leading executive compensation consulting firm, we support sound corporate governance.
Today, the SEC approved the final rules related to pay ratio. Companies will be required to disclose their CEO’s pay as a multiple of the pay of their median employee in their 2017 proxy (released in 2018 for calendar year filers). The SEC issued proposed rules in September 2013 and received over 280,000 comments related to the topic. For further details and thoughts please see our earlier CAPFlashes on the topic (Sept 20, 2013 and April 1, 2015) and look for more details in future CAPflashes.


