CAP is a leading independent consulting firm specializing in executive and director compensation and related corporate governance matters. Our consultants have served as independent adviser to Boards and senior management at many leading companies in the areas of compensation strategy and program design, and share ISS’ interest in promoting sound corporate governance principles.
Management Say-on-Pay Proposals (U.S.)
ISS will vote against advisory votes on executive compensation if there is a perceived misalignment between CEO pay and company performance under the methodology ISS uses for pay-for-performance analysis for companies or the company maintains significant problematic pay practices. ISS is considering the following policy changes for 2013:
- Use a company’s selected peers as an input to its peer group selection methodology, while maintaining an approach that includes company size and market capitalization constraints
- Potentially incorporate a comparison of realized pay to grant date pay as part of the qualitative evaluation of pay-for-performance alignment
- Add pledging of shares as a factor that may lead to negative recommendations under the existing problematic pay practices evaluation
ISS Request for Comment – Peer Group Selection
Are there additional or alternative ways that ISS should use the company’s self-selected peer group to inform its peer group construction?
CAP Perspective: We believe it is a positive step for ISS to expand its formulaic peer selection methodology to better take into account each company’s self-selected, Board approved peer group. By using an 8-digit GICS resolution and incorporating the GICS groups represented in the subject company’s peer group, ISS peer groups will increase the degree of overlap between the ISS peer groups and the subject companies self-selected peer group(s).
We encourage ISS to further acknowledge the importance of pay comparisons that use a subject company’s disclosed peer group. We believe that it is important to use a consistent peer group for both pay benchmarking and for performance comparisons. In contrast, ISS noted that “these peer groups are designed not for pay benchmarking…, but rather to compare pay and company performance.” Further, we believe that understanding of a company’s self-selected peer group is material to understanding each company’s compensation decisions. Given this, we suggest ISS include results of its formulaic pay-for-performance tests (RDA / MOM / PTA) for its peer group side-by-side with each company’s disclosed peer group.
Since company size is highly correlated with levels of executive pay, what is a reasonable size range (revenue/assets) for peer group construction?
CAP Perspective: We agree that ISS’ current screening criteria for revenue/assets (0.45 – 2.1x subject company) is reasonable, but we believe that the current approach continues to be too formulaic. ISS should allow for a limited number of peer companies (e.g., up to 20%) to range up to 3x of subject company revenue/assets, if these companies are in the company disclosed peer group.
Are there additional factors that investors should consider in peer group construction for pay-for-performance evaluation?
CAP Perspective: We believe that more weight should be placed on the subject company’s business model, even if this is done in a qualitative fashion. One of our clients manufactures consumer durable products and the ISS selected peer group is dominated by home-builders. Another client sells luxury branded products and is compared to sellers of undifferentiated low price-point merchandise. The result is a loss of credibility for ISS, since many peer companies are a poor fit in terms of business model.
ISS Request for Comment – Realizable Pay
How would you define realizable pay?
CAP Perspective: ISS currently uses the compensation reported in the annual proxy statement (modifying option grant date values to reflect the full option term, rather than the expected life of the options) for its quantitative pay-for-performance tests. For realizable pay, we suggest the following definition:
- 3-year average cash or cash equivalents, including Salary, any discretionary Bonus, Non-Equity Incentive Compensation (including annual and long-term cash incentive payments), Change in Non-Qualified Deferred Compensation and Pension, and All Other Compensation; each as disclosed in the Summary Compensation Table; plus
- 3-year average intrinsic value of Stock Options granted during the 3 year period, valued based on the ending stock price; plus
- 3-year average value of restricted shares, RSUs and performance share units granted during the 3 year period, each valued based on the ending stock price. If disclosure clearly indicates the number of performance shares actually earned, this value would be used. Otherwise the target number would be incorporated in the calculation.
The resulting value could be compared to “grant date” pay and also relative to other companies. We recognize that this is not a perfect solution, but we believe it reasonably responds to the issue of measuring realizable pay without adding undue complexity to the calculations. For example, the 3-year period corresponds to the disclosure contained in one proxy statement. We acknowledge that 3 years is a relatively short period to assess a stock option with a 10-year term, but believe it to be acceptable since the comparisons are done relative to peer companies measured during the same 3-year period and this value most directly relates to shareholder experience during the performance period being reviewed.
We are pleased that ISS has recognized the trend to focus on realizable pay rather than “grant date” pay when Committees assess a pay-for-performance relationship. However, we are disappointed that ISS only plans to use realizable pay as part of its qualitative assessment, if triggered by below par quantitative results. We urge ISS to make broader changes to its approach, by incorporating realizable pay in the Pay-TSR Alignment (PTA) test. We believe realizable pay should be used in the PTA test since realizable pay is more closely aligned with absolute shareholder returns than a construct where pay reflects the grant date value of stock options and equity awards.
Should stock options be considered based on intrinsic value or Black-Scholes value, and what is the rationale for your choice?
CAP Perspective: When analyzing realizable pay, we urge ISS to consider the intrinsic value of stock options. This directly ties compensation value with performance (in this case TSR / shareholder wealth creation). In contrast, a Black-Scholes value would include valuation related to the time value of money over the remaining term of the option. Moreover, we believe all inputs to the realizable pay analysis should be accessible from compensation amounts disclosed in annual proxy statements. This would not be the case with a Black-Scholes valuation which would require additional calculations and agreement on assumptions for volatility and expected life, among other factors.
What should be an appropriate measurement period for realizable pay? One year, or three years, or five years or others?
CAP Perspective: We believe the appropriate measurement period for realizable pay is three years. This period strikes the right balance between accuracy and efficiency, since it can be calculated with the information provided in a single proxy statement.
ISS Request for Comment – Other
Please feel free to add any additional information or comments on the proposed policy change.
CAP Perspective: We have additional comments that relate to ISS Say on Pay vote recommendations. Outlined below, we describe additional changes that we urge ISS to consider related to: a company’s response to its Say on Pay shareholder support level; how ISS measures TSR for the quantitative CEO pay-for-performance assessment; ISS’ policies around the rigor of performance goals; and how ISS treats multi-year long-term incentive grants.
Board Response to Say-on-Pay Vote
We believe that when a high percentage of shareholders, for example, 90% or more, support a pay program, little or no year-over-year change should be expected. Therefore, we urge ISS to add to its qualitative assessment of the pay-for-performance relationship a review of prior shareholder support for the Say on Pay resolution. Given 90+% shareholder support and no substantial program changes year-over-year, ISS should recommend shareholders support a Say on Pay resolution in the subsequent year.
Alternatively, when a company receives less than 70% shareholder support for Say on Pay and pay program change is expected by ISS, we urge ISS to recognize the typical compensation program decision making calendar. For example, when Compensation Committees make final executive compensation program design decisions for the upcoming year, usually in the first quarter, they will not yet have results of the Say on Pay vote. In these instances, we urge ISS to focus on changes to compensation program design that will occur the following year as disclosed in the text of the CD&A, rather than Summary Compensation Table disclosure that reflects actions taken prior to knowledge of Say on Pay support level.
TSR Measurement
In line with the methodology used for SVT calculations, we urge ISS to use an average stock price at the beginning and end points of the TSR calculations used in its pay-for-performance test. Use of a 20 trading day average stock price would limit the impact of very short-term price fluctuations on the results.
Performance Goals – Evaluation of “Rigor”
ISS reviews the rigor of performance goals in its qualitative pay-for-performance assessment. It would be helpful to better understand the parameters for this assessment.
Multi-year Long-term Grants
When recruiting new CEOs, companies often grant long-term incentives that are intended to make up for compensation forfeited from a previous employer (often called “make-whole” grants). In these instances, we encourage ISS to exclude these grants from the pay-for-performance testing since the grants fill a very specific need and would not be granted in the absence of forfeited compensation.
In other situations, companies make multi-year grants (sometimes called “special” or “retention” grants). These awards are not granted annually. Instead a larger grant is made up-front, followed by a period where grants are smaller or not made at all. In these cases, the amounts disclosed in the Summary Compensation Table and Grants of Plan Based Awards Table reflect the full-value, but companies view these awards as applying to multiple years. We urge ISS to annualize such grants in their analysis, and believe it would be a more accurate representation of long-term compensation. The value of the award could be readily annualized over its vesting period. ISS could also limit the number of years over which an award could be annualized (e.g., over no more than three years).
ISS Request for Comment – Pledging of Company Stock
ISS is considering adding pledging of company stock to the list of problematic pay practices that may result in an adverse vote recommendation. ISS noted that pledging of company stock as collateral for a loan may have a detrimental impact on shareholders if the officer is forced to sell company stock, for example to meet a margin call. Alternatively, when done prudently, hedging can provide flexibility by allowing executives access to lower cost financing without having to sell company stock to fund other purposes. The key here is balance. Excessive leverage is never a good thing and to the extent that executives do pledge shares certain safeguards should be in place.
What would you consider a “significant” level of pledging of company stock that causes concern for investors?
CAP Perspective: We would consider a significant level of pledging of company stock that causes concern for investors to be an amount where the stock price could be impacted by the sale of the shares. We believe pledging of shares with a value that exceeds 5 percent of the company’s market value should be considered significant.
In addition to the potential impact on stock price, investors could be concerned if a margin call forces a sale, particularly during a period where the trading window is closed. This could be prevented by requiring the executive to attest that other liquid assets, unrelated to company stock, are readily available to satisfy any potential margin call. Finally, stock ownership guidelines and policies prohibiting hedging should be in place to ensure that the executive remains invested in the company stock, even while pledging a portion of shares owned.
If pledging raises concerns significant enough to warrant voting action, should this action be directed at the (i) management say-on-pay proposal (if available), (ii) the board, or (iii) members of one of the board committees (e.g., Audit, Governance, Compensation – please specify)?
CAP Perspective: If pledging of shares is significant enough to warrant remedial action and ISS plans for this to influence its vote recommendations, we urge ISS to direct their concern regarding pledging to the Say on Pay vote. Pledging would be addressed by company policy akin to related issues, such as stock ownership guidelines, which are best reflected in the Say on Pay advisory vote.
Would you consider a company’s remedial actions on pledging (such as a commitment not to pledge in the future, commitment to unwind their positions within a reasonable period) sufficient to address concerns?
CAP Perspective: Yes, we urge ISS to consider a company’s remedial actions on pledging sufficient to address concerns. These positions may require time to unwind. Given the timing of the updated policy release, we hope that ISS considers the complexity of companies trying to align themselves with ISS policies.
Are there additional factors that investors should consider for the case-by-case analysis?
CAP Perspective: Yes, we believe there are additional factors investors should consider for the case-by-case analysis. One factor is a disclosed trading policy that prohibits hedging, that is short-selling and derivative positions, which potentially immunize an executive against exposure to company stock. A second factor is a policy on stock ownership guidelines. The third factor is limits on the amount pledged expressed in terms of the total shares relative to the company’s capitalization and to the executive’s total position.
Say on Golden Parachute Proposals (U. S.)
ISS is proposing to update the policy on Golden Parachute proposal to:
- Include existing change-in-control arrangements maintained with named executive officers rather than focusing only on new or amended arrangements.
- Place further scrutiny on multiple legacy problematic features in change in control arrangements.
When the Golden Parachute vote is incorporated into the advisory Say on Pay vote, ISS will evaluate the Say on Pay proposal in accordance with these guidelines, which may give higher weight to that component of the overall evaluation.
ISS Request for Comment – Golden Parachutes
In your organization’s view, when evaluating payments arising from problematic pay practices in the context of a say on golden parachute proposal, would you differentiate between new and existing arrangements when determining whether to support the proposal? If yes, please specify.
CAP Perspective: Yes, we encourage ISS to differentiate between new and existing arrangements when determining whether to support a say on golden parachute proposal. Often times, existing arrangements are contractual and therefore not quick or simple to modify.
CAP also encourages ISS to differentiate between the problematic features it identified. Certain features strike us as more problematic than other features. For example, assume that two companies put forward proposals where each had a single problematic feature. Assume that Company A had excise tax gross-ups, while Company B had single trigger acceleration of unvested stock options. We submit that the excise tax gross-ups could result in a material cost to shareholders. In contrast, single trigger equity vesting accelerates the executive’s ability to participate in the transaction along with shareholders. A company that has single trigger equity vesting may not be taking a leading edge position on compensation governance issues, but is also not supporting practices that are necessarily unfriendly to shareholders.
Would the number of problematic features be a consideration when evaluating a say on golden parachute proposal? If yes, please specify.
CAP Perspective: We believe ISS should focus on the potential value of arrangements it views as problematic, rather than a formula driven by a pre-determined number of program features. For these arrangements to justify ISS to consider an Against vote recommendation, ISS should come to the conclusion that potential payments are “excessive.” (See below for discussion of ‘excessive’)
Are there any other factors that should be considered in evaluating say on golden parachute proposals? If yes, please specify.
CAP Perspective: Given the timing of the updated policy release, we hope that ISS considers the complexity of companies trying to align themselves with ISS policies. In addition, an ISS defined problematic practice includes: “excessive golden parachute payments (on an absolute basis or as a percentage of transaction equity value).” We urge ISS to clarify their definition of excessive – both in absolute terms and as a percentage of transaction equity value – as it is difficult for companies to comply with a policy without specifics.
CAP is submitting commentary on its own behalf and not on behalf of any specific clients.
For the 114 company sample, median revenue was $30B, median market capitalization was $29B and median Total Shareholder Return (TSR) was 3% for 2011.
What We Found
With the majority of companies in our sample holding annual Say-on-Pay votes, we are seeing companies review various aspects of their pay programs/practices more frequently and make incremental changes. Given the intense pressure from shareholders and proxy advisory firms, companies and their Compensation Committees and outside consultants are annually re-evaluating pay programs. Companies need to stay ahead of the curve and track emerging “best practices” in order to satisfy shareholders. In line with our findings last year, we are continuing to see comprehensive risk assessments, modification of clawback policies and elimination of perquisites and supplemental retirement benefits.
Compensation Risk Disclosure
Of the 114 companies in our study, 113, or 99% made some type of affirmative disclosure on risk assessment in the most recent proxy. This is up from 95% of companies in our 2010 analysis. This affirmative disclosure responds to shareholders who want to be assured that compensation programs are not encouraging risky behavior. Similar to 2010, none of the companies disclosed that their incentive programs create material adverse risks.
Most companies make their risk-related disclosure in the CD&A of the proxy statement, with the corporate governance section of the proxy statement ranking as the second most common place to provide risk disclosure. The table below summarizes where risk disclosures were made:
|
|
2011 |
2010 |
||
|
Section of the Proxy Statement |
No. of Cos. |
% of Cos. n=113 |
No. of Cos. |
% of Cos. n=105 |
|
CD&A |
45 |
40% |
49 |
47% |
|
Corporate Governance Section (Section 407) |
31 |
27% |
25 |
24% |
|
CD&A and Corporate Governance Section (Section 407) |
19 |
17% |
14 |
13% |
|
Separate Stand Alone Section |
13 |
12% |
11 |
10% |
|
CD&A and Compensation Committee Report |
4 |
3% |
4 |
4% |
|
Compensation Committee Report |
1 |
1% |
2 |
2% |
Responsibility for completing the risk assessment process varies by company. Of the companies disclosing a risk assessment, 40 companies (35%) reported that management and the Compensation Committee worked together to conduct the assessment, while 25 companies (23%) reported that the Compensation Committee worked alone to conduct the assessment. This year 96% of companies disclosed who conducted the risk assessment. The table below provides further detail on which groups were involved in the compensation risk review.
|
|
2011 |
2010 |
||
|
Approach to Compensation Risk Reviews |
No. of Cos. |
% of Cos. n=113 |
No. of Cos. |
% of Cos. n=105 |
|
Management and Compensation Committee |
40 |
35% |
35 |
33% |
|
Compensation Committee |
25 |
23% |
17 |
16% |
|
Compensation Committee and Consultant |
17 |
15% |
15 |
14% |
|
Management, Compensation Committee and Consultant |
15 |
13% |
12 |
11% |
|
Management |
8 |
7% |
13 |
12% |
|
Not Disclosed |
5 |
4% |
5 |
5% |
|
Management & Consultant |
3 |
3% |
8 |
8% |
Clawbacks
While the SEC initially planned to implement rules for recouping executive compensation during the first half of 2012, their proposed schedule has been eliminated and no new timetable has been set. Even with no SEC timetable, companies continue to be proactive in adopting clawback policies that go beyond Section 304 of Sarbanes-Oxley, which applies to CEOs and CFOs and the top 25 executives at companies under TARP. Further, while most companies were waiting for final rules, before changing their programs, we are seeing many companies make changes now to respond to the intensifying executive compensation environment.
A significant majority of our research companies – 98 of 114 (86%) – have some form of clawback provision, compared to 80% in 2010. In 2011, 16 of the 98 companies adopted a new clawback policy or amended their existing one: 8 companies adopted a new policy and the other 8 modified existing provisions.
As was the case in 2009 and 2010, a financial restatement is required to trigger a clawback in nearly all cases (84 companies or 86% of those with a clawback, compared to 83% in 2010). Further, 78 companies (80% of those with a clawback, compared to 74% in 2010) disclosed that misconduct is a triggering event and 49 companies (50% of those with a clawback, compared to 51% in 2010) disclosed fraud as a trigger.
It is most common for companies with a clawback policy to include the ability to clawback or recoup compensation previously granted. While it is not currently prevalent for companies to adjust future incentive compensation, this may change based on final rules by the SEC.
|
2011 |
2010 |
|||
|
Compensation Subject to Clawback |
No. of Cos. |
% of Cos. n=98 |
No. of Cos. |
% of Cos. n=89 |
|
Prior LTI |
95 |
97% |
79 |
89% |
|
Prior Annual Incentive |
92 |
94% |
81 |
91% |
|
Adjust Future Annual Incentive |
16 |
16% |
20 |
22% |
|
Adjust Future LTI |
15 |
15% |
14 |
16% |
Note: Percentages add up to greater than 100% due to multiple responses.
Clawback policies cover proxy named executive officers (“NEOs”) in 92% of companies, similar to our findings in 2010, with company’s typically defining coverage as, “executive officers, officers, senior executives or senior management.” The other 8% of companies do not define specific coverage. It is not, however, required to disclose this level of program detail in the proxy, and at many companies the use of clawbacks is broad-based.
Similar to our findings for 2010, a minority of companies (22 companies or 22%) indicate the time period which compensation can be recovered after a financial restatement. Of the 22 companies that disclosed a time frame, the most common is 1 year (41% of companies) from the date of restatement and the range is 1-3 years. Interestingly, some companies are also disclosing different time periods for annual incentives and long-term incentives.
The most comprehensive clawback policies seen in our research apply to executives in financial services companies. Large banks now typically have provisions that extend well beyond those required by SOX or suggested in Dodd-Frank. These detailed programs are likely due to the regulators involvement in the compensation design process, as a result of the financial crisis and TARP. Many of the large banks have multiple programs that can impact different employee populations or pay elements for varying reasons (i.e. financial restatement, fraud, misconduct, inattention to risk, inaccurate performance measurement or unacceptable performance). Morgan Stanley’s policy serves as an example of a comprehensive policy:
Morgan Stanley: “The clawback can be triggered if an individual’s act or omission causes a restatement of the Company’s consolidated financial results or constitutes a violation of the Company’s risk policies and standards, whether such action results in a favorable or unfavorable impact to the Company’s financial results. PSUs are subject to clawback following payment if the Committee determines that the payout was based on materially inaccurate financial statements or other performance metric criteria. Deferred-cash based awards are subject to clawback if an individual’s act or omission causes, or is reasonable expected to cause, a substantial financial loss on trading strategy, investment, commitment or holding in either the current year or any prior year.”
We believe most companies are waiting for the SEC to adopt final rules before changing their clawback provisions. But in light of the SEC’s delayed schedule and the attention of shareholders and the media on this topic, companies will continue to modify their programs to respond to current conditions. Currently, the proposed rules apply to both current and former executives and cover all incentive compensation within 3 years of a financial restatement, regardless of whether intentional misconduct exists.
Perquisites
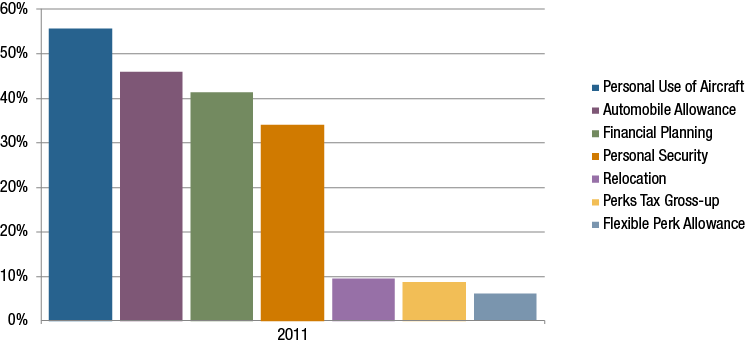
Notwithstanding the trend of decreasing executive perquisites, nearly all companies in our research provide some perquisites to CEOs that extend beyond the benefits provided to the broad employee population. Typical perquisites provided to the CEO include personal use of aircraft (54%), automobile allowance (46%), financial planning (41%) and personal security (35%).
While select perquisites are still somewhat prevalent for CEOs, the trend of reducing executive perks has continued in 2011. It is not surprising that as shareholders express concerns through annual Say-on-Pay votes, one area where companies are responding is by reducing perquisite programs in favor of more performance-based pay. Perquisites are often fairly low in total costs, but high in visibility and sensitivity. In 2011, 14 of 114 companies (12%) disclosed making a change to perquisite programs. Similar to 2009 and 2010, the most prevalent change was the elimination of certain perquisites.
|
|
2011 |
2010 |
||
|
Type of Change Reported in 2011 CD&A |
No. of Cos. |
% of Cos. n=14 |
No. of Cos. |
% of Cos. n=20 |
|
Eliminated perquisites |
9 |
64% |
11 |
55% |
|
Eliminated tax gross-ups on perquisites |
6 |
43% |
8 |
40% |
|
Reduced perquisites |
1 |
7% |
2 |
10% |
|
Changed perquisites |
0 |
0% |
3 |
15% |
Note: Percentages add up to greater than 100% due to multiple responses.
Among companies eliminating perquisites, the most common (in 4 of 9 companies) involved eliminating personal travel on the corporate aircraft or use of company automobile/automobile allowance. 2 of 9 (22%) eliminated home security benefits. Further, of the 9 companies that eliminated perquisites, 3 made up for the lost value in either annual base salary going forward or a one-time payment to cover the loss of the benefit.
Executive Retirement Benefits
16 of 114 companies (14%) disclosed making some type of change to executive retirement plans/benefits in 2011, a slight decrease from 2010 where 17% of companies disclosed a change. As was the case in 2010, t
Notable Findings
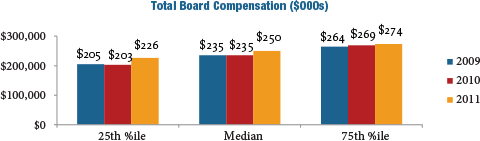
Total Board Compensation
At median, non-employee director compensation increased six percent in 2011, after being flat in 2009 and 2010. Year-over-year, median Total Board Compensation increased from $235,000 to $250,000{anchor anchor=’footnote-907-3′ text=’3′}.
Use of Board meeting fees was a minority practice in 2011, with only 19 percent of companies paying meeting fees. This declined from 23 percent in 2010. In line with emerging practices, more and more large companies are relying on annual retainers to compensate outside directors.
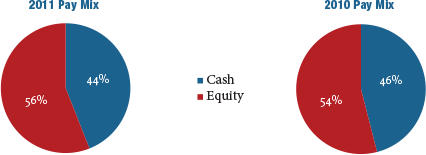
Pay Mix
The mix of cash and equity paid to outside directors was generally consistent between 2010 and 2011. On average, the majority of compensation delivered to directors continues to be in the form of equity.
Equity Compensation
Full-value equity awards, including restricted stock units, restricted stock, deferred stock units and outright awards of common stock, continued to increase as a percentage of total equity delivered. In 2011, only seven percent of large companies granted stock options, down from 11 percent in 2010.
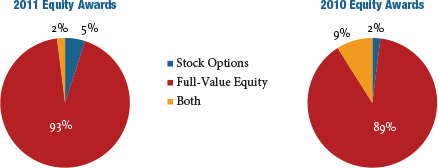
Year-over-year, equity awards denominated as a fixed value increased in prevalence, as opposed to awards based on a fixed number of shares.
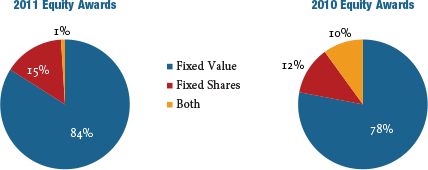
CAP Perspective: Over the next few years, we expect the following changes in director compensation to take place: 1) low-to-mid single-digit annual increases in Total Board Compensation; 2) more companies moving to fixed retainer pay structures with a component in cash and a component in equity as opposed to paying meeting fees; and 3) a continued emphasis on full-value equity awards. Delivering a majority of compensation in the form of equity coupled with stock ownership/retention requirements creates strong alignment with long-term shareholders and is considered a best practice.
Committee Compensation
Companies are de-emphasizing committee member compensation and focusing on overall Board compensation. Our research found that just over 50 percent of companies studied pay no committee-specific fees to members of any of the three major committees{anchor anchor=’footnote-907-4′ text=’4′}, an increase from approximately one-third in 2010. During 2011, median committee member compensation decreased when compared with 2010{anchor anchor=’footnote-907-5′ text=’5′}. At median, committee member compensation is now $0.
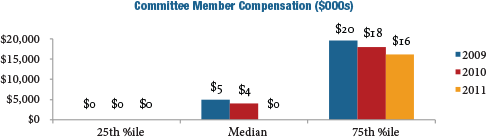
CAP Perspective: We expect the trend away from committee member fees to continue at a slow-to-moderate pace with the value being rolled into Board cash or equity retainers.
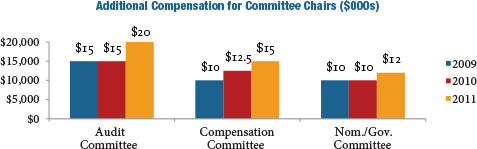
Unlike member compensation, median additional compensation for committee Chairs increased from 2010 to 2011: +33 percent for the Audit Committee; +20 percent for the Compensation Committee (following a 25 percent increase from 2009 to 2010); and +20 percent for the Nominating/Governance Committee. The increases have been driven by recognition of the differential between the time requirement of the leadership role versus that of a committee member.
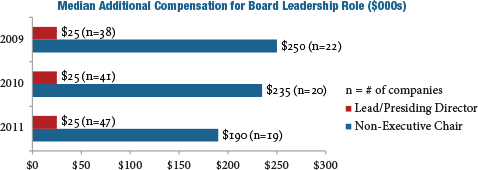
Lead/Presiding Directors and Non-Executive Chair of the Board
During 2011, the prevalence of providing additional compensation for Lead/Presiding Directors and non-Executive Board Chairs increased from approximately 65 percent in 2010 to approximately 70 percent in 2011. In terms of additional compensation for the role, median pay was unchanged at $25,000 in 2011 for Lead/Presiding Directors and decreased for non-Executive Chairs.
CAP Perspective: While not all non-executive Board leaders receive additional pay for the role, prevalence of additional compensation for these roles is expected to continue to increase over time. The differential in pay between Lead/Presiding Directors and non-Executive Chairs is in line with the responsibilities of each position.
Conclusion
The time commitment and potential for reputational and legal risk connected with service as a director has increased over the past few years, yet economic challenges and an uneven recovery have slowed the rate of growth in director compensation. Due to this, we have observed only moderate increases to director pay levels. However, pay practices for directors continue to evolve. We have observed a continuing and significant trend towards simplification, as director compensation becomes viewed more as an “advisory fee” than an “attendance fee.”
It continues to be important to comprehensively evaluate director pay programs on a regular basis or risk falling behind the curve in terms of desired market positioning and best in class program design. When programs are evaluated, the process and practices listed below should be considered.
|
Best in Class Director Compensation PROCESS |
Establish director pay levels and structure in an informed, deliberate and objective way, with consideration given to market data, trends and outlook Define target market positioning for total pay “Market” should reflect the peer group used for executive compensation benchmarking and/or size-appropriate general industry data Use compensation as a tool to align the interests of non-employee directors and long-term shareholders Disclose the director compensation philosophy and rationale for the program |
|
Best in Class Director Compensation PRACTICES |
Align pay levels with an organization’s size and complexity; in turn, provide appropriate pay for time and responsibilities Review director pay programs focusing on aggregate pay (Total Board Compensation), considering the ratio of cash compensation to equity compensation and additional pay for Board leadership roles Structure pay so that equity represents at least half of the total The pay program should be viewed as an “advisory fee” vs. an “attendance fee” Establish meaningful equity ownership requirements Eliminate benefit/perquisite programs unless there is a strong business case for maintaining them |
1 Analysis includes public Fortune 100 companies (excludes privately held companies).
2 Research assistance for this report was provided by Roman Beleuta, Armando Rivera and Kevin Scott.
3 Total Board Compensation reflects all cash and equity compensation for Board and committee service, excluding compensation for additional leadership roles such as committee Chair, Lead/Presiding Director, or non-executive Chair of the Board.
4 Audit, Compensation and Nominating/Governance committees.
5 Reflects all compensation for committee member service (excludes additional fees for leadership roles), across all Board committees.
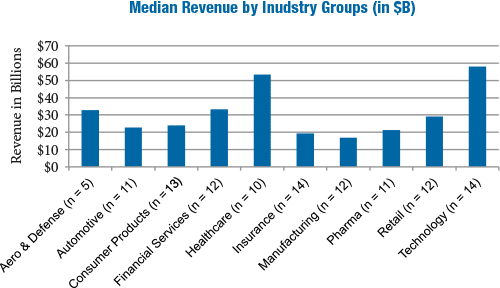
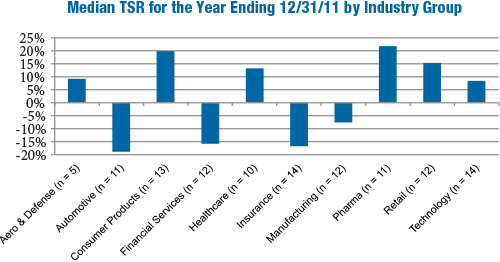
For the 114 company sample, median revenue was $30B, median market capitalization was $29B and median Total Shareholder Return (TSR) was 3% for 2011. As indicated in the charts below, significant variations in company size and performance occur by industry.
What We Found
During 2011, companies continued to make refinements to their executive compensation programs to improve the alignment between pay and performance. Compensation opportunities improved during 2011, as many companies in our sample resumed modest salary increases to the Named Executive Officers (“NEOs”), paid annual incentives for 2011 performance that were above target on average, and continued to shift long-term incentive opportunities into more performance-based vehicles.
Compensation Strategy
Compensation Strategy Changes
A few companies (7%) disclosed making changes to their compensation strategy in 2011. Of the eight companies that disclosed changes, five companies lowered their target pay positioning to be at median of the market (vs. above median) due, in part, to increasing scrutiny from shareholders and proxy advisory firms:
- Allstate: In 2010, the company targeted pay levels between 50th and 75th percentiles of the market. In 2011, Allstate received shareholder feedback that pay should not be targeted above the 50th percentile and, therefore, the company reduced its benchmark target to the median
- Amgen: Significantly reduced the grant value of regular annual LTI equity awards by lowering the benchmarking target by 25 percentage points to the median of the peer group to be responsive to stockholders
Two companies changed the mix between fixed and variable pay; Lincoln National and Prudential Financial increased the portion of total compensation based on variable pay.
Compensation Philosophy
66% of companies in our study disclosed their desired competitive pay positioning for the NEOs. Among these companies, approximately 60% target total direct compensation at median. Pay positioning varies among the industry groups. More companies in the Consumer Goods and Technology industries targeted total compensation above median (60% and 67%, respectively), while companies in the Manufacturing and Pharmaceutical industries tend to target pay at median (88% and 80%, respectively).
Pay Mix
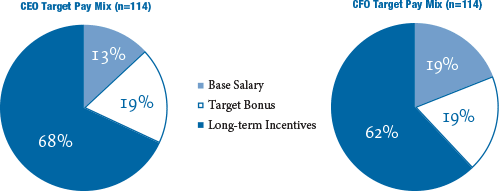
The target pay mix for CEOs includes a higher percentage of total pay in the form of long-term incentives, averaging 68% across industries. In contrast, the average CFO’s pay mix was composed of 62% in long-term incentives. This disclosed pay mix varies by industry with the Technology industry providing the highest proportion of CEO total compensation (75%) in long-term incentives.
Peer Groups Used For Benchmarking
In 2011, 30% of companies disclosed changes to their peer groups used to benchmark senior executive compensation levels. Many companies refined the peer group to better reflect their size and industry focus. More frequent peer group changes were due to, in part, greater shareholder scrutiny resulting from Say on Pay votes. We suspect that Institutional Shareholder Services’ (ISS) new approach to peer group development for their CEO pay-for-performance assessment also had an impact.
Approximately 50% of companies decreased the number of comparator companies in their peer group while 30% of companies increased the size of the peer group and 20% disclosed changes to their peer group but did not indicate an increase or decrease in the number of peer companies.
Base Salary Actions
As the economy continues its slow rebound, we found that more companies provided salary increases for senior executives. 47% of companies in our sample provided a salary increase for their CEO, while a majority of companies (78%) provided a salary increase for their CFO. Companies in the Automotive, Consumer Goods and Pharmaceutical industries were more likely to provide a salary increase to the CEO compared to the other industries reviewed. Companies typically cited the desire to provide a competitive merit increase (generally ranging from 3 – 5%) as the rationale. When companies provided salary increases above this range, market salary adjustments (40% of companies) and promotional increases (15% of companies) were often cited as the reasons.
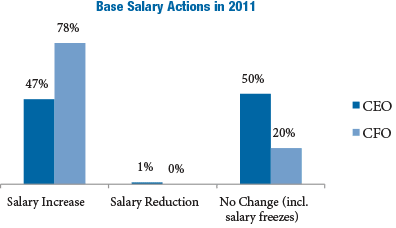
Note: Does not include new CEOs or CFOs hired in 2011. Therefore, percentages do not add up to 100%
Annual Incentive Plan Design
Nearly 40% of companies disclosed annual incentive plan design changes in 2011 or planned changes for 2012. Changes to the annual incentive plan were varied but most often reflected a refinement to enhance the pay for performance alignment and/or support the business strategy. Of companies that made changes to their annual incentive plan, 42% made changes to plan metrics that determine funding. 28% of companies increased the annual incentive target opportunity for the CEO and/or CFO to remain competitive with market practice.
The chart below presents the reported AIP changes:
|
% of Cos. Reporting Changes |
|||
|
Type of Change Reported in CD&A |
No. of Cos. |
2011 (n = 43) |
2010 (n = 57) |
|
Change in performance metrics used to fund awards |
18 |
42% |
33% |
|
Increased target award opportunities |
12 |
28% |
26% |
|
Change in performance metric weighting/mix |
9 |
21% |
18% |
|
Change in maximum award payout |
5 |
12% |
4% |
|
Added risk-based metrics |
2 |
5% |
n/a |
|
Other changes |
8 |
19% |
16% |
Note: Percentages do not add up to 100% due to multiple responses.
Change in Performance Metrics
Half of the companies that made changes to annual incentive plan metrics incorporated additional metrics to their plans in 2011/2012. Four companies reduced the number of metrics to focus executives on key criteria most aligned with the business strategy.
Three companies incorporated strategic measures to their annual incentive plan in addition to the financial metrics:
- Eli Lilly: Added achievement in new product pipeline milestones as an incentive plan metric
- Lowe’s Cos: Added the completion of three strategic incentives as additional performance goals
- Visteon: In addition to profitable growth, cash flow and quality, the 2012 annual incentive award will also be based on the accomplishment of key strategic actions
In 2011, two companies, Bank of New York Mellon and Manulife Financial, added risk-based adjustments to the annual incentive plan payouts, reinforcing the objective of minimizing any potential risk-related behavior that could have an adverse impact on the company.
Annual Incentive Plan Metrics
Revenue, EPS, operating income and cash flow were the most commonly used annual incentive plan metrics across all industry groups in 2011. Industries such as Insurance and Pharmaceutical tend to have industry specific metrics (e.g., Operating Income/EPS in the Insurance industry and Pipeline/R&D Development in the Pharmaceutical industry). Customer-focused industries (e.g., Consumer Goods, Pharmaceuticals, Retail and Technology) were more likely to have Revenue as an annual incentive metric.
The three most prevalent metrics for each industry group are detailed below:
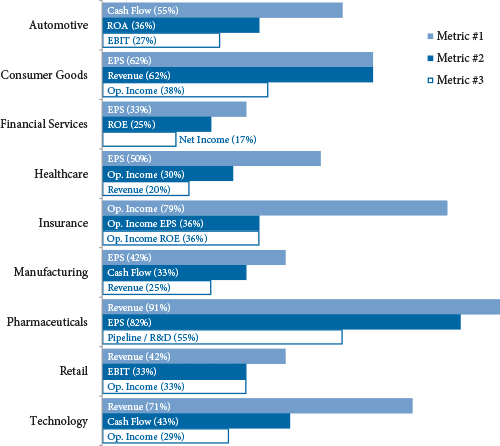
Note: Excludes Aerospace and Defense due to limited sample size (n = 5).
2011 Bonus Payout Details
Similar to last year, 96% of companies paid a bonus to NEOs for 2011 performance. A majority of companies (80%) used financial goals to determine annual incentive payouts and approximately 15% have a plan that provides a payout based on some degree of Compensation Committee or Board discretion. At median, CEOs received a payout that was 130% of target in 2011 (compared with 135% in 2010). In the Insurance and Technology industries, the median CEO payout approximated target suggesting performance was near the budget/plan for the companies in our review. Bonus payouts for the CEO’s in the Aerospace and Defense, Automotive, Manufacturing and Pharmaceuticals industries were generally 145 – 160% of target, likely reflecting stronger than expected performance in 2011.
All companies that paid a bonus in 2011 provided all or a portion of the award in the form of cash. 11% required executives to defer a portion of the annual incentive payout, with most of these companies deferring the payout in full value shares (e.g., restricted stock, restricted stock units, etc.) and one company, Morgan Stanley, providing a deferred cash payout. Approximately half of companies with mandatory deferrals are in the Financial Services industry, where it is more common for incentive pay (annual and long-term) to be deferred for a longer time period (i.e., at least 3 years).
Long-Term Incentive Plan Design
50% of companies made a change to their long-term incentive (“LTI”) plan design in 2011 or for 2012. 46% of these companies changed the LTI vehicle mix with a majority providing a greater emphasis on performance-based equity. Approximately 40% of companies eliminated and/or added LTI vehicles to their program. Companies were more likely to eliminate stock options or time-based restricted stock and add a performance share plan. The table below outlines the reported changes:
|
% of Cos. Reporting Changes |
|||
|
Type of Change Reported in CD&A |
No. of Cos. |
2011 (n = 57) |
2010 (n = 77) |
|
Changed mix of LTI award vehicles |
26 |
46% |
26% |
|
Added or eliminated LTI vehicle |
22 |
39% |
29% |
|
Changed long-term performance metric |
12 |
21% |
31% |
|
Changed LTI award opportunity level |
10 |
18% |
18% |
|
Changed performance plan comparison/peer group |
4 |
7% |
n/a |
|
Other |
13 |
23% |
22% |
Note: Percentages do not add up to 100% due to multiple responses.
Long-Term Incentive Prevalence
The prevalence of performance-based equity increased slightly in 2011 and the use of stock options and time-based restricted stock remained relatively flat. Further, companies continue to provide a larger portion of LTI in performance-based incentive vehicles.
Below is the breakdown of overall LTI vehicle prevalence for NEOs in 2009-2011:
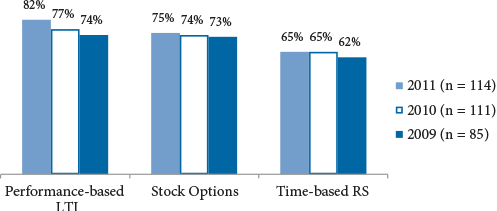
Note: Percentages do not add up to 100% due to multiple responses.
Companies use a balanced approach in delivering the executive LTI program. Nearly 55% of companies deliver LTI in the form of two vehicles and 35% use three vehicles.
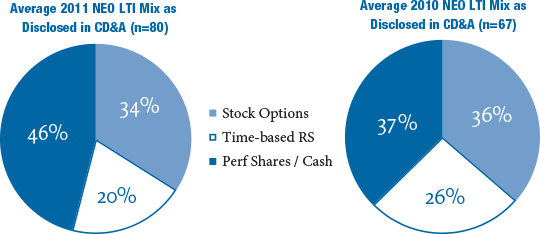
Long-Term Award Mix
A majority of companies that made changes to the LTI program shifted a greater portion of LTI to performance-based awards.
|
% of Cos. Reporting Changes |
|||
|
Type of Change Reported in CD&A |
No. of Cos. |
2011 (n = 26) |
2010 (n = 20) |
|
Greater emphasis on performance-based awards |
17 |
65% |
60% |
|
Reduced emphasis on stock options |
11 |
42% |
35% |
|
Reduced emphasis on time-based restricted stock |
12 |
46% |
25% |
|
Other |
6 |
23% |
25% |
Of the 80 companies that disclosed a targeted LTI mix for 2011, the average CEO LTI mix included 46% in the form of performance shares or performance cash vs. 37% in 2010. The portion of LTI delivered in restricted stock decreased from 26% to 20% in 2011, a further reflection of the shift towards performance-based equity. The percentage of LTI in the form of stock options remained relatively flat year-over-year.
Performance-Based LTI Metrics
For companies that have a performance-based LTI plan, 36% use TSR and 34% use EPS, the most prevalent metrics used. More companies use absolute performance metrics than relative metrics. All companies using TSR disclose using it as a relative metric (vs. absolute) compared to a peer group or broader index.
The chart below displays the prevalence of LTI metrics for performance-based awards in 2011 and 2010:
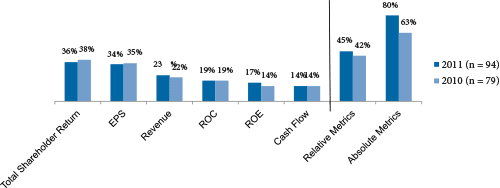
Note: Percentages do not add up to 100% due to multiple responses.
Treatment of Dividend Equivalents
49% of companies provide dividend equivalents on time-based restricted stock awards and approximately 30% do so for performance share awards. Of these companies, most pay dividends when shares are vested or earned (71% and 88%, respectively).
Conclusions
Companies are continuing to make changes to their compensation philosophy, primarily through targeting a more moderate (median) market pay position and making refinements to the peer group used for benchmarking. As the economy continues to slowly rebound, a strong majority of companies gave salary increases to NEOs in the past year. And as shareholders and shareholder advisory groups have an increasingly stronger voice in the compensation arena, companies are making notable program modifications that strengthen the pay and performance alignment, through refining annual incentive metrics or delivering more LTI in the form of performance-based awards.
- §953, §955: Rules regarding disclosure of pay-for-performance, pay ratios, and hedging by employees and directors
- §954: Rules regarding recovery of executive compensation (clawback policies)
- Previously, the SEC had planned on proposing rules for these provisions between January and June 2012 and to finalize rules between July and December of 2012
Conclusion
Elimination of the timeline reflects the delays in SEC rule-making. As a result, we expect that these provisions will not apply during the 2013 proxy season and there is significant uncertainty about when rules will be proposed. This would push implementation of the pay-for-performance and pay ratio disclosure aspects of Dodd-Frank to the 2014 proxy season. The timing delay is due, in part, to other more pressing regulatory issues (e.g., the JOBS Act).
2013 will still be a busy year for both management and Compensation Committees due to Dodd-Frank. We expect annual Say on Pay (Dodd-Frank §951) votes to continue to demand significant attention. In addition, Committee and advisor independence standards (Dodd-Frank §952) were recently issued by the SEC and we should soon see listing standards governing independence proposed by the major exchanges.
Please contact us at (212) 921-9350 if you have any questions about the issues discussed above or would like to discuss your own executive compensation issues. You can access our website at www.capartners.com for more information on executive compensation.
Our findings, summarized below, indicate that overall, increases in pay levels for both CFOs and CEOs have moved from double-digit figures in the 2009-2010 period to single-digit figures in the 2010-2011 period, suggesting pay actions that are more reflective of a stabilizing economy. Pay increases in both periods were higher for CFOs compared to CEOs, driven by higher increases in short-term compensation. On an absolute basis, CFO pay continues to be approximately one-third of CEO pay.
Study Results
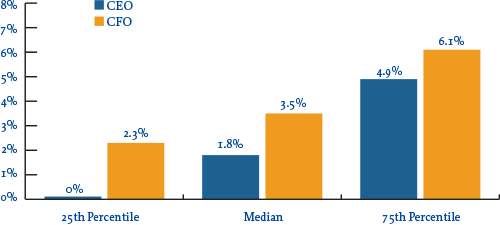
Salaries
In 2011, 88% of CFOs received salary increases at a rate of 3.5% at median and 6.1% at the 75th percentile. In comparison, only 66% of CEOs received salary increases at lower levels (1.8% at median and 4.9% at the 75th percentile). The prevalence of salary increases for both CFOs and CEOs rose year-over-year, from 75% to 88% (CFOs) and from 56% to 66% (CEOs).
Salary Increase Prevalence |
||||
| 2009 – 2010 | 2010 – 2011 | |||
| No Increase | Increase | No Increase | Increase | |
| CEO |
43.8% |
56.3% |
34.4% |
65.6% |
| CFO |
25.0% |
75.0% |
12.5% |
87.5% |
2011 Salary Increases
Actual Pay Levels
Overall, actual total direct compensation (salary plus actual annual incentive plus the present value of long-term incentives) for both CFOs and CEOs continued to increase but at much lower rates in the 2010-2011 period compared to 2009-2010, as illustrated in the chart below. These lower, single-digit increases in pay levels are indicative of a stabilizing economy. The salary and actual bonus increase levels themselves continued to be higher for CFOs in the 2010-2011 period than for CEOs. Long-term incentives proved to be the biggest driver of pay increases from 2010 to 2011, however, rising by 10% for both CEOs and CFOs.
Median Percentage Change in Pay Components |
||||
| Pay Components | 2009 – 2010 | 2010 – 2011 | ||
| CEO | CFO | CEO | CFO | |
| Salary |
1.0% |
3.7% |
1.8% |
3.5% |
| Actual Bonus |
19.0% |
22.7% |
0.0% |
3.5% |
| Long-Term Incentives |
10.1% |
14.8% |
10.0% |
10.3% |
| Actual Total Direct Comp. |
14.4% |
20.0% |
3.6% |
7.5% |
Financial Performance (Median Levels) |
|||
| Year | Total Shareholder Return (as of 12/31) | 1-Year Revenue Growth | 1-Year Net Income Growth |
| 2009 |
31% |
-9% |
-7% |
| 2010 |
24% |
10% |
19% |
| 2011 |
5% |
9% |
13% |
While movement in pay among CFOs and CEOs was directionally similar, absolute CFO total direct compensation levels, on average, have been approximately 30% of CEO total direct compensation levels over the last three years.
Target Pay Mix
In terms of target compensation levels, the overall pay mix remained largely unchanged from 2009 to 2011, with a greater emphasis on at-risk pay for CEOs than for CFOs.
Long-Term Incentive (LTI) Vehicle Prevalence and Mix
The majority of companies continue to award LTI to both CEOs and CFOs using at least two incentive vehicles. The role of stock options has declined in the overall mix companies use to deliver LTI. And on average, performance-based LTI now comprises approximately 50% of LTI for CEOs and CFOs, an increase of approximately 10% over the past three years. Data shows 80% of CFOs and 85% of CEOs received some form of performance-based awards as part of their LTI program in 2011.
Number of LTI Vehicles Used in 2011 |
||
| % in Total | ||
| CEO | CFO | |
| 1 |
20% |
18% |
| 2 |
46% |
44% |
| 3 |
31% |
34% |
| Average |
2 |
2 |
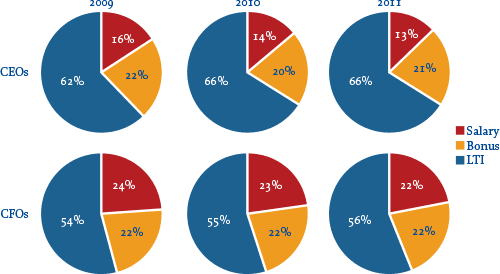
LTI Mix |
||||||
| 2009 | 2010 | 2011 | ||||
| CEO | CFO | CEO | CFO | CEO | CFO | |
| Stock Options |
40% |
41% |
33% |
30% |
32% |
32% |
| Time Vested Restricted Stock |
19% |
21% |
20% |
23% |
17% |
22% |
| Perf. Based LTI |
40% |
38% |
48% |
47% |
51% |
46% |
Conclusion
In the last three years, trends in CFO pay have been directionally aligned with trends in CEO pay. While the rates of increases were higher for CFO’s 3 years ago, and have started to moderate compared to earlier years, trends for both positions indicate a pronounced linkage to performance, particularly through the long term incentive program.
While volatility in the economy may be stabilizing somewhat, we expect the performance linkages to remain strong for these two key positions. With the continued emphasis at the executive and board level on strong financial skills, talent and acumen, companies will continue to pay competitively for those in the CFO role.
- In addition to the five factors (listed later) that must be considered when assessing a compensation adviser’s independence originally included in the Dodd-Frank legislation and the proposed rules, the committee must also consider any relationships the adviser may have with an executive officer (proposed rules only required assessment of relationships with committee members)
- The proposed rules only addressed the independence of the members of the Compensation Committee; however, the final rules also specify that the requirements apply to all Board members who are acting in a fashion similar to the Compensation Committee
- This may be of particular relevance when significant compensation decisions are made by the full board. Companies will need to be cognizant of what Directors may or may not vote on specific compensation issues.
Timing for Implementation
The new rules and amendments will take effect 30 days after publication in the Federal Register. The stock exchanges have 90 days from the date the rules are effective to propose listing standards and one year from the date of effectiveness to have final rules in place. In addition, companies must be in compliance with the new required disclosure regarding the use of a compensation consultant (including whether the work of the compensation consultant has raised any conflicts of interest and if so, how the conflict is being addressed) for the proxy material for any annual meeting at which directors are elected on or after January 1, 2013.
In the section below, we provide a brief summary of highlights of the adopted rules.
Committee Independence
The listing standards must require that each member of a company’s compensation committee be independent. The definition of independent is left to each of the exchanges to define, but needs to consider relevant factors, including:
- A director’s source of income, including any compensatory arrangement with the company
- Whether a director is affiliated with the company or any related entity
The rules do provide the exchanges flexibility to exempt particular relationships from the independence requirement, as deemed appropriate by the exchanges, if warranted by relevant factors (e.g., size of company).
Compensation Advisers
The final regulations also direct the exchanges to establish listing standards related to compensation advisers (e.g., consultants, legal counsel, etc.), they specify the following:
- Each compensation committee must have the authority, in its sole discretion, to obtain the advice of compensation advisers
- Before selecting any compensation adviser, the compensation committee must take into consideration specific factors identified by the Commission that affect the independence of compensation advisers, though there are no specific thresholds or tests specified. The six factors are:
- Does the adviser’s firm provide any other services to the company
- The fees received by the adviser as a percent of the adviser’s total revenue
- The policies and procedures the adviser firm has in place to prevent conflicts of interest
- Any business or personal relationship between an advisor and the compensation committee
- Whether the adviser owns stock in the company
- Any business or personal relationship between the adviser and executive officers
- The compensation committee must be directly responsible for the appointment, compensation and oversight of the work of the advisers
- Sufficient funding must be provided to pay the adviser
Note the rules do not limit the exchanges from adding additional criteria to the assessment of adviser independence. It is also worth pointing out that the adopted rules do not require Committee’s to use an independent adviser, but only to assess the independence of the adviser. The adopted rules also clarify that in using the advice of in-house legal counsel, the Committee does not have to consider the independence factors.
Disclosure of Consultant Independence and Conflicts of Interest
As mentioned earlier, for any consultant that played a role in determining or recommending the amount or form of executive and director compensation and whose work has raised any conflict of interest, the companies will be required to disclose the nature of the conflict of interest and what the company did to address the conflict. This disclosure does not eliminate any of the currently required disclosure regarding executive compensation consultants (e.g., identify consultant, state whether consultant was engaged directly by the compensation committee, describe the nature and scope of the engagement and instructions given to the consultant, and fee disclosure if the consultant provided additional fees greater than $120,000)
Conclusion
The adopted rules adhere closely to the original language of the Dodd-Frank legislation and to the proposed rules. The next step in the process of implementation will be in the exchanges’ development of the listing standards. The adopted rules provide the exchanges with a good degree of flexibility in how they will define independence and the factors to consider in assessing independence. It will be interesting to see if they do much beyond what is laid out in the adopted rules to clarify the rules.


