This report summarizes 2018 CEO pay and performance, as well as incentive compensation practices, for CAP’s large Pharma/Biotech sample. The 18 companies in CAP’s large Pharma/Biotech sample represent a mix of U.S. and non-U.S. firms that range in size from $11B to $82B in revenues.
Total direct compensation for the chief executive officers (CEOs) of 18 large, publicly traded Pharmaceutical and Biotechnology companies increased four percent in 2018, according to a Compensation Advisory Partners (CAP) analysis of 2019 public disclosures. Larger annual incentive payouts drove the increase in CEO total direct compensation for 2018. The CEOs received increased annual incentive payouts because their companies delivered consistent revenue growth and strong adjusted earnings per share (EPS) growth.
Key Takeaways
- Median CEO annual incentive payout was above target for the third year in a row
- Top-line and bottom-line metrics continue to be the most prevalent metrics in incentive plans. Most companies in the sample include pipeline in the annual incentive plan and all companies include TSR and/or absolute stock price performance in the long-term incentive plan
- Companies continue to place significant emphasis on performance-based compensation, with more than 85% of pay being variable
- External market factors will continue to provide challenges to pharma/biotech companies, including industry specific factors such as drug pricing
- Environmental, Social, and Governance (ESG) issues are an area of interest for many investors; it remains to be seen if and how it will impact executive compensation
2018 Performance
CAP’s Pharma/Biotech sample delivered strong financial results again in 2018. Median revenue for the sample increased five percent, following steady increases of six percent in the last two years. Adjusted EPS (non-GAAP) growth increased more significantly in 2018 (+11%), reflecting continued strong performance. The sample overall has had consistent improved financial performance for the last three years.
| Year | Median Financial Performance – CAP’s Pharma/Biotech Sample | Median Total Shareholder Return | |||
| Revenue Growth | Adjusted EPS Growth | CAP’s Pharma/Biotech Sample | S&P Global 1200 Index | S&P 500 Index | |
| 2016 | 6% | 8% | -7% | 11% | 15% |
| 2017 | 6% | 7% | 10% | 20% | 21% |
| 2018 | 5% | 11% | 1% | -9% | -7% |
Total shareholder return (TSR) has been a more volatile performance metric for the last three years, with 2018 market performance much weaker compared to 2017. While median TSR for CAP’s Pharma/Biotech sample was lower in 2018 vs 2017, the industry outperformed both the S&P 1200 Global Index and the S&P 500 Index. External factors, including tax reform, certainly gave a boost to 2017 market performance. 2018 performance for the industry continues to be impacted by public scrutiny over drug pricing practices, as well as drug pipeline results and expectations.
2018 CEO Pay
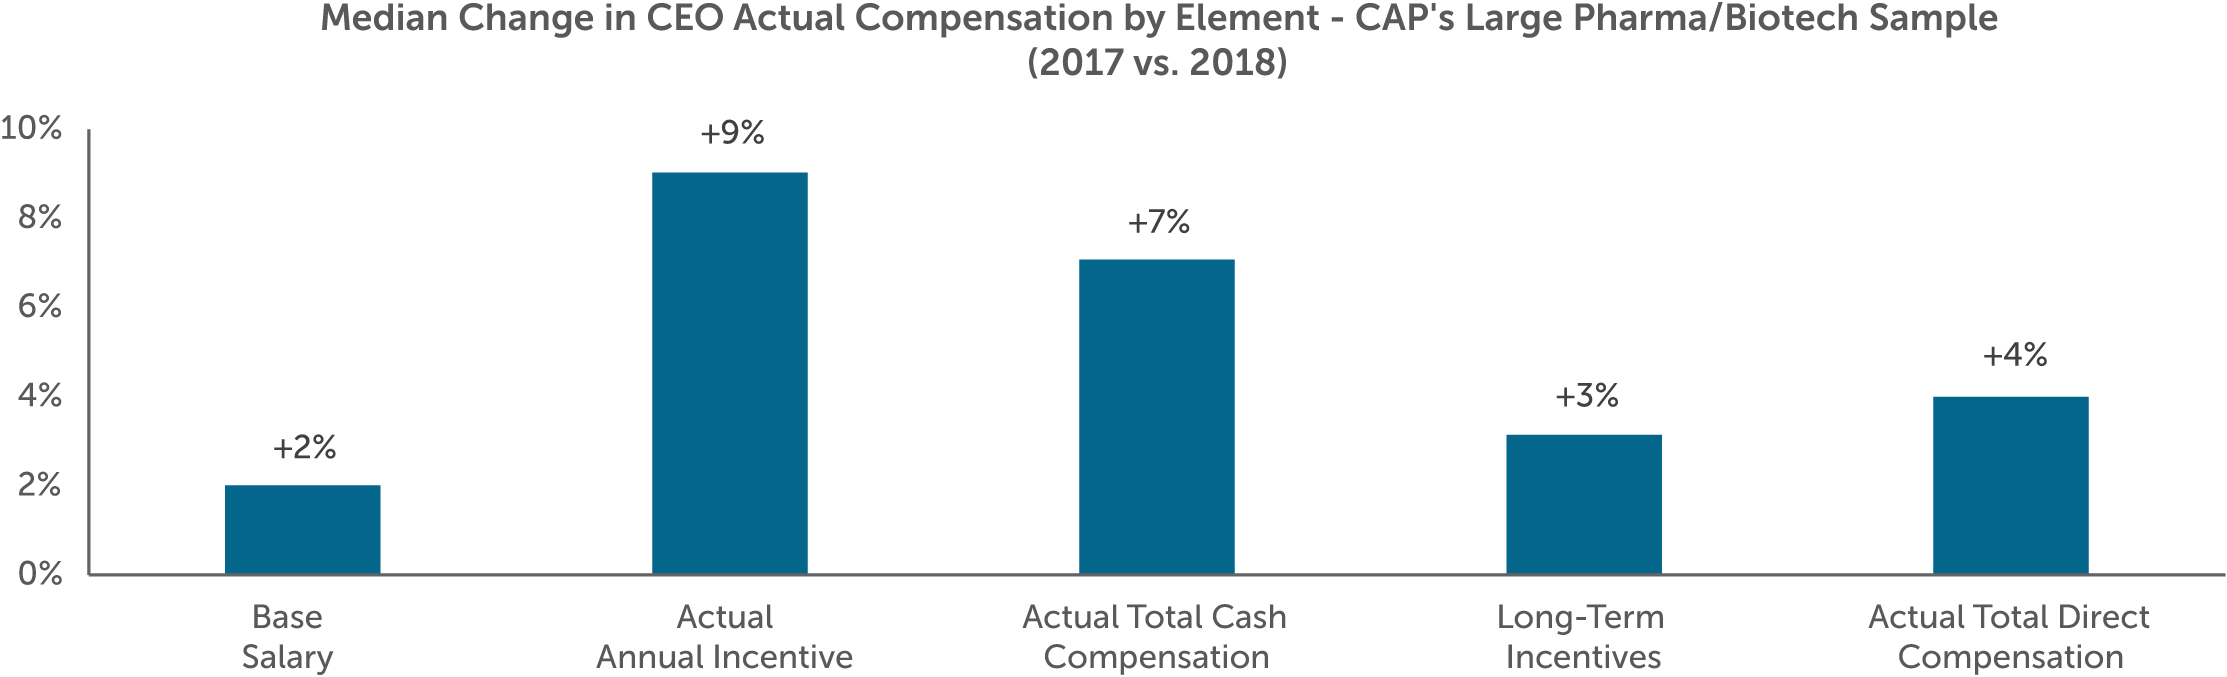
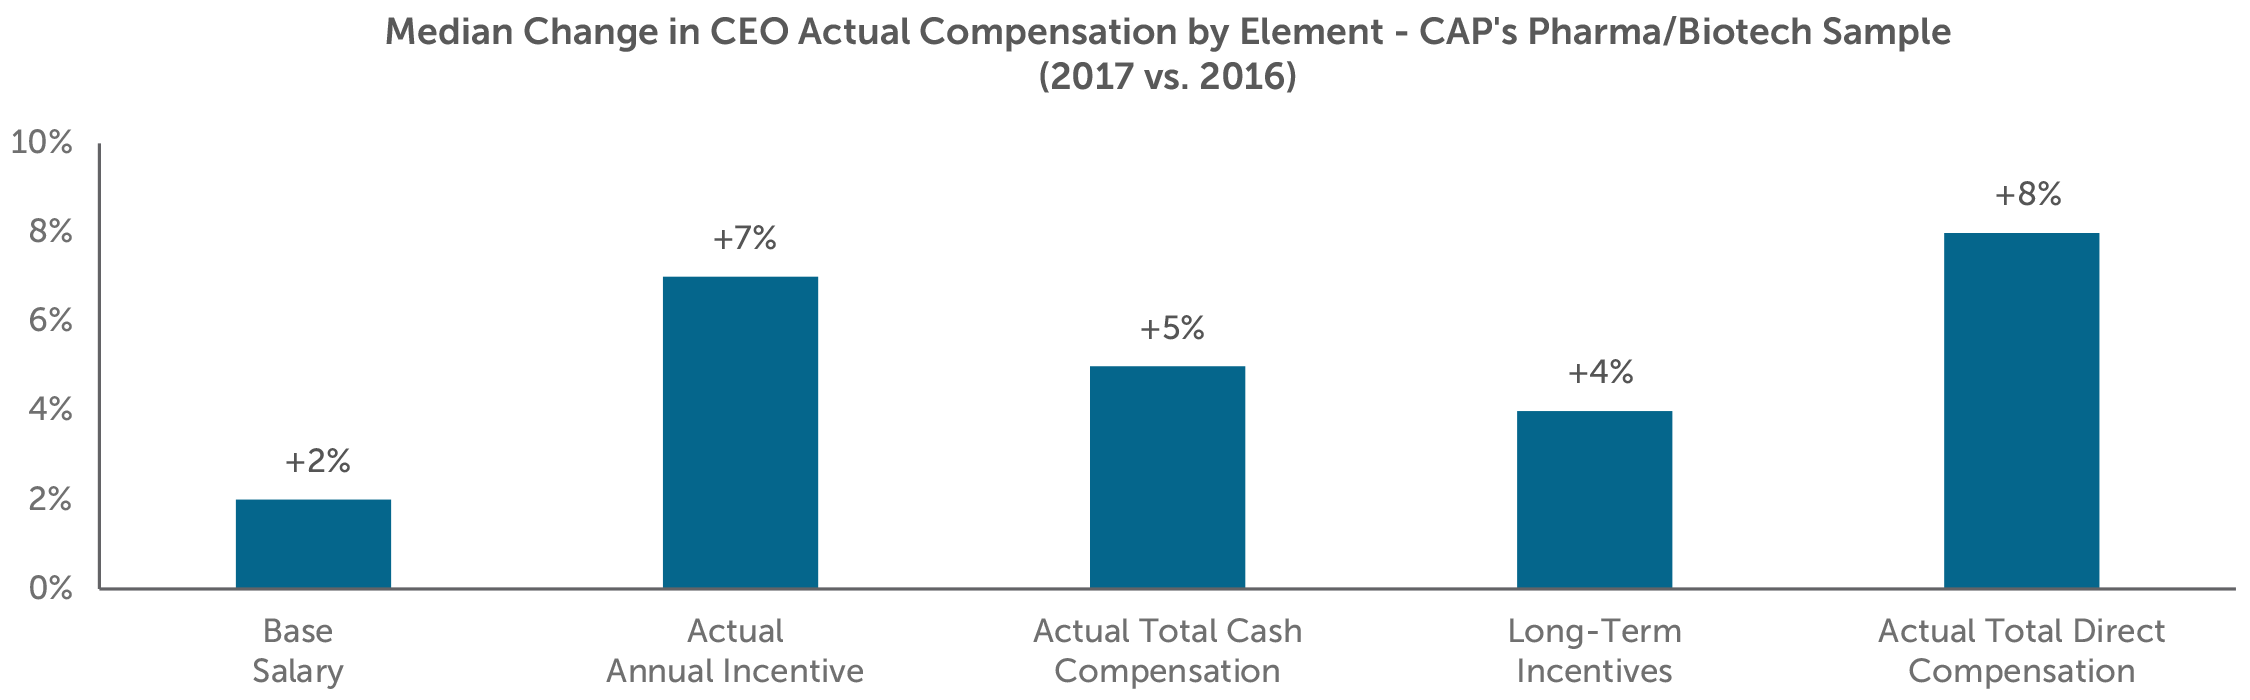
Median CEO total direct compensation for CAP’s Pharma/Biotech sample increased four percent for 2018. Total direct compensation includes base salary, which is a fixed element of compensation, plus actual annual and long-term incentive payouts, which are variable and performance-driven elements of compensation.
Fixed compensation saw modest increases (+2%), which was similar to prior years. Actual annual incentive payouts jumped nine percent in 2018. Long-term incentives also saw a modest increase (+3%).
Median annual incentive payouts as a percent of target have been steadily increasing year-over-year, in line with steady positive financial performance. Annual incentive payouts for CEOs in the Pharma/Biotech sample have paid out consistently above target for the past three years.
Among the CEOs in CAP’s Pharma/Biotech sample, the median annual incentive payout for 2018 performance was 137% of target, reflecting an increase of 12 percentage points over the prior year’s median. Payouts at the 75th and 25th percentiles also increased slightly. The spread between top quartile and bottom quartile has generally remained the same over the last three years.
| Summary Statistics | CEO Annual Incentive Payouts as a % of Target – CAP’s Pharma/Biotech Sample | ||
| 2016 | 2017 | 2018 | |
| 75th Percentile | 149% | 154% | 166% |
| Median | 119% | 125% | 137% |
| 25th Percentile | 109% | 110% | 122% |
Target Compensation Mix
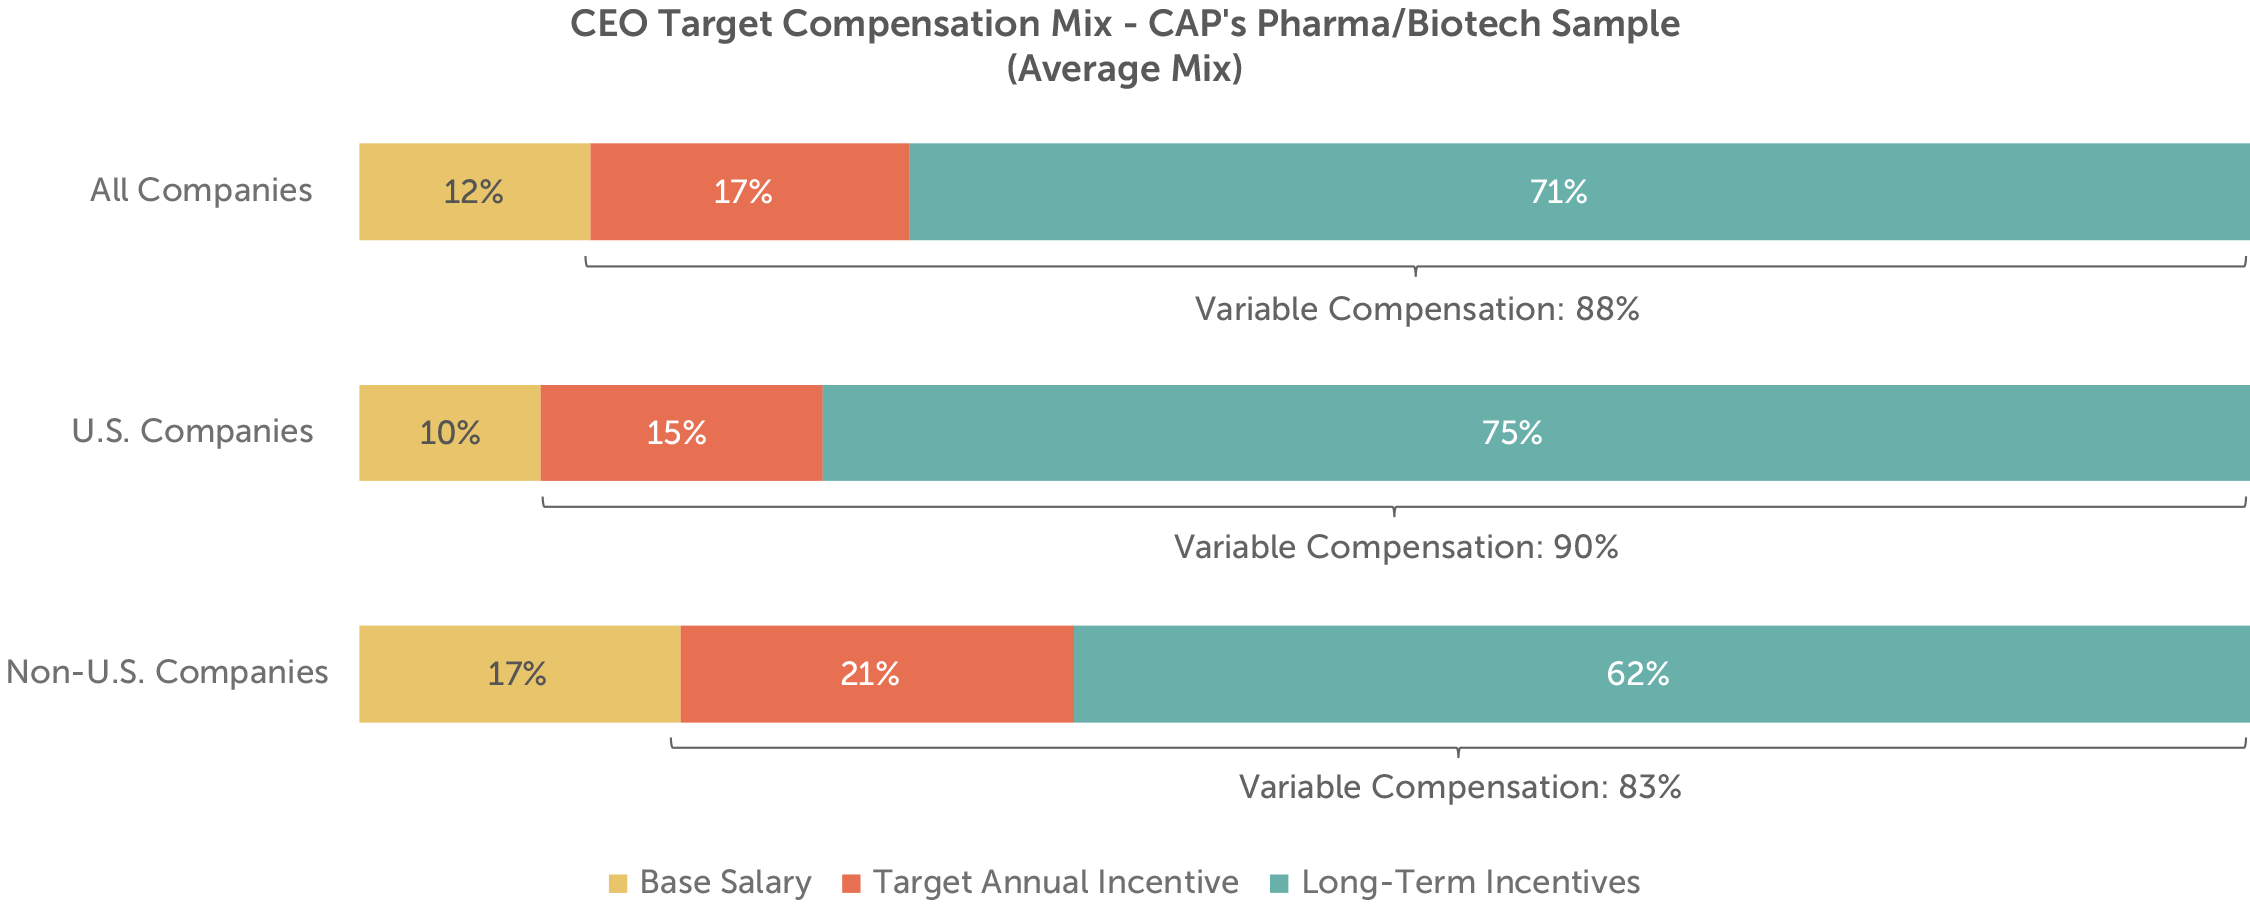
On average, the vast majority of target total direct compensation for CEOs of large public companies across all industries is delivered in the form of annual and long-term incentives, or variable compensation. Consistent with prior years, CEOs in CAP’s Pharma/Biotech sample receive approximately 90 percent of target compensation in the form of variable pay.
Pay practices differ among U.S. and non-U.S. companies, with non-U.S. companies placing more emphasis on fixed compensation. For non-U.S. companies in CAP’s sample, base salary accounts for approximately 18 percent of target compensation versus only 10 percent at U.S. companies. U.S. companies place significant emphasis on long-term incentives relative to their non-U.S. counterparts.

Annual Incentive Performance Metrics
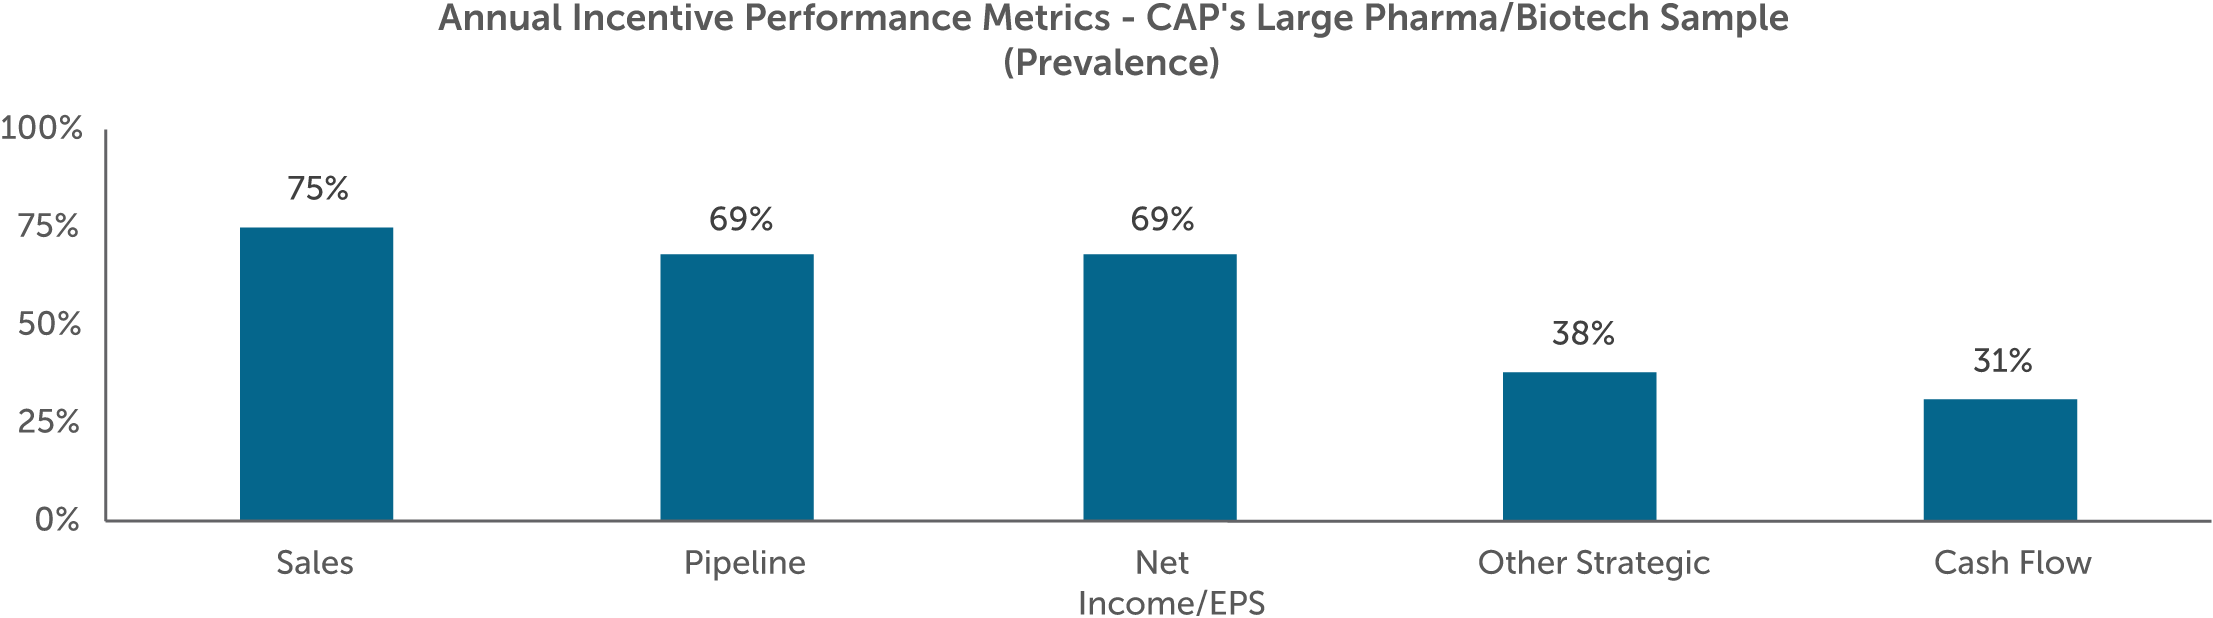
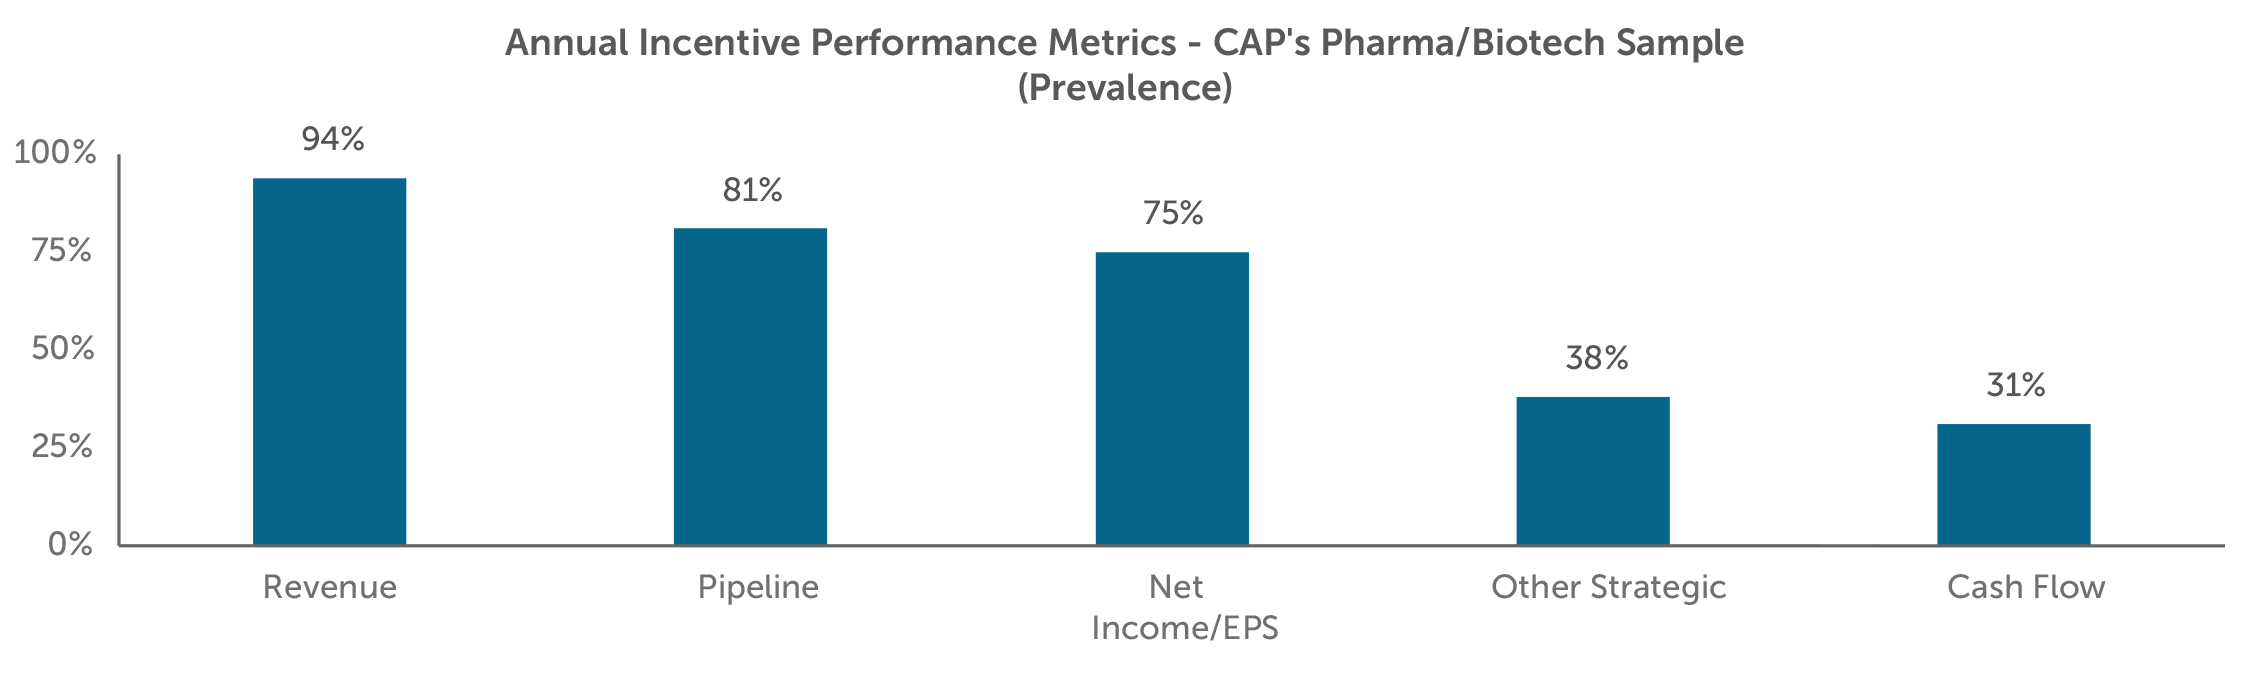
Companies in CAP’s Pharma/Biotech sample continue to focus on growth and profitability in the short-term, as evidenced by the two most prevalent financial performance metrics in annual incentive plans – revenue and earnings per share (EPS). For CEOs in the sample, individual performance is also considered in the determination of annual incentive payouts.
Strategic measures – in particular those focusing on the drug pipeline – are common among companies in our sample. Pipeline milestones across the spectrum of the research and development (R&D) lifecycle are important considerations for pharmaceutical and biotechnology as they race to advance life-enhancing therapies in the market. Other strategic metrics focus on business development, commercialization, and other organizational goals.
Corporate environmental, social, and governance (ESG) issues have been a hot topic in recent times for the media and investors. In our experience, organizations and boards have mixed views regarding the inclusion of ESG goals in their incentive plans. When an ESG goal is included as a measure, it is often incorporated with a relatively low weighting (10% or less) or considered within individual goals. In CAP’s Pharma/Biotech sample, one company (Novartis) discloses the use of corporate responsibility and environmental sustainability goals within its strategic objectives.
Long-Term Incentive Vehicles & Mix
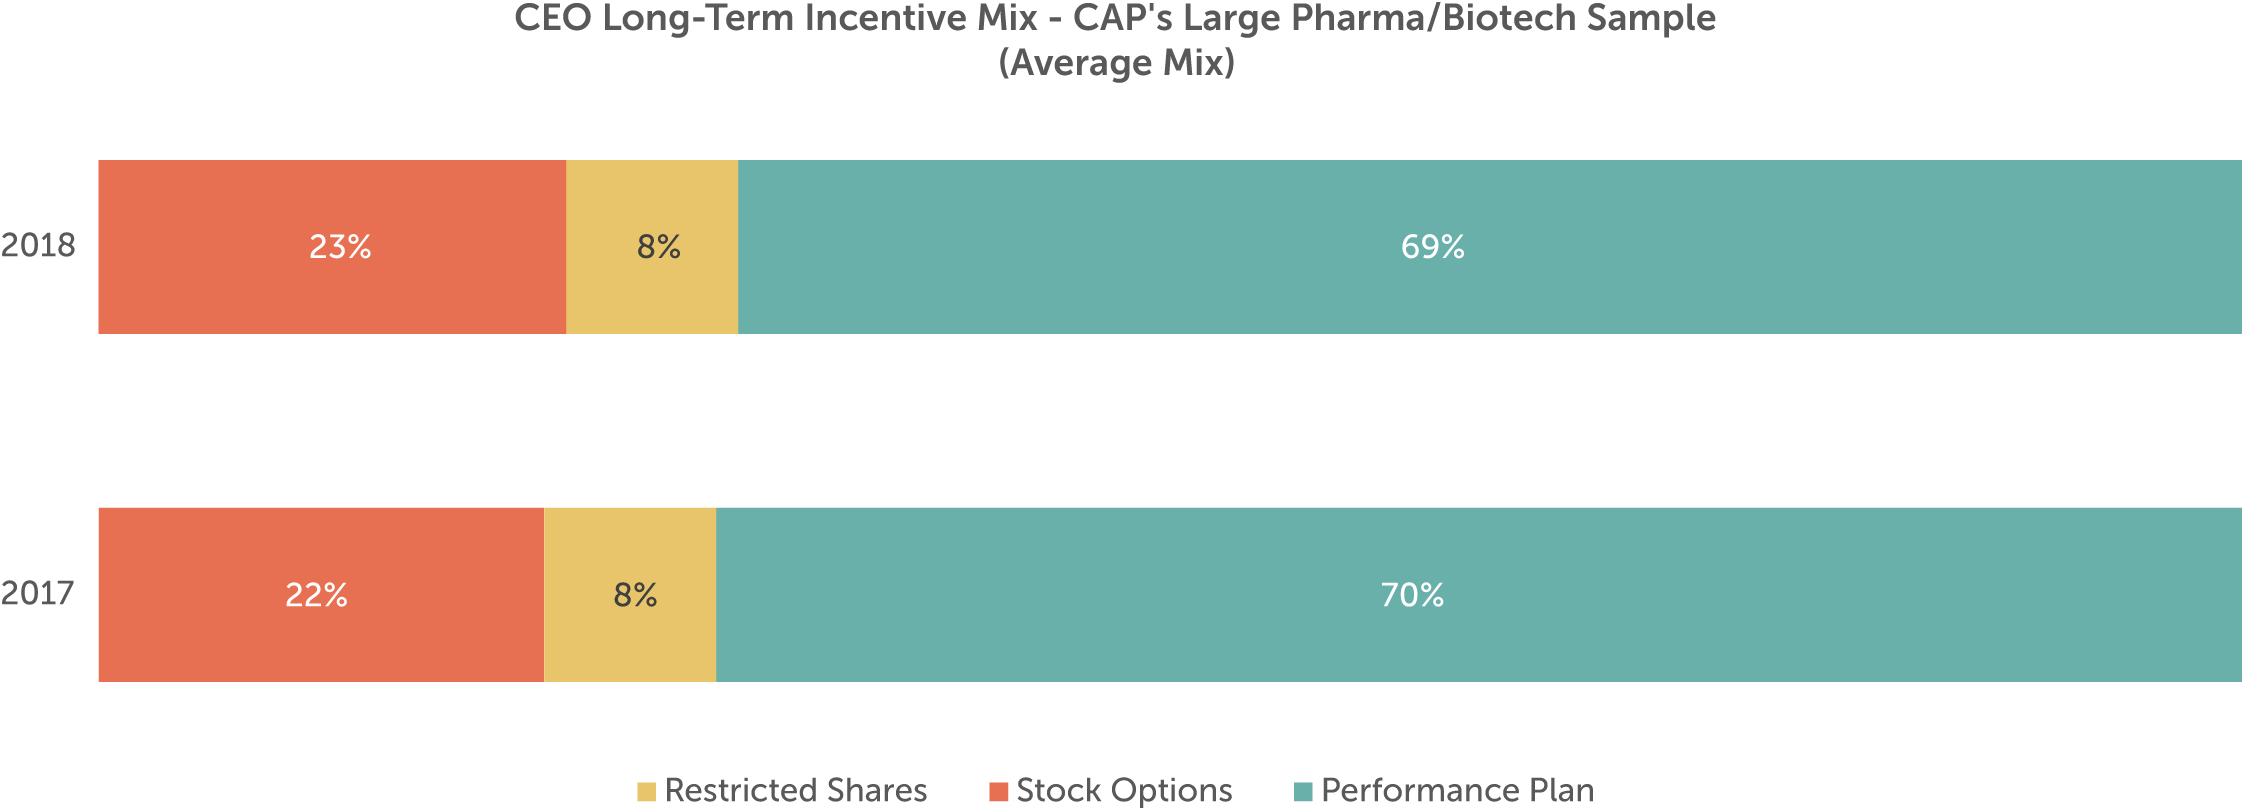
Long-term incentives comprise the largest part of compensation for CEOs in CAP’s sample (approximately 70%, on average). These awards tie executive compensation to longer-term company performance objectives and are typically delivered through equity with multi-year vesting periods.
Long-term incentive vehicles fall into three broad categories: (1) time-vested restricted stock shares (or units); (2) time-vested stock options (or stock appreciation rights); and (3) long-term performance plans. Performance plans can include performance shares (or units), performance-vested stock options, and performance-based cash compensation with multi-year performance criteria.
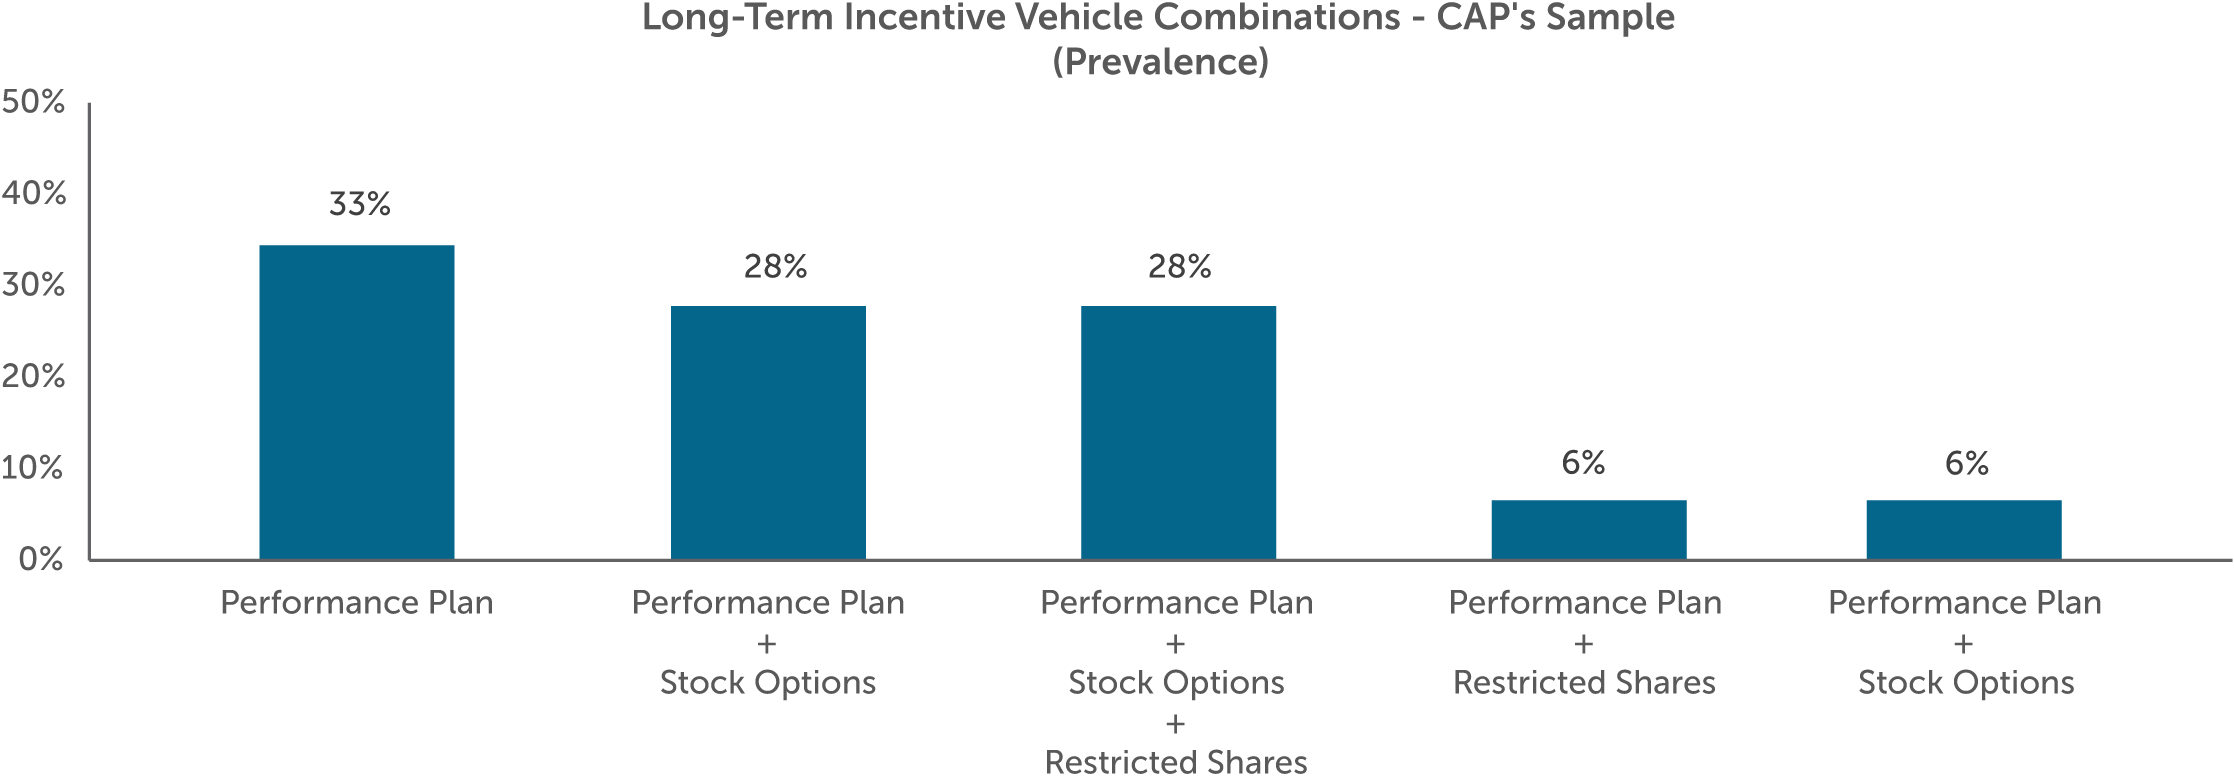
Among large public companies across industries, performance plans are the most common vehicle for delivering long-term incentives to the CEO. The same is true for CAP’s Pharma/Biotech sample. Of the companies in our sample, performance plans comprise almost three-quarters of the total long-term incentive mix, on average. About a third of companies use performance plans exclusively as their only long-term incentive vehicle.
Long-Term Incentive Performance Metrics
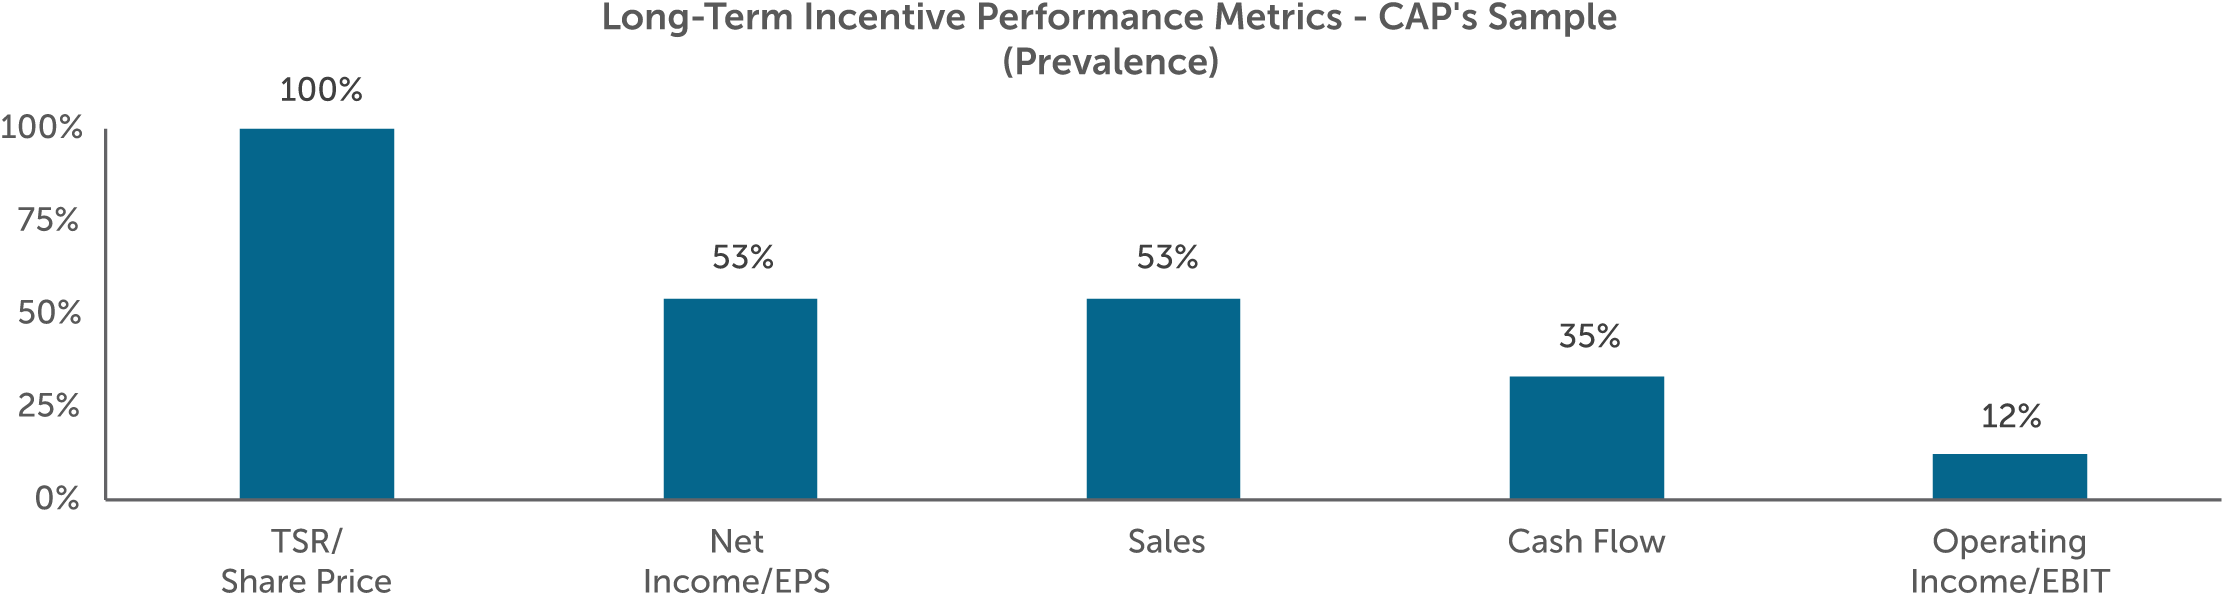
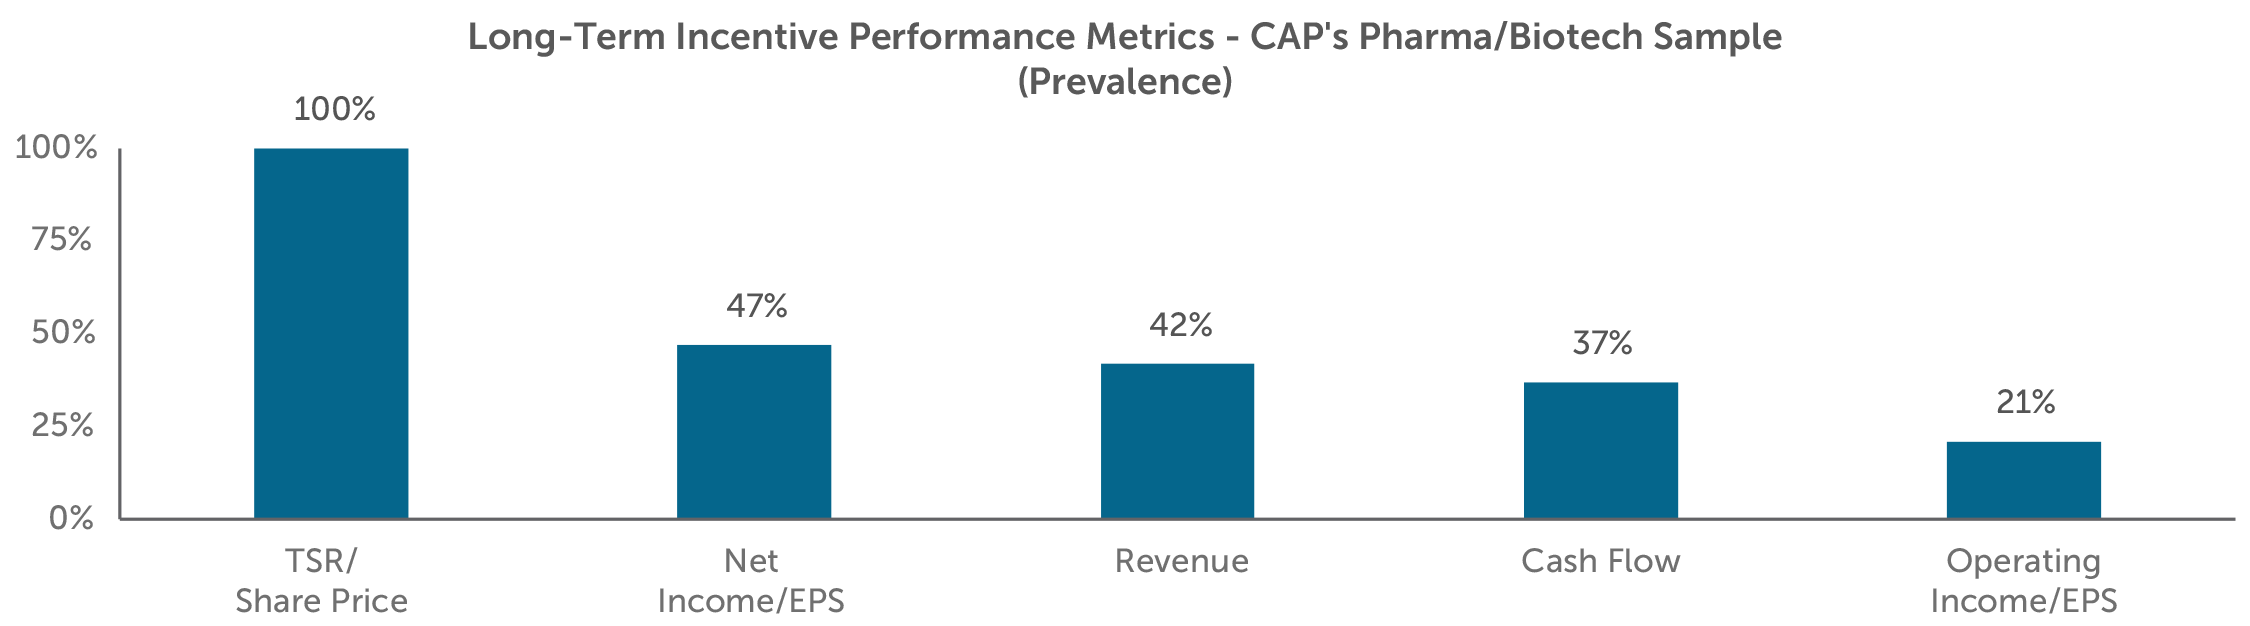
Long-term incentives generally focus on and reward value creation over a three-to-five-year timeframe. In our sample, all companies with a performance plan use either relative total shareholder return (TSR) or absolute stock price as a metric. Approximately one-third of the companies in CAP’s sample use relative TSR as a modifier to performance results.
Similar to annual incentives, long-term performance plans use growth and profitability financial metrics. The most prevalent metrics include net income/EPS, sales, and cash-flow measures.
Additional Information – Shareholder Proposals around Drug Pricing
Pharmaceutical companies have faced increased scrutiny by regulators over the last couple of years, especially around the issue of drug pricing. A handful of companies in our sample have received shareholder proposals around drug pricing and tying executive compensation to the drug-pricing process. These proposals are asking for increased disclosure on how drug pricing strategies impact executive compensation. Five pharmaceutical/biotechnology companies included this proposal in their 2019 proxy statements, with these proposals generally receiving 20 percent to 30 percent shareholder support.
Looking Ahead
2019 opened with two notable acquisitions within the industry (Bristol-Meyers/Celgene and Eli Lilly/Loxo Oncology). While the pharmaceutical/biotechnology industry is relatively compact already, consolidation may continue in the future as companies struggle with combating high R&D costs and uncertain pipeline success rates. More companies will have drugs coming off patent in the next few years, leading to more generic drug competition. With increased pressure surrounding high drug prices in the market and regulators becoming more cautious in approving new and innovative treatments, pharmaceutical/biotechnology companies will have increased pressure to maintain a successful pipeline.
Median first quarter total shareholder return for CAP’s Pharma/Biotech sample was six percent, trailing both the S&P Global 1200 (12%) and the S&P 500 (15%) Indices. We expect companies and compensation committees to continue to align CEO payouts with overall performance.
The Large Pharma/Biotech sample continues to show consistency in incentive plan design, with the different companies having similar strategic priorities. ESG issues will continue to be an area of focus, but we do not believe it will become a primary driver of incentive payouts. Companies and compensation committees will continue to evaluate their incentive plan designs to ensure alignment with organizational priorities, while considering market and regulatory developments.
For questions or more information, please contact:
Kelly Malafis, Partner
[email protected] 212-921-9357
Joanna Czyzewski, Associate
[email protected] 646-486-9746
Diane Lee and Joshua Hovden provided research assistance for this report.
CAP’s Pharma/Biotech Sample:
- AbbVie Inc.
- Allergan plc
- Amgen Inc.
- AstraZeneca PLC
- Biogen Inc.
- Bristol-Myers Squibb Company
- Celgene Corporation
- Eli Lilly and Company
- Gilead Sciences, Inc.
- GlaxoSmithKline plc
- Johnson & Johnson
- Merck & Co., Inc.
- Mylan N.V.
- Novartis AG
- Pfizer Inc.
- Roche Holding AG
- Sanofi
- Teva Pharmaceutical Industries Limited
This report summarizes 2017 CEO pay and performance, as well as incentive compensation practices, for a sample of 19 large public Pharmaceutical and Biotechnology companies. CAP’s Pharma/Biotech sample includes a balance of U.S. and non-U.S. companies.
Key Takeaways
- For the second year in a row, median annual incentive payout was well above target (124% in 2017 and 121% in 2016) reflective of consistent strong performance.
- Top-line and bottom-line metrics as well as pipeline are the most prevalent metrics in the annual incentive plan.
- Companies place a significant emphasis on performance plans in the long-term incentive (LTI) mix with all companies in our sample using performance-based LTI; on average, performance plans are 75% of the mix.
- All companies use total shareholder return (TSR) and/or absolute stock price performance to measure long-term performance, usually in combination with at least one financial metric.
- We expect external factors, such as scrutiny regarding drug pricing and continued uncertainty with healthcare reform, will continue to pose challenges for companies in the industry.
2017 Performance
The industry overall had a good year in 2017, as companies continued to grow revenue, manage expenses, and maintain operating margins. Median 2017 financial performance for CAP’s Pharma/Biotech sample was largely consistent with 2016, building on prior-year growth. Revenue growth of 6% was unchanged year over year, and adjusted operating margin held steady at 32%. Adjusted EPS growth decreased slightly, from 9% in 2016 to 8% in 2017.
| Year | Median Financial Performance – CAP’s Pharma/Biotech Sample | ||
| Revenue Growth | Adjusted Operating Margin | Adjusted EPS Growth | |
| 2016 | 6% | 32% | 9% |
| 2017 | 6% | 32% | 8% |
| Y/Y Change | No Change | No Change | -1% pts |
The industry recovered somewhat in 2017, with median total shareholder return (TSR) improving by 16 percentage points, flipping from -7% in 2016 to +9% in 2017. However, CAP’s Pharma/Biotech sample underperformed the broader market for the second year in a row. Industry-specific factors, such as public scrutiny over high drug prices globally, along with uncertainty surrounding the future of healthcare legislation in the U.S., likely contributed to this underperformance. Individual company stock price performance is highly influenced by pipeline expectations, successes, and failures.
| Group | Median Total Shareholder Return | ||
| 2016 | 2017 | Y/Y Change | |
| CAP’s Pharma/Biotech Sample | -7% | 9% | +16% pts |
| S&P Global 1200 Index | 10% | 18% | +8% pts |
| S&P 500 Index | 15% | 20% | +5% pts |
2017 CEO Pay
Consistent year-over-year financial performance translated to consistent year-over-year annual incentive payouts. Similar to the prior year, many companies provided above-target payouts.
Among the CEOs in CAP’s Pharma/Biotech sample, the median annual incentive payout for 2017 performance was 124% of target, reflecting an increase of 3 percentage points over the prior year’s median. Payout increases at the low and high ends of the range were similarly modest. The 25th percentile payout increased 2 percentage points to 111% of target, and the 75th percentile payout increased 1 percentage point to 151% of target.
| Summary Statistics | CEO Annual Incentive Payouts as a % of Target – CAP’s Pharma/Biotech Sample | ||
| 2016 | 2017 | Y/Y Change | |
| 75th Percentile | 150% | 151% | +1% pts |
| Median | 121% | 124% | +3% pts |
| 25th Percentile | 109% | 111% | +2% pts |
The median increase in actual total direct compensation (defined as the sum of base salary, actual annual incentive, and long-term incentives) for the CEOs in CAP’s Pharma/Biotech sample was 8% for 2017.
For the most part, increases in variable compensation (i.e., annual and long-term incentives) exceeded increases in fixed compensation. The median annual incentive increase and long-term incentive increase were 7% and 4%, respectively, while the median base salary increase was just 2%.
Incentive Compensation Practices
Target Compensation Mix
Generally, 80% to 90% of target total direct compensation for CEOs of large public companies is delivered in the form of variable compensation. Among CAP’s Pharma/Biotech sample, variable compensation accounts for 88% of target total direct compensation, on average.
Consistent with prior-year findings, there is a notable difference in target compensation mix between the U.S. companies and the non-U.S. companies in CAP’s Pharma/Biotech sample. On average, the U.S. companies place more emphasis on long-term incentives, and correspondingly less emphasis on base salary and target annual incentive.
Annual Incentive Performance Metrics
The objectives underlying annual incentive plans are often associated with short-term growth and profitability, and encourage successful performance against individual objectives. This is reflected in the two most prevalent financial performance metrics among CAP’s Pharma/Biotech sample – revenue and net income (or EPS). Almost all of the companies in CAP’s Pharma/Biotech sample use a “top-line” revenue metric in addition to one or more “bottom-line” income metrics.
The use of pipeline and other strategic metrics is also common. Tying compensation to pipeline efforts is critical, as Pharmaceutical and Biotechnology companies must continuously innovate to remain competitive. Additional reasons to focus executives on R&D are its high costs and corresponding uncertainty around success or failure. Developing a new drug can take upwards of ten years and require billions of dollars of investment, and the eventual loss of exclusivity on key products invites competition from generics and biosimilars. Among CAP’s Pharma/Biotech sample, other (i.e., non-pipeline) strategic metrics typically reward executives for the successful launch and commercialization of new products, as well as organizational accomplishments.
Long-Term Incentive Vehicles & Mix
Long-term incentives tie executive compensation to performance against longer-term company objectives. Awards are typically delivered using equity-based vehicles with multi-year vesting periods, which helps to align the interests of executives with those of shareholders, while also serving as a retention tool.
Long-term incentive vehicles can be bucketed into three broad categories: (1) time-vested restricted shares (or units); (2) time-vested stock options (or stock appreciation rights); and (3) long-term performance plans. Performance plans include performance shares (or units), performance-vested stock options, and performance-based cash compensation with multi-year performance criteria.
Among large public companies generally, a performance plan is the most common vehicle for delivering long-term incentives to the CEO. The same is true for CAP’s Pharma/Biotech sample.
Over the past several years, the average long-term incentive mix for CEOs of large public companies has shifted toward performance plans and away from stock options and, to a lesser extent, restricted shares. Among CAP’s Pharma/Biotech sample, performance plans now make up close to three-quarters of the average long-term incentive mix, largely because all the companies in CAP’s Pharma/Biotech sample use a performance plan, and more than a third of these companies use a performance plan as the only long-term incentive vehicle.
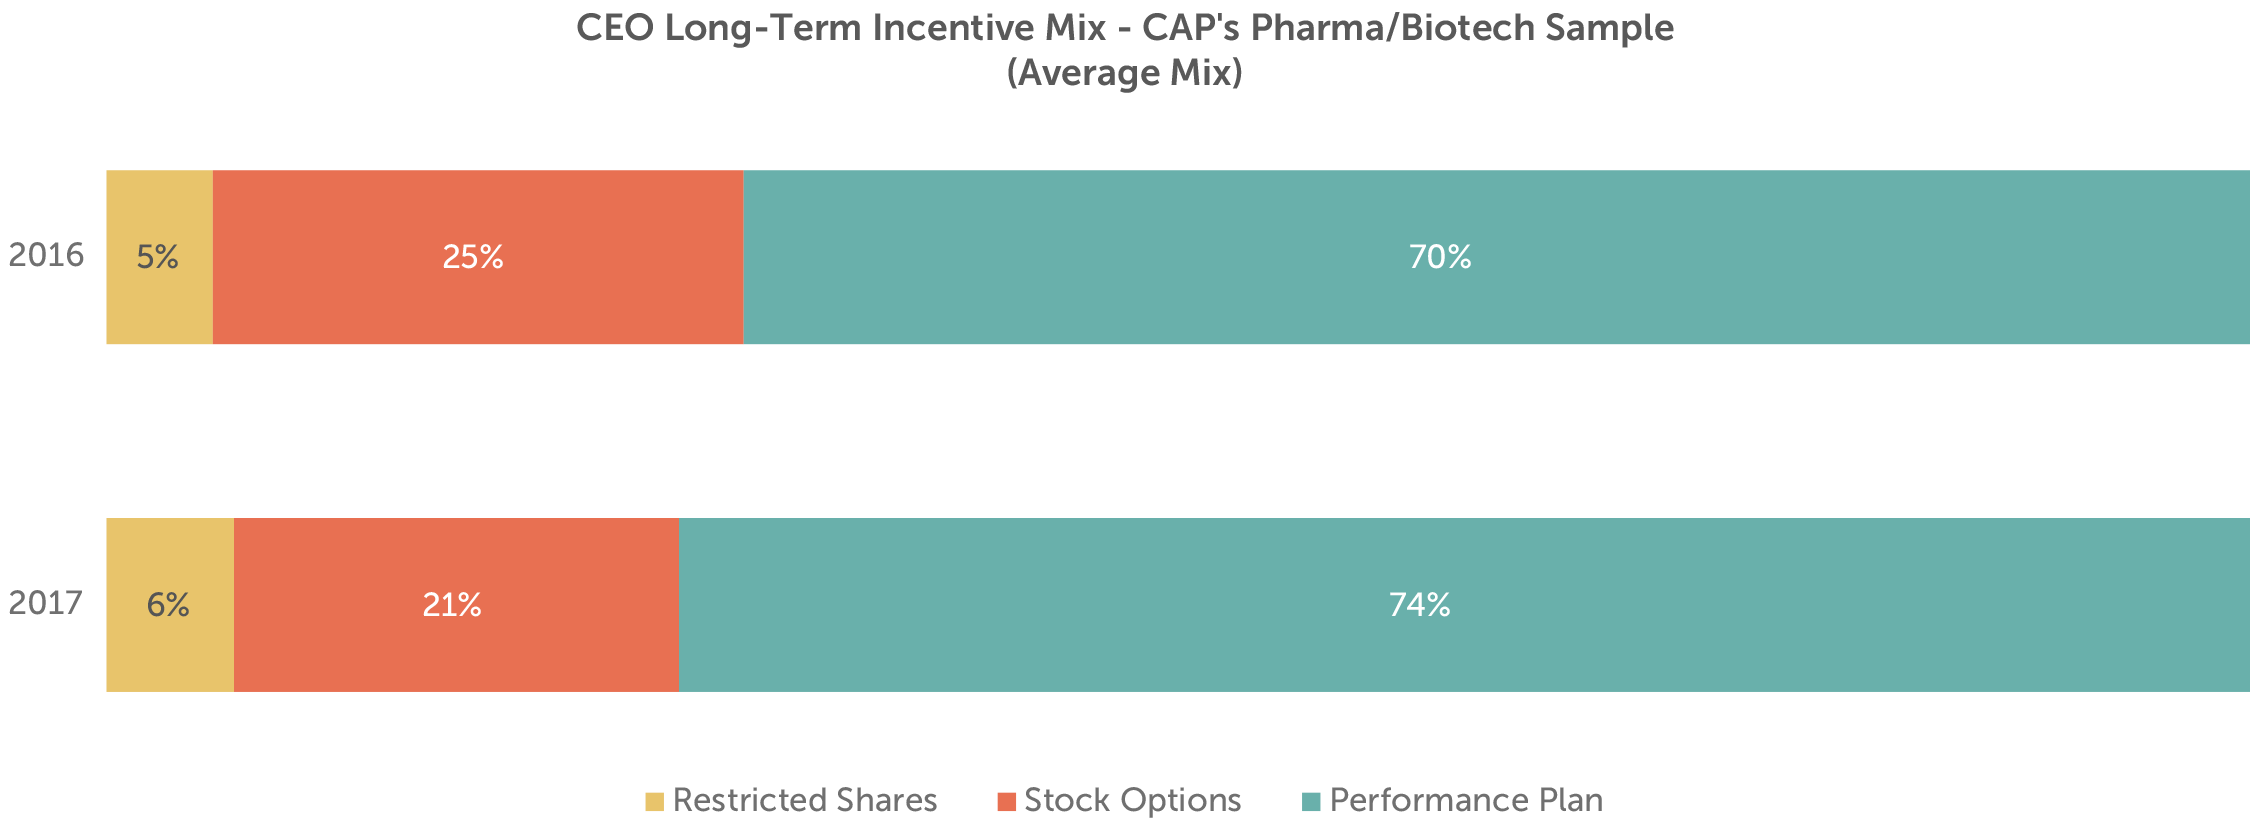
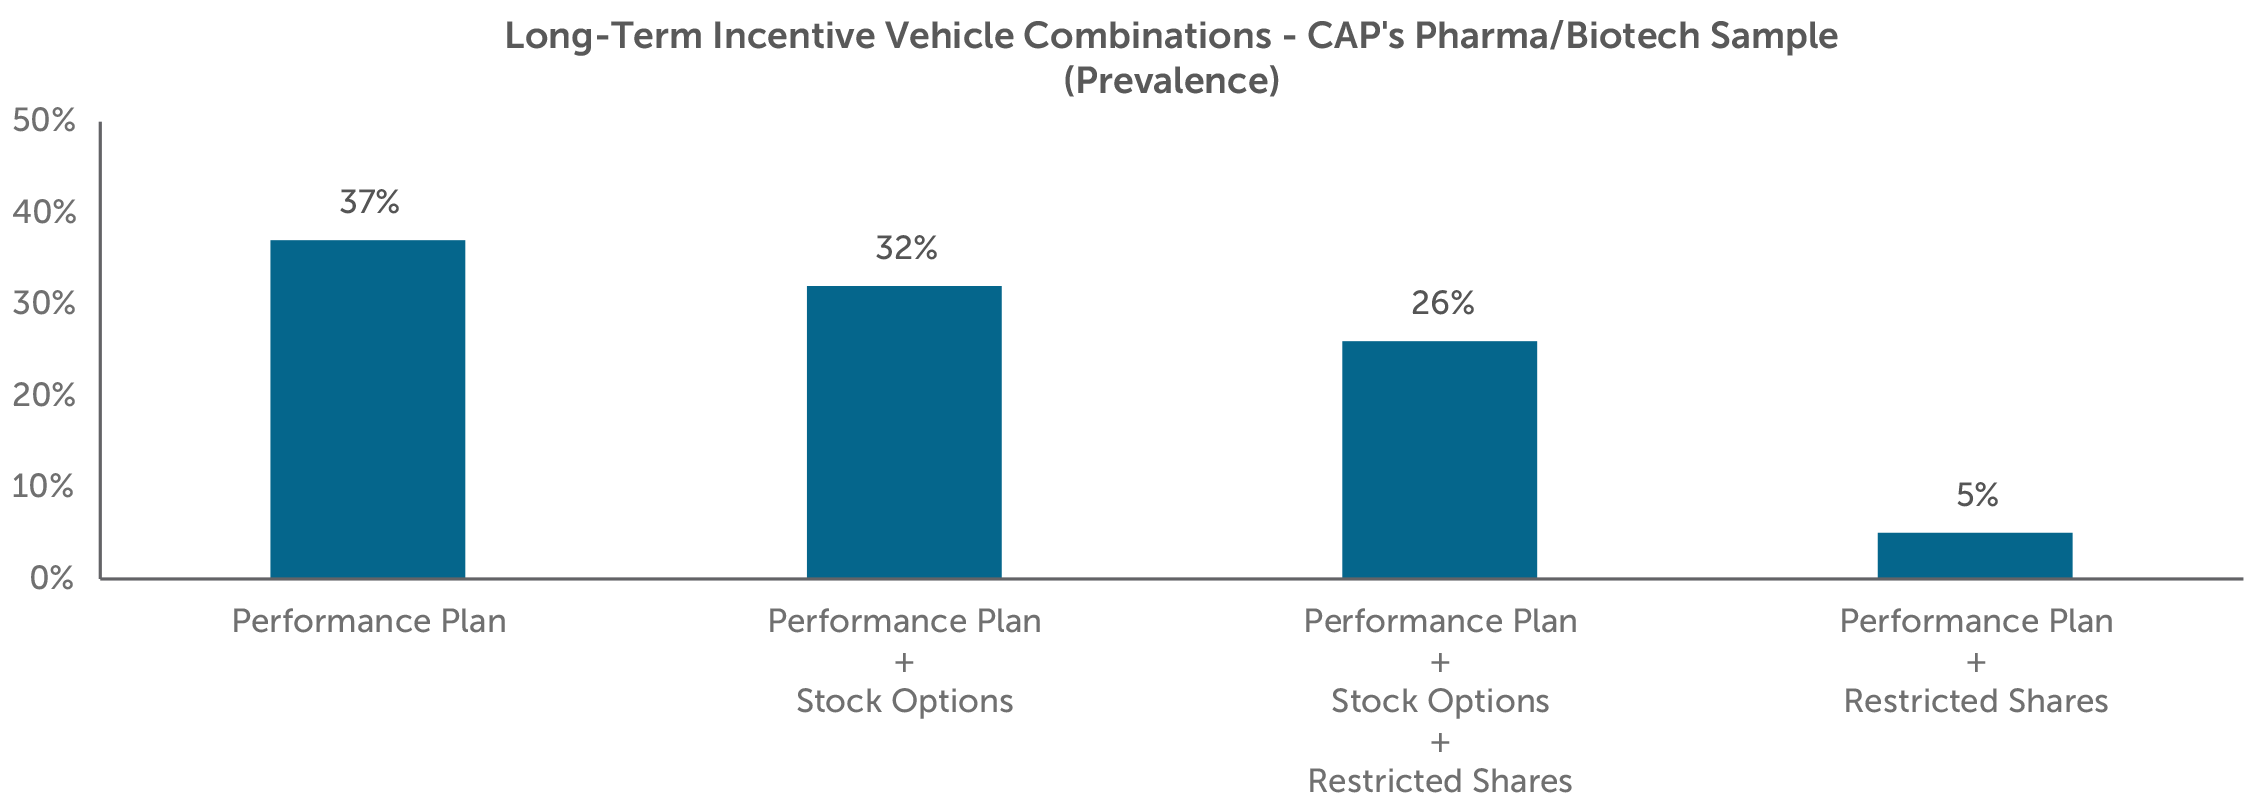
Most of the companies in CAP’s Pharma/Biotech sample supplement the use of a performance plan with stock options (32% of CAP’s Pharma/Biotech sample), restricted shares (5%), or both stock options and restricted shares (26%).
Long-Term Incentive Performance Metrics
While annual incentives emphasize short-term growth and profitability, long-term incentives generally encourage and reward long-term value creation. 100% of the companies in CAP’s Pharma/Biotech sample use relative TSR or absolute share price as a performance plan performance metric. Most companies in CAP’s Pharma/Biotech sample use TSR as one of several weighted metrics or as a modifier.
Even though shareholder return metrics are ubiquitous among CAP’s Pharma/Biotech sample, they are certainly not the only metrics used. In fact, 89% of the companies in CAP’s Pharma/Biotech sample also use one or more of net income, revenue, cash flow, and operating income in their long-term performance plan.
Looking Ahead
2018 has gotten off to a good start. For the first quarter of 2018, median revenue growth for CAP’s Pharma/Biotech sample was slightly below full-year 2017 growth (4% vs. 6%). However, median first quarter adjusted operating margin was 36%, four percentage points better than 2017’s median of 32%. A decrease in the U.S. corporate tax rate influenced adjusted EPS growth among CAP’s Pharma/Biotech sample, which was 12% at median for the first quarter. Median first quarter TSR for CAP’s Pharma/Biotech sample was -3%, close to both the S&P Global 1200 (-2%) and the S&P 500 (-1%). We expect companies and compensation committees to continue to align executive compensation with overall performance.
We are not surprised by the consistency in incentive plan design and use of similar performance metrics given the continued focus of Pharmaceutical and Biotechnology companies on R&D and strategic priorities to support revenue growth and profitability. Companies in the industry will continue to face challenges, including increased competition and uncertainty surrounding drug pricing and healthcare reform. Companies and compensation committees will continue to evaluate their incentive plan designs to ensure alignment with their organizational strategies and in light of broader market and regulatory developments.
Additional Information – New CEO Pay Ratio Disclosure
Thirteen of the companies in CAP’s Pharma/Biotech sample were required to disclose the ratio of their CEO pay to that of the median employee in 2018. The reported CEO pay ratios among CAP’s Pharma/Biotech sample ranged from 62:1 to 452:1 with a median ratio of 169:1. Given the flexibility that companies have in the methodology and assumptions used to calculate the ratio, comparisons of ratios between companies are less meaningful. To date, institutional investors and proxy advisory firms have not used disclosed CEO pay ratios to inform their voting decisions. We may see some year-over-year comparisons in the second year of disclosure.
For questions or more information, please contact:
Kelly Malafis Partner [email protected] 212-921-9357
Lauren Peek Principal [email protected] 212-921-9374
Kyle Eastman Associate [email protected] 212-921-9362
Michael Bonner Associate [email protected] 646-486-9744
Diane Lee and Joshua Hovden provided research assistance for this report.
Pharmaceutical / Biotechnology Companies – Total Sample
- AbbVie Inc.
- Allergan plc
- Amgen Inc.
- AstraZeneca PLC
- Biogen Inc.
- Bristol-Myers Squibb Company
- Celgene Corporation
- Eli Lilly and Company
- Gilead Sciences, Inc.
- GlaxoSmithKline plc
- Johnson & Johnson
- Merck & Co., Inc.
- Mylan N.V.
- Novartis AG
- Pfizer Inc.
- Roche Holding AG
- Sanofi
- Shire plc
- Teva Pharmaceutical Industries Limited
This report summarizes 2017 CEO pay and performance and incentive compensation practices for a sample of 19 public Small Pharmaceutical and Biotechnology companies with revenues between $600M and $6B (“CAP’s Small Pharma/Biotech Sample”). Among companies in our sample, median revenue was $1.5B.
Key Takeaways
- 2017 annual bonus payout, at median, was 113% of target and aligns with the strong median revenue growth of nearly 10%.
- Companies tend to focus annual incentive payouts on revenue and pipeline development vs. profits as a significant investment in R&D could negatively impact profits in the short term.
- Stock options reflect nearly 45% of the long-term incentive (LTI) mix while performance-based LTI reflects only 30% of the mix indicating that these companies may have high growth expectations but find it challenging to set credible long-term goals.
- We expect companies will continue to face challenges as they focus on developing a product pipeline in a highly competitive environment.
2017 Financial and TSR Performance
| Sample | 1-Year Median Performance | ||
| Revenue Growth | Operating Income Growth | Total Shareholder Return | |
| CAP’s Small Pharma/Biotech Sample | +9% | -4% | +2% |
| S&P MidCap 400 | +7% | +7% | +14% |
2017 financial results were mixed for CAP’s Small Pharma/Biotech Sample. While sales grew by nearly 10% versus 2016, operating income declined by 4%. Small pharmaceutical and biotechnology companies tend to be focused on developing a robust pipeline which requires a significant investment in R&D that could impact operating results.
Median 1-year total shareholder return (TSR) for the period ending December 31, 2017 was 2%. This represents a significant improvement over the 1-year period ending December 31, 2016 (when median total shareholder return was -30%) but lags median total shareholder return among S&P MidCap 400 companies. Uncertainty around product approvals and pipeline can also cause stock price volality in the industry.
CEO Annual Incentive Payouts and Plan Design
2017 median CEO bonus payout was 113% of target. This reflects a 22 percentage point increase from prior year when median payout was 91% of target.
The year over year increase in CEO bonus payouts aligns with strong top line growth for CAP’s Small Pharma/Biotech Sample. This is likely because revenue is the most commonly used annual incentive metric among these companies. Pipeline/strategic goals and operating income are also prevalent.
- 78% of companies use revenue
- 61% of companies use pipeline/strategic goals
- 56% of companies use operating income
Bottom line metrics like EPS and net income are less commonly used by companies in CAP’s Small Pharma/Biotech Sample than they are among larger pharmaceutical and biotechnology firms. Most companies in CAP’s Small Pharma/Biotech Sample saw a decline in net profits in 2017; 53% of companies generated a net loss.
This pay and performance relationship indicates that companies in CAP’s Small Pharma/Biotech Sample prioritize the achievement of sales growth, pipeline progress and strategic milestones over profit growth in the near term.
| Summary Statistics | Annual Incentive Payout as a % of Target – CAP’s Small Pharma/Biotech Sample | ||
| 2016 | 2017 | Change from 2016 to 2017 | |
| 75th Percentile | 124% | 147% | +23% pts |
| Median | 91% | 113% | +22% pts |
| 25th Percentile | 73% | 90% | +17% pts |
Actual Compensation for CEOs
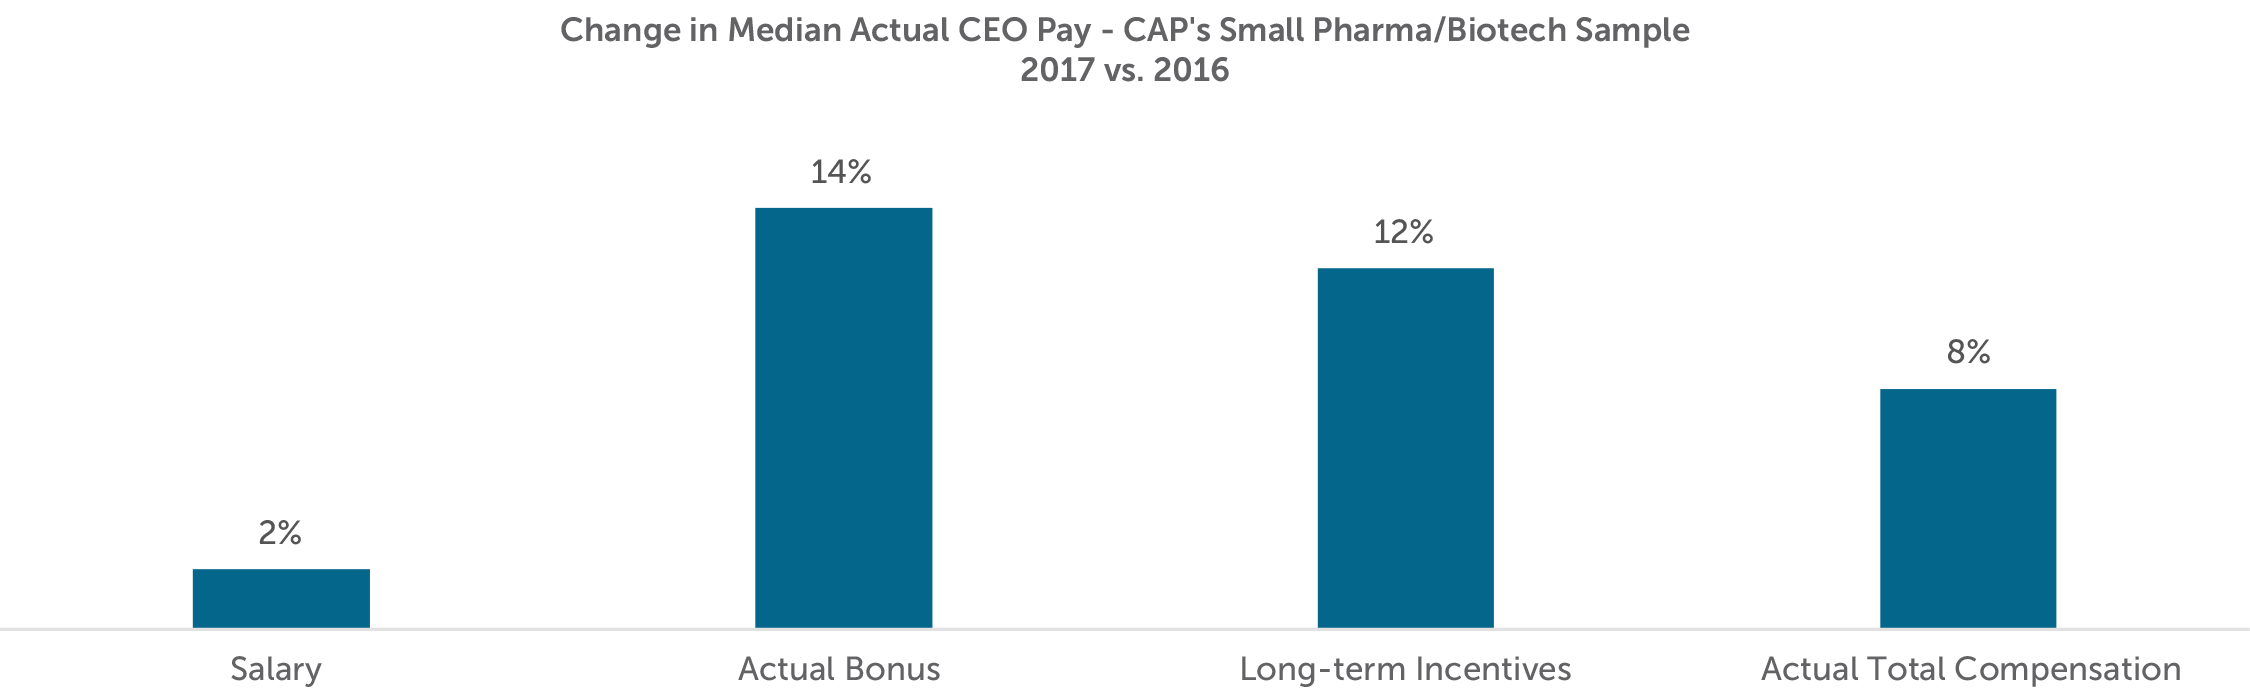
Median CEO total compensation for 2017, which includes base salary, actual bonus paid for 2017 performance and long-term incentives granted in 2017, increased 8% versus 2016. This increase was largely driven by increases to actual bonuses paid and long-term incentives granted. As previously discussed, increases in bonus payouts are directionally aligned with strong sales growth. Companies generally grant LTI to reward past and future expectations of performance and the 12% increase over 2016 levels may be more reflective of individual potential rather than only company performance.
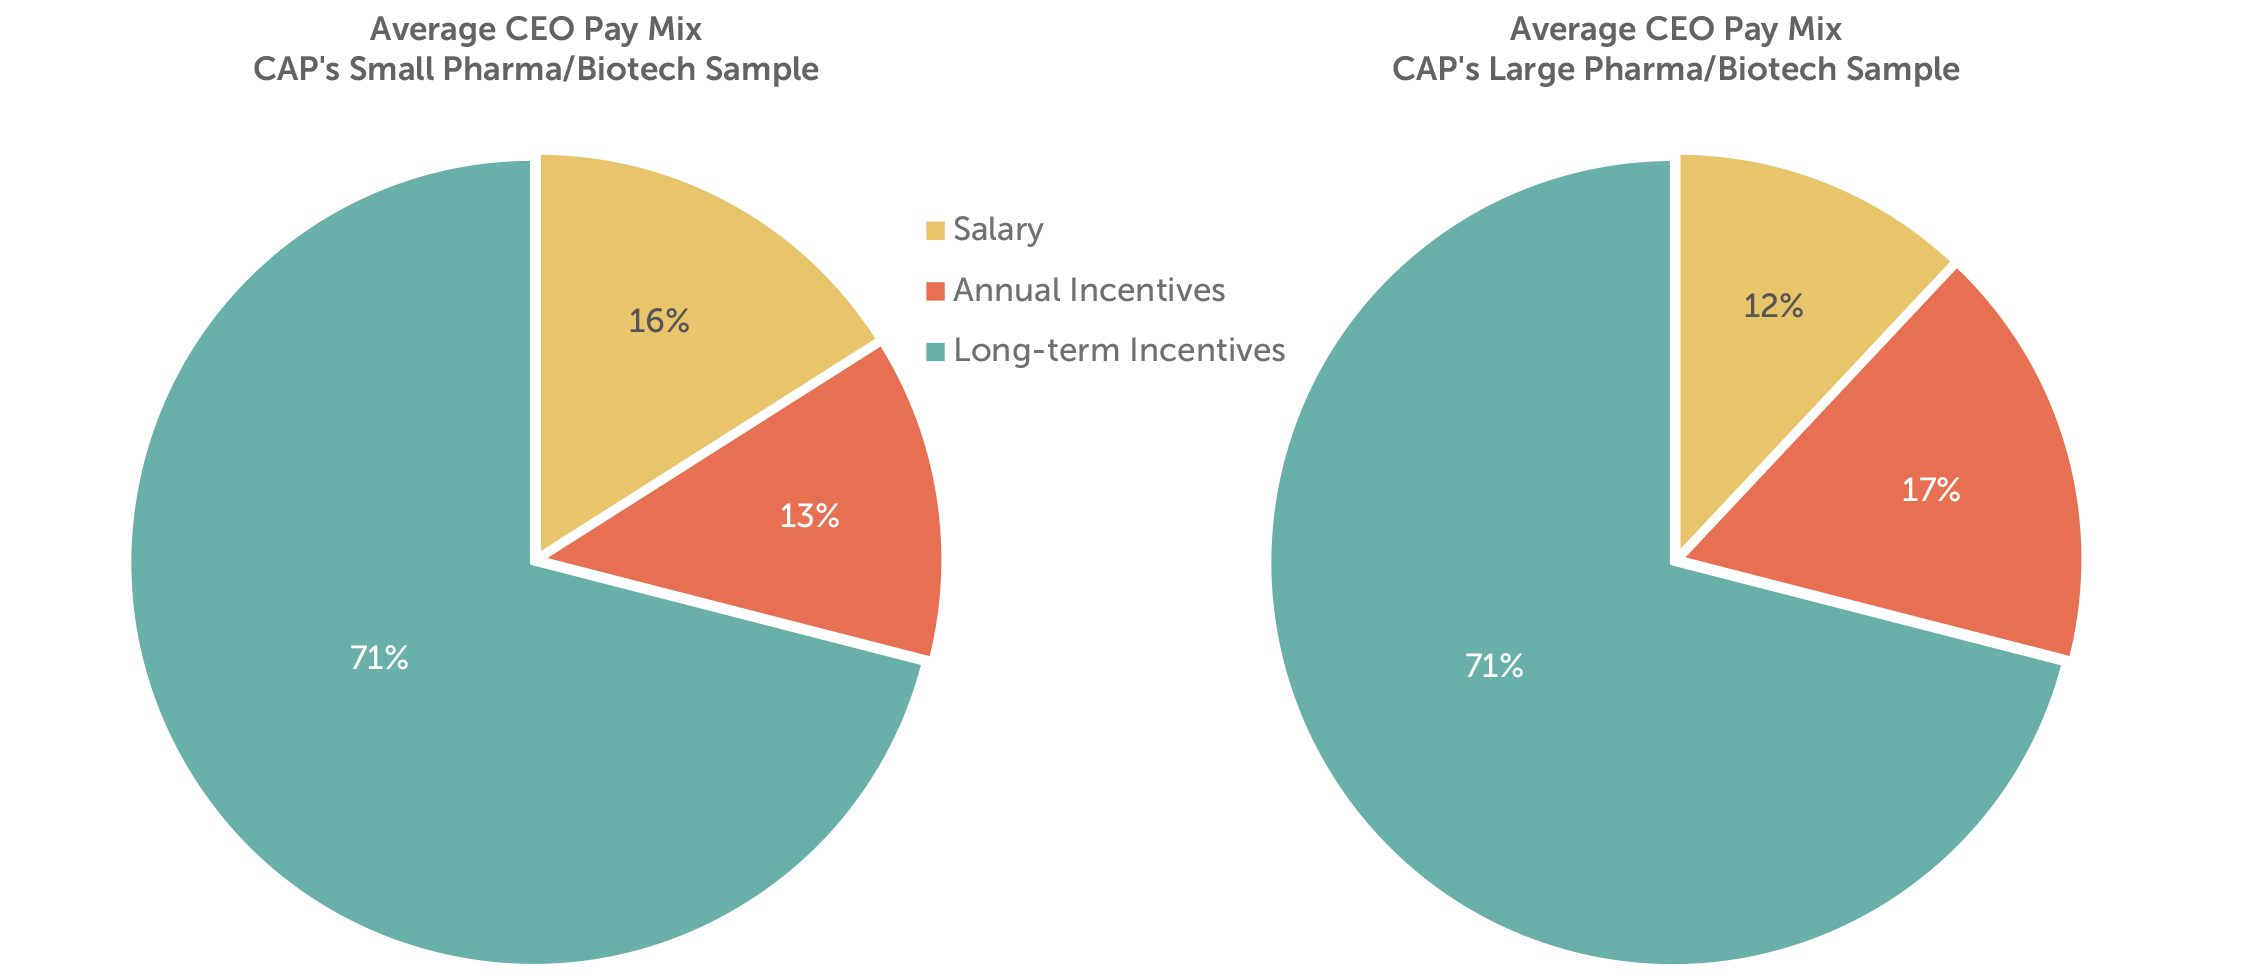
Pay Mix
CEO pay programs for companies in our sample place the greatest emphasis on long-term incentives (i.e., approximately 70% of total compensation). The companies in CAP’s Small Pharma / Biotech sample place more emphasis on base salary and less on annual incentives compared to larger organizations in the industry (See CAP’s Large Pharma / Biotech industry report for list of companies). Small pharmaceutical and biotechnology companies may place less emphasis on annual incentives as regulatory and commercial uncertainty may limit their ability to set credible annual performance goals.
Long-term Incentive Mix and Long-term Performance Plan Design
Long-term incentive vehicles can be bucketed into three broad categories: (1) time-vested restricted shares (or units); (2) time-vested stock options (or stock appreciation rights); and (3) long-term performance plans. Performance plans include performance shares (or units), performance-vested stock options, and performance-based cash compensation with multi-year performance criteria.
The companies in CAP’s Small Pharma/Biotech Sample place a greater emphasis on stock options than performance plans. This is a significant departure from larger firms in the industry; 30% of long-term incentives are delivered through performance plans versus approximately 75% at the larger firms. This emphasis on stock options among small pharmaceutical and biotechnology companies is likely due to high growth expectations as well as difficulty setting longer term goals. Larger companies may not have a similar expectation of stock price appreciation; additionally, they may have more scrutiny from shareholders and proxy advisors to have a greater portion (at least 50%) of total LTI delivered in the form of a performance plan.
Time-based restricted stock or units, which serve as a retentive tool for executives and other key talent, is approximately 25% of total long-term incentives. This is generally consistent with broader market practice.
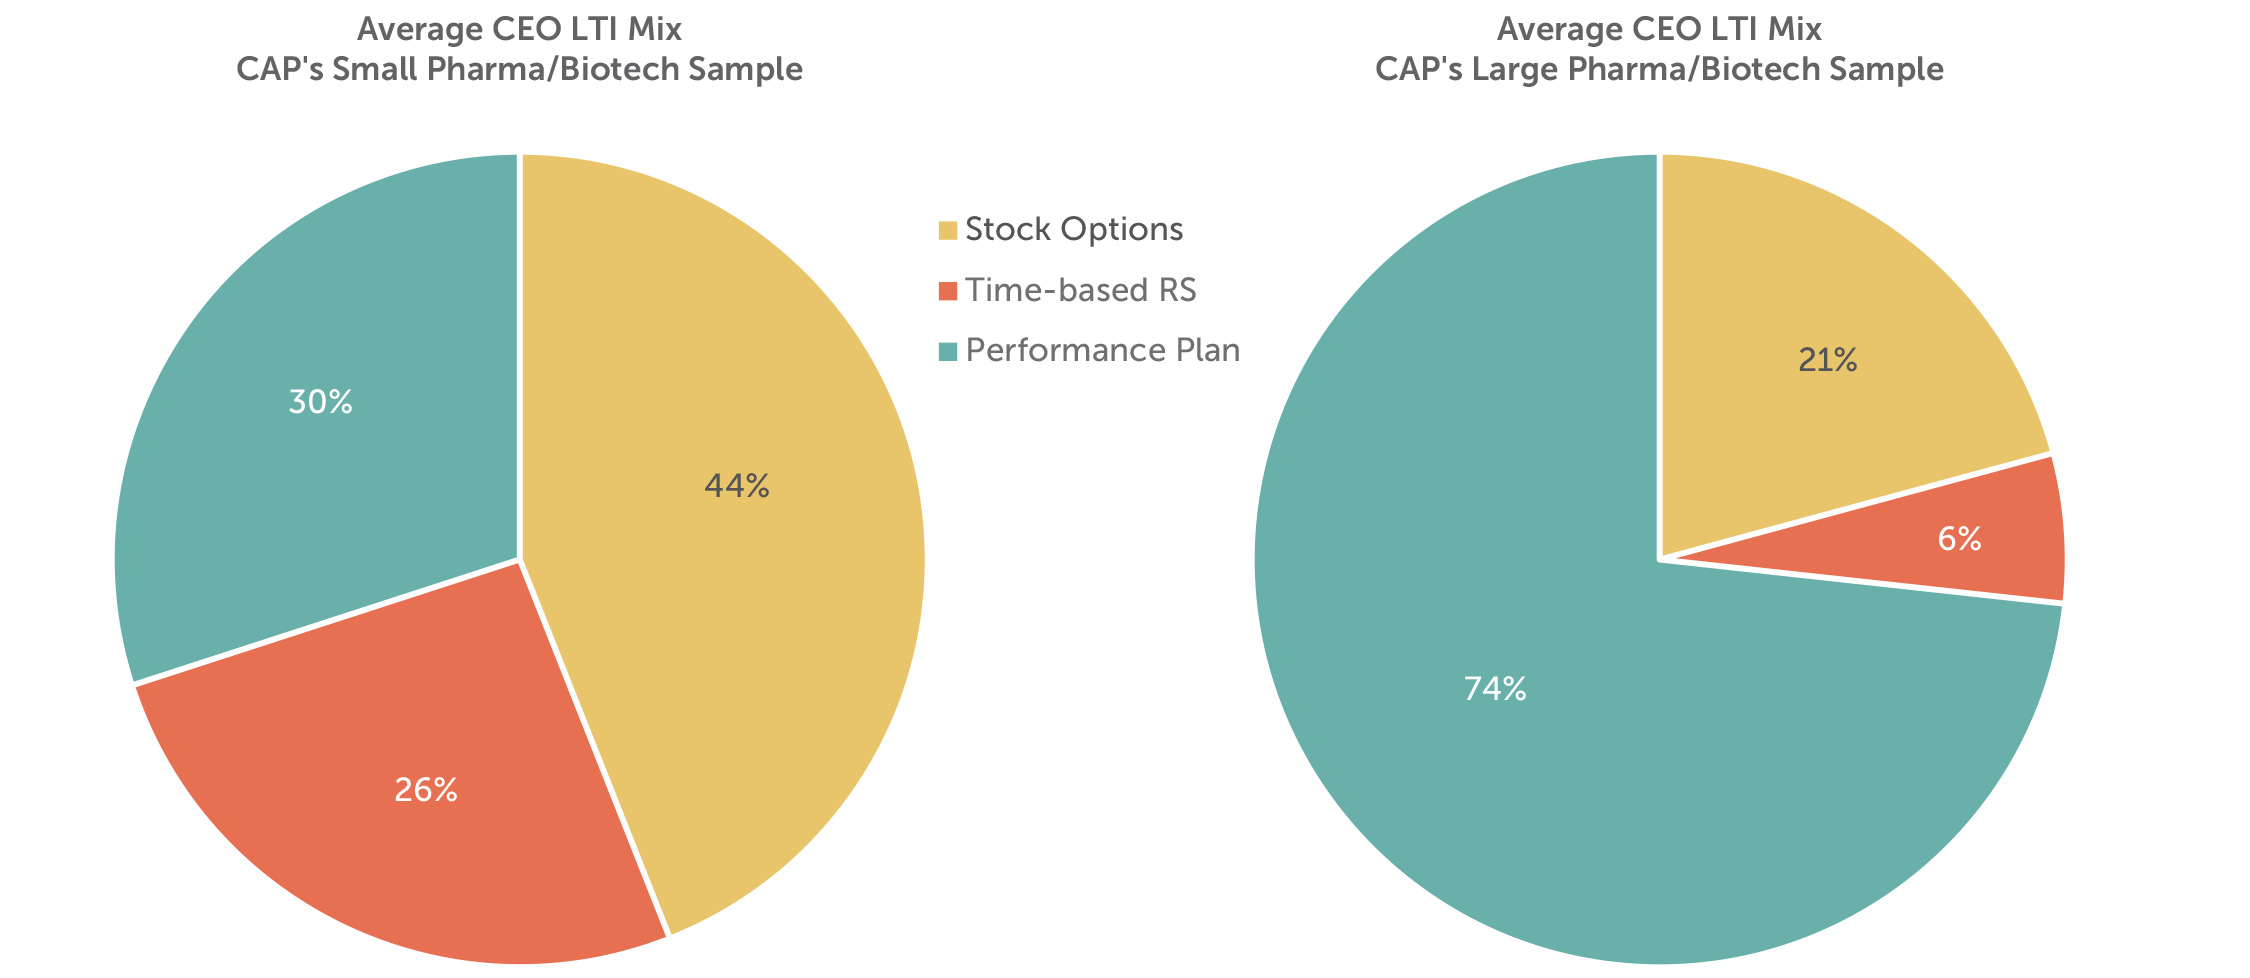
Although performance plans reflect less than 1/3 of total LTI, nearly 70% of the companies in CAP’s Small Pharma/Biotech Sample have a long-term performance plan in place. Among these companies, relative TSR and revenue are the most common metrics with 62% of companies using each metric. TSR is most commonly measured relative to an industry index (e.g., the NASDAQ Biotechnology Index). In the broader market, a profit-based metric, typically EPS, is the second most common metric (behind TSR); use of revenue in a long-term plan is much less prevalent. Again, this suggests that the companies in CAP’s Small Pharma/Biotech Sample are more focused on growth than profitability and may face disclosure challenges with respect to profit goals, particularly for companies that generate net losses.
Looking Ahead
Following the improvement in total shareholder return in 2017, stock prices among CAP’s Small Pharma/Biotech Sample have dipped in the first five months of 2018. While this is likely due, in part, to a broader market correction, it may also reflect continued scrutiny of drug pricing and increased competition. While these factors pose challenges in the pharmaceutical and biotechnology industries, expectations for increased merger activity and the potential for deregulation could create tailwinds to bolster performance in the second half of the year.
We expect companies in CAP’s Small Pharma/Biotech Sample to maintain incentive plans that reward executives for investing in R&D, developing the pipeline and growing sales through existing and new products.
Additional Information – New CEO Pay Ratio Disclosure
Beginning with 2018 filings, companies are required to disclose the ratio of their CEO pay to that of the median employee. To date, 16 of the 19 companies in CAP’s Small Pharma/Biotech Sample have disclosed ratios. Among these companies, the reported CEO pay ratios ranged from 13:1 to 215:1 with a median ratio of 89:1. Given the flexibility that companies had in the methodology and assumptions used to calculate the ratio, comparisons of ratios between companies is less meaningful. To date, institutional investors and proxy advisory firms have not used disclosed CEO pay ratios to inform their voting decisions. We may see some year over year comparisons in the second year of disclosure.
For questions or more information, please contact:
Kelly Malafis Partner [email protected] 212-921-9357
Lauren Peek Principal [email protected] 212-921-9374
Michael Bonner Associate [email protected] 646-486-9744
Kyle Eastman Associate [email protected] 212-921-9362
Joanna Czyzewski, Matt McLaughlin, Amanda Miles and Joshua Hovden provided research assistance for this report.
CAP’s Small Pharma/Biotech Sample
- Akorn Inc.
- Alexion Pharmaceuticals Inc.
- Alkermes plc
- AMAG Pharmaceuticals Inc.
- BioMarin Pharmaceutical Inc.
- Catalent Inc.
- Endo International plc
- Horizon Pharma plc
- Impax Laboratories Inc.
- Incyte Corporation
- Jazz Pharmaceuticals plc
- Lannett Company Inc.
- Mallinckrodt Public Limited Company
- Myriad Genetics Inc.
- Opko Health Inc.
- Perrigo Co
- Regeneron Pharmaceuticals Inc.
- United Therapeutics Corporation
- Vertex Pharmaceuticals Inc.
Compensation Advisory Partners (CAP) examined 2016 executive pay and company performance at 19 large pharmaceutical and biotechnology companies with median revenue of approximately $23B. CAP’s study includes 12 U.S. companies and 7 non-U.S. companies.
2016 Overview
In 2016, large pharmaceutical and biotechnology companies generated strong financial results; however, a challenging environment and the uncertain outlook for the industry drove total shareholder returns (TSR) below those of the S&P 500. The high cost of R&D, loss of exclusivity, and increased regulation continue to challenge growth and profitability, while the current U.S. administration’s focus on drug pricing, healthcare reform, and global policy create an air of uncertainty that could positively or negatively impact the industry.
In response to these difficulties, companies have focused on expense management, strategic alliances, and mergers and acquisitions to grow sales and manage costs. Pharmaceutical and biotechnology companies are also looking to different strategies, such as investing in biologics, to position themselves for growth in the future. We have seen incentive plan design in the pharmaceutical and biotechnology industry evolve to focus executives on achieving these objectives by rewarding them based on key performance metrics, such as sales, profits, pipeline development, and strategic initiatives, that together influence long-term shareholder value.
2016 Financial and TSR Performance
Sales and EPS among companies in our sample grew by +6% and +7%, respectively, at median. Pharmaceutical and biotechnology companies also had strong operating performance in 2016. The companies in our sample improved operating margin from 26% in 2015 to 27% in 2016. U.S. companies in particular saw an improvement in operational results in 2016, improving profit margin by 3 percentage points vs. 2015.
While the Pharma industry experienced stronger top and bottom line growth than the S&P 500 in 2016, median TSR results among companies in the industry (-10%) were lower than median TSR results among S&P 500 companies (+13%). Following several years of above-market stock price performance, 1-year TSR performance, in part, may have been depressed by the focus on drug pricing during the 2016 presidential election and the uncertainty centered around how the new administration’s policies will impact the industry.
| Industry Group | Median 2016 Performance | ||
| Revenue Growth | EPS Growth | TSR | |
| CAP Total Sample (n=19) | +6% | +7% | -10% |
| U.S. Companies (n=12) | +7% | +10% | -7% |
| Non-U.S. Companies (n=7) | +4% | -3% | -15% |
| S&P 500 | +3% | +6% | +13% |
Annual Incentive Payouts and Plan Design
At median, pharmaceutical CEOs received annual incentive payouts at 121% of target for 2016 performance. These payouts are reflective of strong (i.e., above target) performance; however, they also reflect a decline versus 2015 when the median payout was 156% of target.
| Summary Statistics | Annual Incentive Payout as a % of Target | |
| 2015 | 2016 | |
| 75th Percentile | 170% | 150% |
| Median | 156% | 121% |
| 25th Percentile | 105% | 109% |
Annual incentive payouts among pharmaceutical companies are most often determined based on sales, profits, and pipeline or R&D-related goals:
- 94% of companies use sales goals
- 75% of companies use net income or EPS goals
- 75% of companies use pipeline or R&D goals
While 2016 revenue and EPS growth were generally stronger than 2015, the decline in 2016 payouts may be reflective of some pipeline challenges that companies faced during the year. Many companies in our sample also include an individual or strategic performance component, which can impact final annual incentive plan payouts.
2016 CEO Pay vs. Performance:
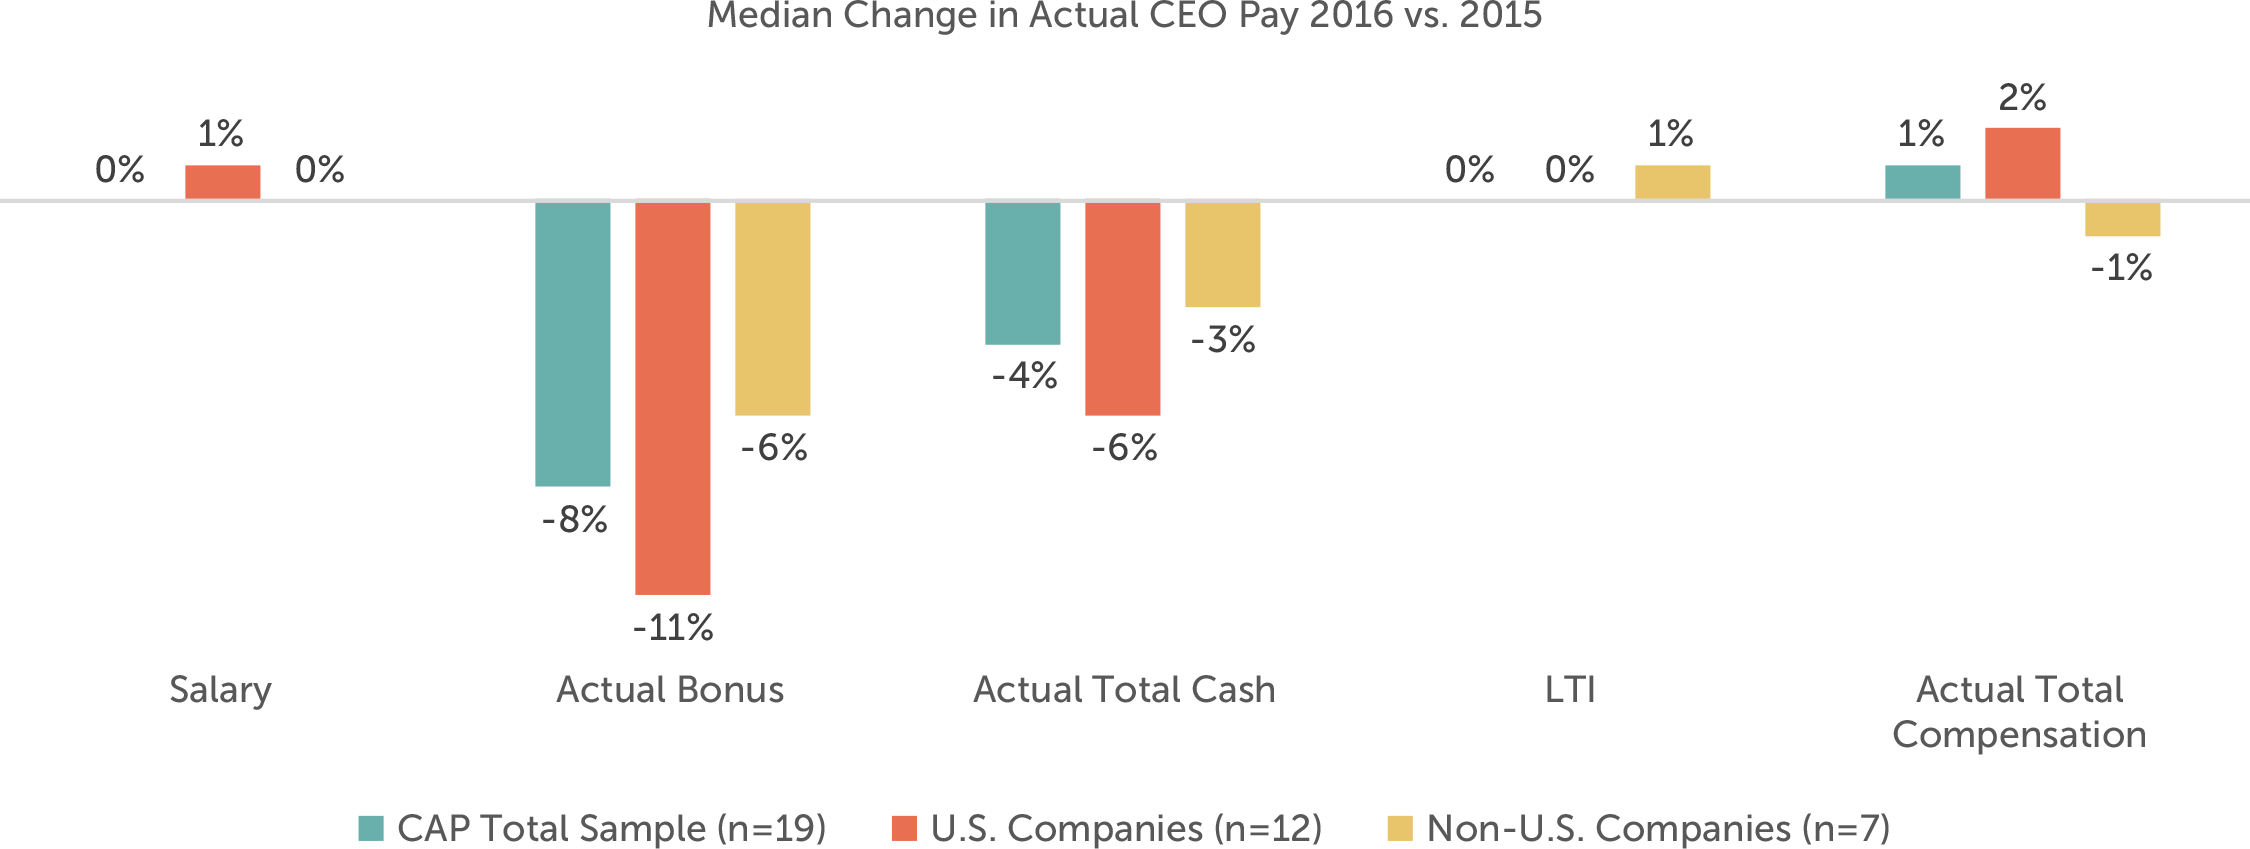
2016 actual total compensation (salary, bonus, and long-term incentives) for CEOs at large pharmaceutical and biotechnology companies was flat vs. 2015. Actual bonus payouts were generally down. Base salaries and long-term incentive awards were generally flat at median; however, several companies provided modest increases in base salaries and more substantial increases in long-term incentive awards, resulting in minimal change (+1%) in actual total compensation at median. Overall, actual compensation levels seem to align with a holistic view of industry performance, where revenue and EPS growth were strong, but stock prices were down.
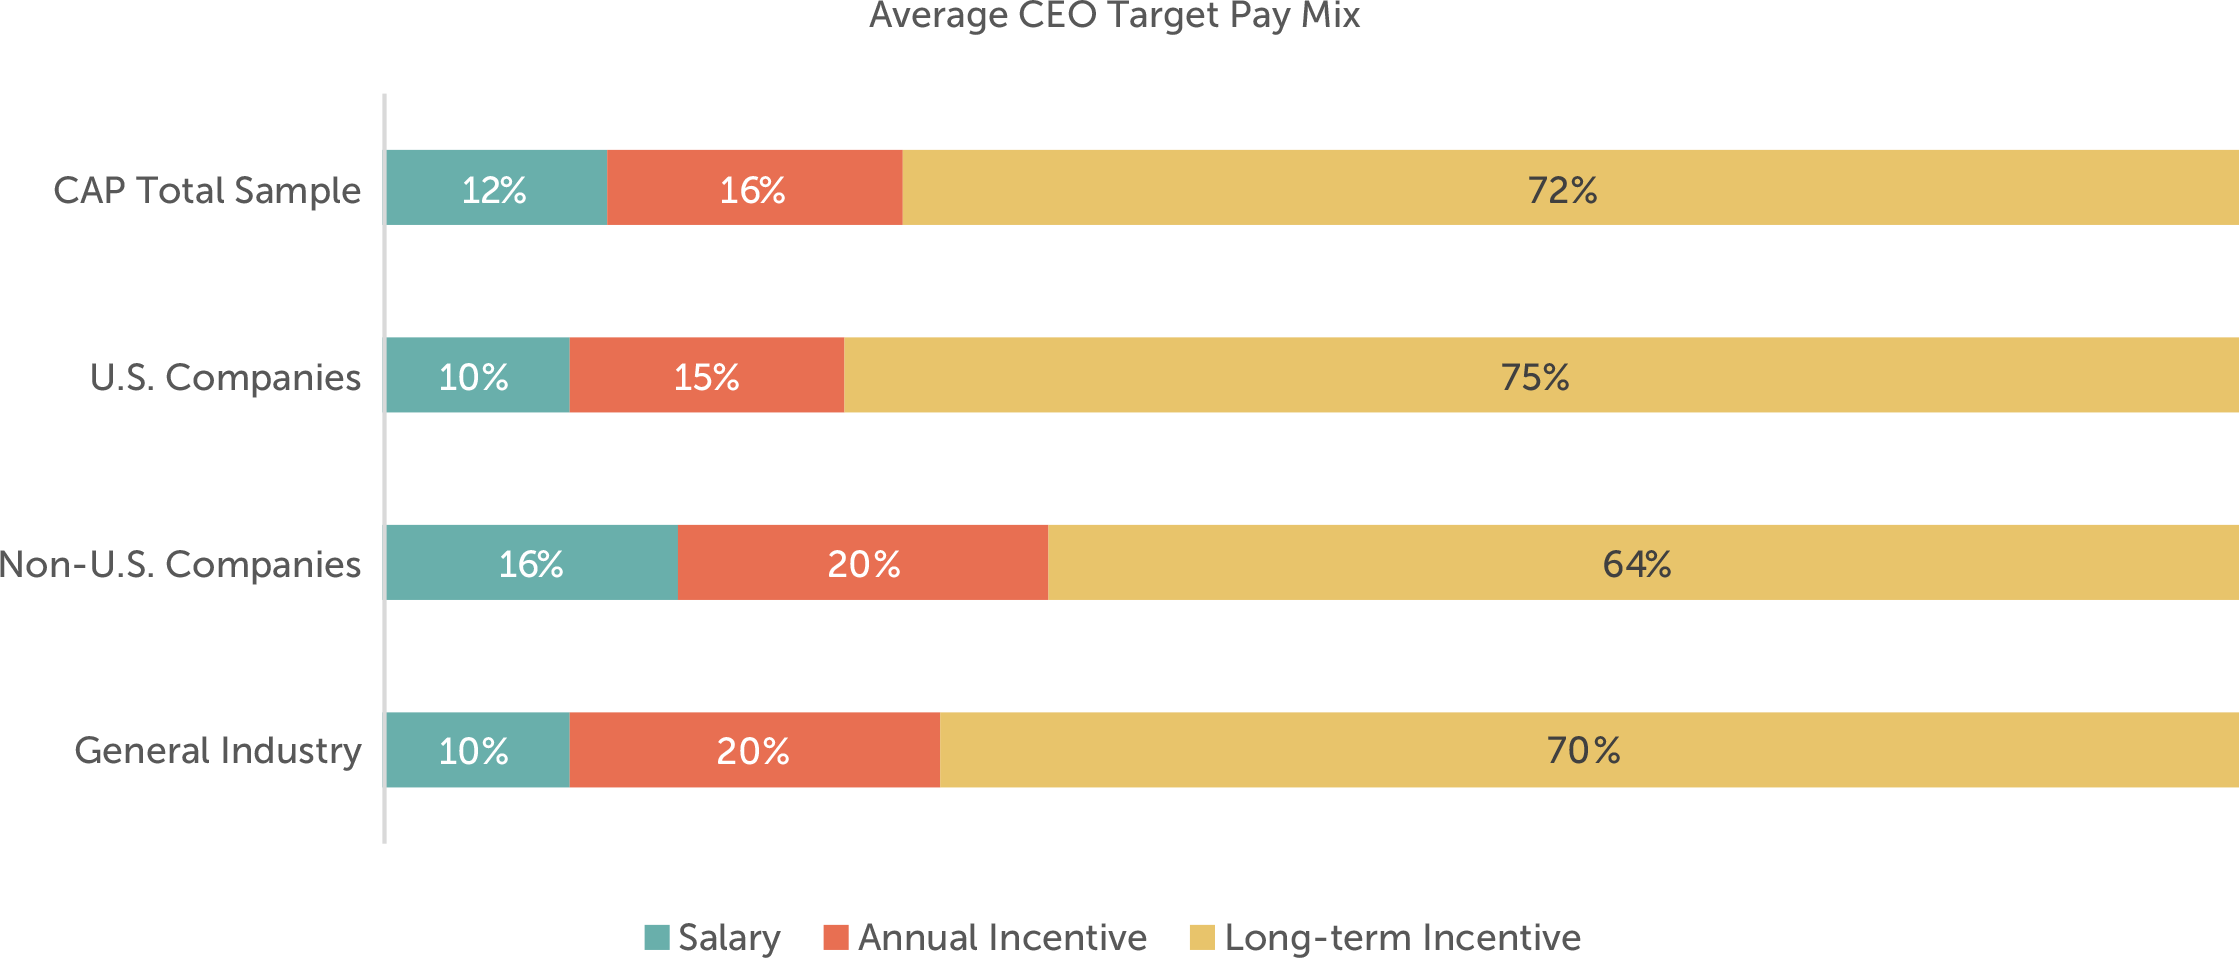
Pay Mix
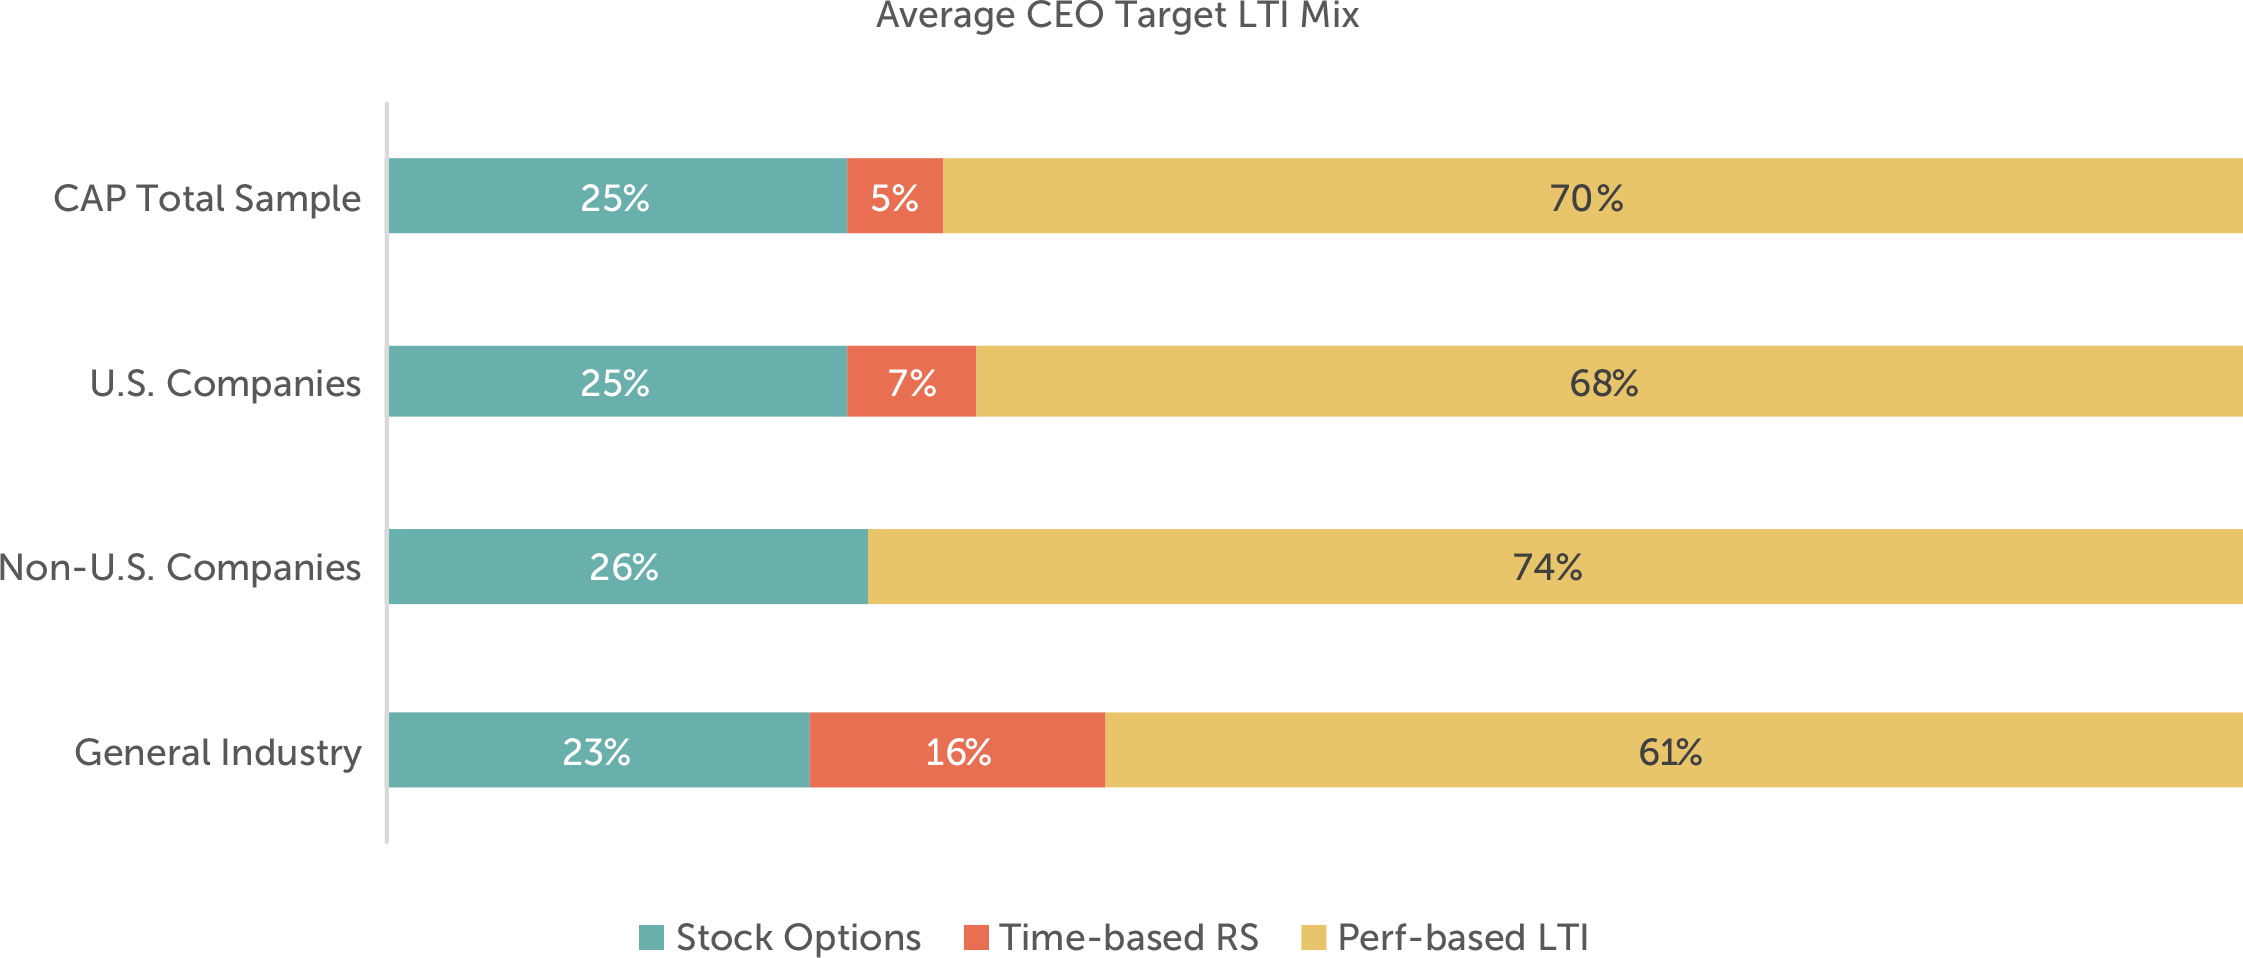
Overall, pay mix for CEOs at companies in our sample is aligned with CEO pay mix in the broader U.S. market. Within the pharmaceutical industry, non-U.S. companies tend to place a greater emphasis on base salaries than U.S. companies (i.e., 16% vs. 10% of total pay). U.S. pharmaceutical companies place a greater emphasis on long-term incentive awards than both non-U.S. pharmaceutical companies and U.S. general industry companies.
Long-term Incentive Mix and Long-term Performance Plan Design
While overall pay mix is consistent with general industry companies, pharmaceutical companies tend to grant a greater portion of their long-term incentive awards in performance-based vehicles and a smaller portion in time-based restricted stock or units than the broader U.S. market. The industry’s emphasis on long-term performance-based compensation creates a strong link between executive rewards and the length of product life-cycles, from drug development to product sales.
Similar to companies in the broader market, most pharmaceutical companies (88%) use relative TSR as a long-term incentive metric to align long-term performance plan payouts with the market’s view of future growth potential. Similar to annual incentives, long-term performance-based vehicles also tend to include sales and bottom-line income goals:
- 53% of companies use sales goals
- 41% of companies use net income or EPS goals
These metrics focus executives on long-term growth through new product sales or acquisitions while also maintaining profitability.
Looking Ahead for Executive Compensation in the Pharma Industry
Even as companies across industries are in a “wait and see” period as the current administration begins to tackle executive compensation-related issues, the pharmaceutical industry faces its own unique environment, where setting incentive plan goals is becoming ever more challenging.
The outlook for the U.S. market is growing increasingly complex as the industry faces intense scrutiny and the current administration tries to overhaul the Affordable Care Act. At the same time, the industry has experienced strong stock price performance to date in 2017, indicating the market’s continued confidence in future growth despite regulatory pressure and public scrutiny over drug prices.
In an industry where incentive plans are meant to reward prior performance, but the stock market is always looking forward, companies must continue to focus on setting incentive plan goals that reward executives for driving innovation and growth and therefore, align them with long-term shareholder returns.
For questions or more information, please contact:
Kelly Malafis Partner [email protected] 212-921-9357
Lauren Peek Principal [email protected] 212-921-9374
Michael Bonner Associate [email protected] 646-486-9744
Kyle Eastman Associate [email protected] 212-921-9362
Joanna Czyzewski and Whitney Cook provided research assistance for this report.
Pharmaceutical / Biotechnology Companies – Total Sample
AbbVie Inc.
Allergan plc
Amgen Inc.
AstraZeneca plc
Biogen Inc.
Bristol-Myers Squibb Co
Celgene Corp
Eli Lilly and Co
Gilead Sciences Inc.
GlaxoSmithKline plc
Johnson & Johnson
Merck & Co Inc.
Mylan N.V.
Novartis AG
Pfizer Inc.
Roche Holdings AG
Sanofi S.A.
Shire plc
Teva Pharmaceutical Industries Ltd
Companies use annual bonuses as a tool to reward executives for achieving short-term financial and strategic goals. Setting appropriate annual performance goals is essential to establishing a link between pay and performance. Goals should achieve a balance between rigor and attainability to motivate and reward executives for driving company performance and creating returns for shareholders.
Key Takeaways:
- Based on our analysis of actual incentive payouts over the past 6 years, the degree of difficulty, or “stretch”, embedded in annual performance goals translates to:
- A 95% chance of achieving at least Threshold performance
- A 75% chance of achieving at least Target performance
- A 15% chance of achieving Maximum performance
- This pattern indicates that target performance goals are challenging, but attainable, and maximum goals are achievable through highly superior performance
- The majority of companies use two or more metrics when assessing annual performance
- Annual incentive payouts have been directionally linked with earnings growth over the past 6 years
Summary of Findings
Plan Design
For the purposes of this study, we categorized annual incentive plans as either goal attainment or discretionary. Companies with goal attainment plans define and disclose threshold, target and maximum performance goals and corresponding payout opportunities. Alternatively, companies with discretionary plans do not define the relationship between a particular level of performance and the corresponding payout. Discretionary programs provide committees with the opportunity to determine payouts based on a retrospective review of performance results.
| Annual Incentive Plan Type | |||
| Industry | Sample Size | Goal Attainment | Discretionary |
| Auto | n= 8 | 100% | 0% |
| Consumer Discretionary | n= 10 | 90% | 10% |
| Consumer Staples | n= 12 | 67% | 33% |
| Financial Services | n= 12 | 17% | 83% |
| Healthcare | n= 9 | 89% | 11% |
| Industrials | n= 14 | 71% | 29% |
| Insurance | n= 12 | 67% | 33% |
| IT | n= 12 | 83% | 17% |
| Pharma | n= 10 | 80% | 20% |
| Total | 72% | 28% | |
Consistent with the findings from our study conducted in 2014, 72% of sample companies have goal attainment plans. Our study focuses on these companies.
Performance Metrics
Most companies (61%) use 3 or more metrics to determine bonus payouts. This reflects a shift from 2014, where 48% of companies used 3 or more metrics. Companies annually review metrics to ensure that they align with the business strategy.
Many companies use financial metrics such as revenue and profitability, which are indicators of market share growth and stock price performance. Some bonus plans also include strategic metrics, which incentivize executives to achieve goals that may contribute to long-term success, but may not be captured by short-term financial performance. Companies in the pharmaceutical industry often use strategic goals, such as pipeline development. Similarly, companies with large manufacturing operations often use quality control metrics.
| # of Metrics Used in Goal Attainment Plan | ||||
| Industry | 1 Metric | 2 Metrics | 3 Metrics | 4+ Metrics |
| Auto | 13% | 13% | 25% | 50% |
| Consumer Discretionary | 11% | 44% | 45% | 0% |
| Consumer Staples | 0% | 37% | 38% | 25% |
| Financial Services | 0% | 50% | 50% | 0% |
| Healthcare | 0% | 38% | 12% | 50% |
| Industrials | 20% | 40% | 20% | 20% |
| Insurance | 37% | 13% | 25% | 25% |
| IT | 10% | 30% | 40% | 20% |
| Pharma | 0% | 0% | 63% | 37% |
| Total | 11% | 28% | 34% | 27% |
Pay and Performance Scales
Compensation committees annually approve threshold, target, and maximum performance goals, and corresponding payout opportunities, for each metric in the incentive plan. Target performance goals are typically set in line with the company’s internal business plan. Executives most often earn 50% of their target bonus opportunity for achieving threshold performance and 200% for achieving maximum performance. Actual payouts are often interpolated between threshold and target and target and maximum.
Annual Incentive Plan Payouts Relative to Goals
All Companies
Based on CAP’s analysis, companies paid annual bonuses 95% of the time. Payouts for the total sample are distributed as indicated in the following charts:
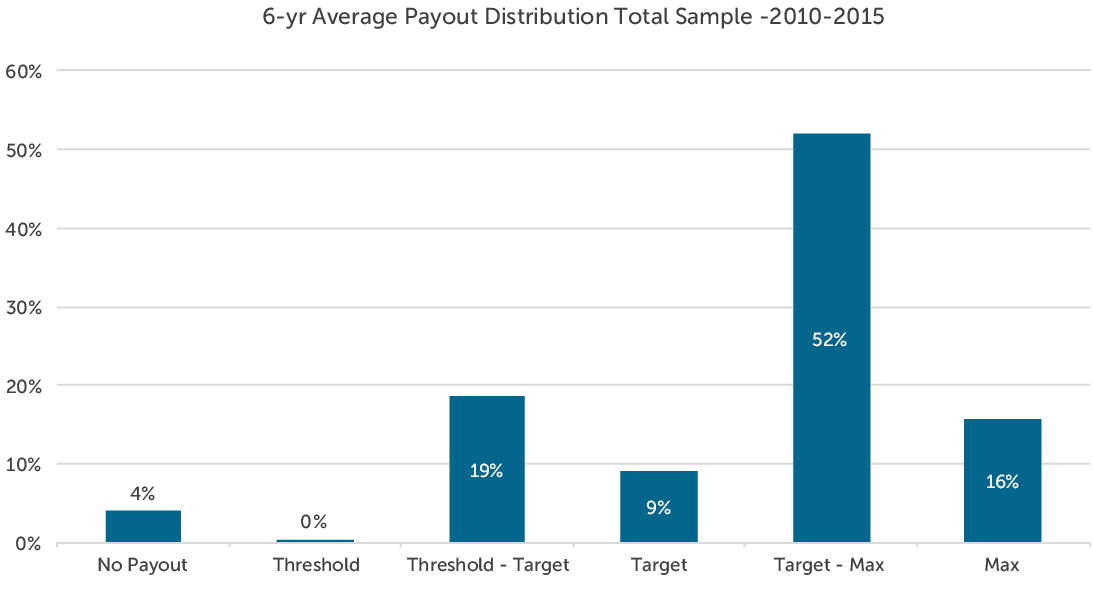
This payout distribution indicates that committees set annual performance goals with a degree of difficulty or “stretch” such that executives have:
- A 95% chance of achieving at least Threshold performance
- A 75% chance of achieving at least Target performance
- A 15% chance of achieving Maximum performance
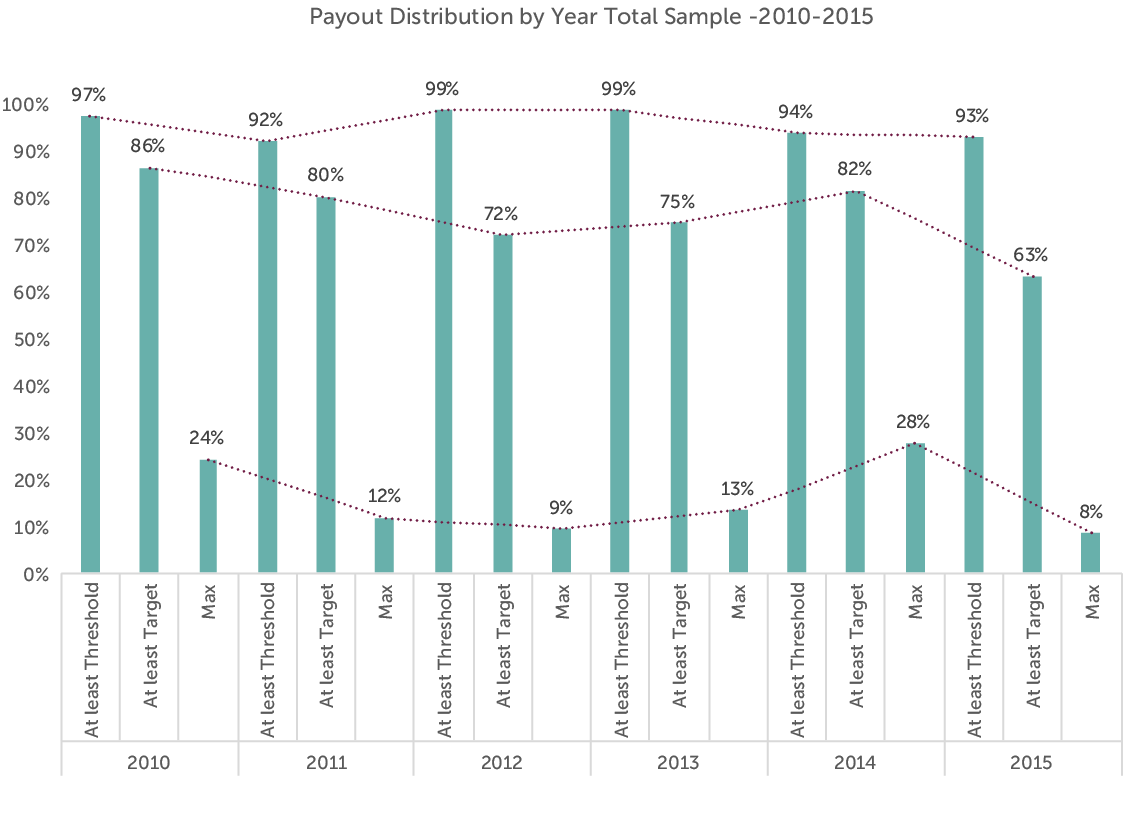
From 2010-2015, no more than 10% of companies failed to reach threshold performance in any given year. By comparison, in both 2008 and 2009, which were challenging years, approximately 15% of companies failed to reach threshold performance goals.
When looking back over 8 years (2008-2015), companies achieved at least threshold and target performance with slightly less frequency. Based on CAP’s analysis of this 8-year period, executives have:
- A 90% chance of achieving at least Threshold performance
- A 70% chance of achieving at least Target performance
- A 15% chance of achieving Maximum performance
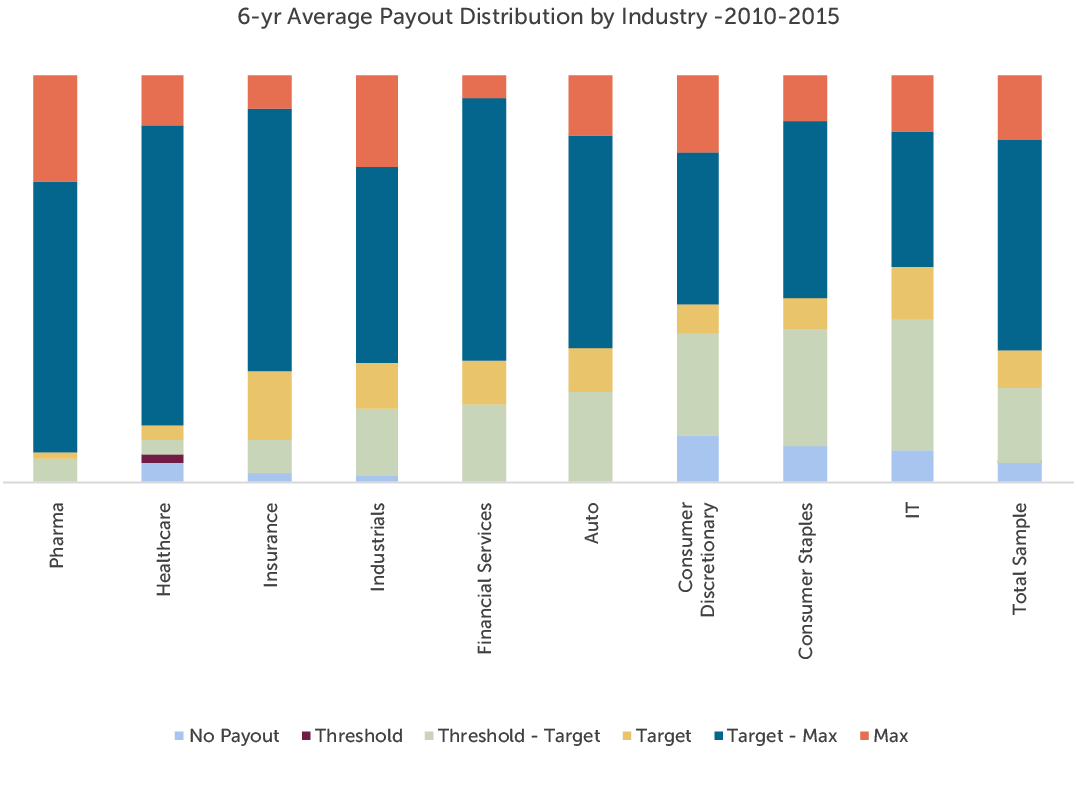
By Industry
Pharmaceutical and healthcare companies have paid at or above target more frequently than companies in any other industry over the past 6 years. Both industries have experienced significant growth over the period in part due to consolidation. The companies in the IT, Consumer Discretionary and Consumer Staples industries tend to pay below target at a higher rate. Average payouts for each industry are distributed as indicated in the following chart:
Relative to Performance
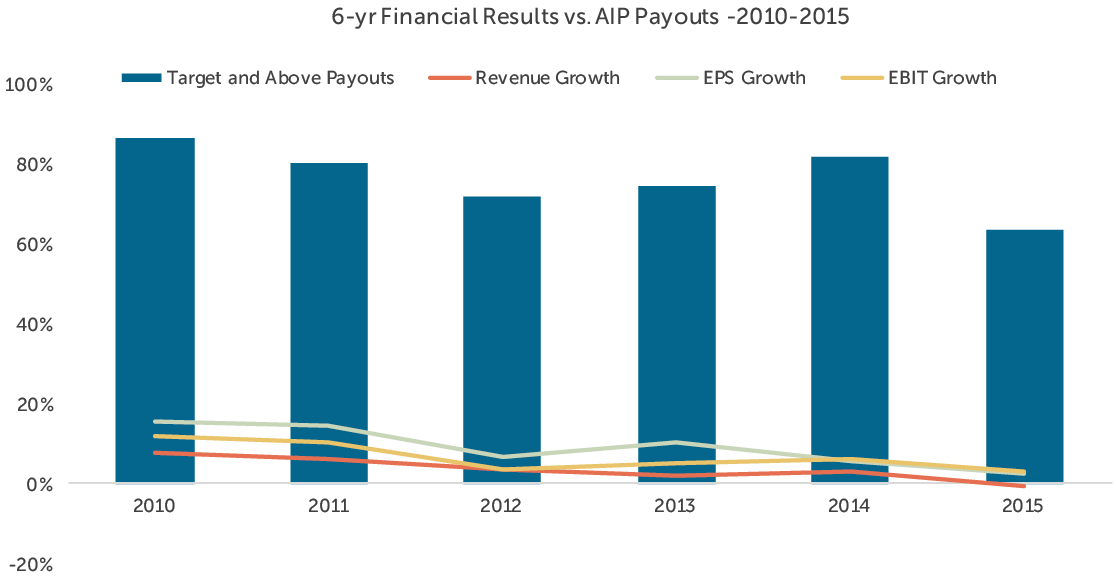
CAP reviewed the relationship between annual incentive payouts and company performance with respect to three metrics: revenue growth, earnings per share (EPS) growth and earnings before interest and taxes (EBIT) growth. While payouts were generally aligned with revenue and EPS growth, they most closely tracked with EBIT growth over the period studied (2010-2015). Companies may seek to align bonus payouts with operating measures, such as EBIT, as they capture an executive’s ability to control costs and improve operational efficiency.
The chart below depicts the relationship between median revenue, EPS, and EBIT growth and target and above annual incentive payouts among the companies studied.
Conclusion
In the first quarter of 2017, committees will certify the results and payouts for the fiscal 2016 bonus cycle and approve performance targets for fiscal 2017. Given the uncertain economic outlook following the 2016 presidential election, establishing performance targets for 2017 may be more challenging than usual. Companies may choose to use a range of performance from threshold to maximum to build flexibility into their plans given the unpredictable environment. Our study of annual bonus payouts over the past 6-8 years supports setting goals such that the degree of difficulty, or “stretch”, embedded in performance goals translates to:
- A 90-95% chance of achieving at least Threshold performance
- A 70-75% chance of achieving at least Target performance
- A 15% chance of achieving Maximum performance.
Companies should continue to set target performance goals that are challenging, but attainable and maximum goals that are achievable through outperformance of internal and external expectations – therefore, establishing a bonus plan that is attractive to executives and responsible to shareholders.
Methodology
CAP’s study consisted of 100 companies from 9 industries, selected to provide a broad representation of market practice across large U.S. public companies. The revenue size of the companies in our sample ranges from $18 billion at the 25th percentile to $70 billion at the 75th percentile.
CAP analyzed the annual incentive plan payouts of the companies in the sample over the past 6-8 years to determine the distribution of incentive payments and the frequency with which executives typically achieve target payouts. In this analysis, CAP categorized actual bonus payments (as a percent of target) into one of six categories based on the following payout ranges:
| Payout Category | Payout Range |
| No Payout | 0% |
| Threshold | Up to 5% above Threshold |
| Threshold – Target | 5% above Threshold to 5% below Target |
| Target | +/- 5% of Target |
| Target – Max | 5% above Target to 5% below Max |
| Max | 5% below Max to Max |
Spin-offs have been in the news for several years. Fully 60 spin-off transactions occurred in 2014, followed by another 40 spin-offs in 2015, with 13 involving S&P 500 companies.1 Spin-off activity continued to be newsworthy in 2016 with major spin-offs completed by Alcoa, Danaher, Emerson Electric, Johnson Controls, and Xerox. Spin-off activity will continue into 2017 with a number of pending transactions including major companies like Ashland, Biogen, Hilton Worldwide, and MetLife. The need to create shareholder value during a period marked by low returns from most asset classes is driving the spin-off activity. In some cases, activist shareholders have pushed companies to create value by breaking businesses into their component parts. When a business undergoes a spin-off, the human resource and executive compensation implications for executives at both the Parent Company (ParentCo) and the Spin-off Company (SpinCo) are very significant.
We have advised many companies as they worked through the spin-off process and we want to share some of what we have learned. As a starting point, we have identified four critical work streams for executive compensation in a spin-off:
- Establishing Transitional Compensation Arrangements (e.g., near-term retention plans)
- Understanding and/or Modifying Outstanding Compensation Arrangements (e.g., outstanding equity awards, severance and change in control agreements, benefit plans, etc.)
- Developing Going Forward Compensation Programs for SpinCo, equivalent in many ways to standing up a newly public company in an IPO
- Modifying Compensation Programs for ParentCo, as necessary to reflect new business focus and business scale
1. Establishing Transitional Compensation Arrangements
After deciding that a portion of the business is going to be spun-off, one of the first compensation decisions that needs to be addressed is how to structure incentive compensation programs for the company in the year of the spin-off. How complex this step is will depend on the timing of the spin-off in the fiscal year and the nature of the company’s annual and long-term incentive plans. A general principle is that if the spin-off has already been announced at the time design decisions are being made, SpinCo incentive compensation should be based primarily on SpinCo performance to provide better line-of-sight for SpinCo employees and to facilitate the transition.
Annual Incentive Plans
If the upcoming spin-off is a known event at the time that the annual incentive award is made, the transitional incentive plan can be simplified by ensuring that the annual incentive for SpinCo executives is tied 100% to SpinCo performance for the entire fiscal year. In this case, SpinCo executives will be paid an annual incentive based on SpinCo’s performance early in the fiscal year following the spin-off.
In some cases, the annual incentive award may already have been granted prior to the announcement of the spin-off. In such a situation, it is likely that the incentive plan for SpinCo employees will be based on a combination of ParentCo and SpinCo performance up to the time of the spin-off and then on SpinCo performance for the remainder of the year. This may require the company to establish SpinCo specific performance goals for the “stub period” from the completion of the spin-off to the end of the fiscal year. The performance measures for the “stub period” are typically the same performance measures used to assess SpinCo performance for the portion of the fiscal year prior to the completion of the spin-off.
Long-term Incentive Plans
Similar to the short-term incentive, if the company knows that the spin-off is going to take place during the fiscal year, there are design decisions that can help to facilitate transitioning the long-term incentive awards. For any performance-based awards (e.g., performance shares/units/cash), SpinCo employees should be granted awards that are based on multi-year performance objectives for the SpinCo. In some cases, companies will avoid making performance-based awards to SpinCo employees in the year of the transition because of the challenges in maintaining a consistent performance measurement approach before and after the spin-off.
If the spin-off is not a known event at the time that performance awards are made, there may be challenges in converting ParentCo performance awards into SpinCo performance awards at the time of the spin-off. In these cases, some companies will truncate the payout based on the ParentCo performance to date, at spin, and establish SpinCo goals for the remainder of the overall performance period. We will address this issue in greater detail in the next section on the treatment of outstanding awards following the spin-off.
Special Transition Compensation Programs
Most SpinCo employees are likely to view the spin-off as a positive event. Staff positions (e.g., finance, legal, human resources, etc.) will often have enhanced roles and responsibilities at the new company, given the stand-alone nature of the business. Line positions (e.g., business unit executives and staff) often feel that the spin-off provides them with a greater ability to impact business performance.
On the other hand, announcement of a spin-off creates uncertainty about the future prospects of the business. In addition, the SpinCo is a potential acquisition target, with the business potentially being sold rather than spun-off to shareholders. In many cases, it makes sense to review the severance protection in place for SpinCo staff in advance of announcing the spin-off. If there is a real chance that the business may be sold, enhanced severance protection may be needed to ensure that staff positions do not “jump ship”.
There may also be employee retention concerns at the ParentCo. While the spin-off is generally a positive event for SpinCo employees, spin-offs can create concerns for ParentCo employees. For ParentCo employees, a spin-off means working for a smaller company in the future, with a less complex and potentially less interesting job. In addition, the spin-off transaction will create additional work for all corporate staff positions as they set up the newly public company and continue to do their “day job”. For select ParentCo employees, a near-term retention bonus or short-term stock retention grant may provide recognition for their additional workload and focused efforts on preparing for a successful transaction, and help to keep them engaged in a stressful working environment. To the extent that certain corporate staff positions will no longer be needed following the spin-off, there may also be a need for enhanced severance for corporate staff.
2. Understanding and/or Modifying Outstanding Compensation Arrangements
As the company approaches the spin-off, a key compensation issue is how to adjust outstanding compensation arrangements to recognize that one company is breaking up into two companies. Decisions need to be made about what will happen to the company’s long-term incentive plans, as well as retirement plans and deferred compensation plans. For purposes of this discussion, we will focus on long-term incentive plans, as it is an area that is particularly critical for executive compensation.
The treatment of outstanding long-term incentives (particularly equity incentives), can be complex following a spin-off. There are several steps that need to be taken to transition awards, including review of the following:
- What provisions are specified in the equity plan and equity award agreements?
- Should the Committee apply discretion to modify the treatment of employees’ awards based on the circumstances of the transaction?
- What is the preferred approach for converting ParentCo equity (i.e., ParentCo post-spin and SpinCo equity)?
- What will be the timing of the conversion of equity?
Existing Equity Plan and Award Agreements
The first step in reviewing outstanding equity is to understand the treatment that the company’s equity plan and the individual award agreements prescribe for outstanding equity awards. A key issue to understand is what will happen to the awards held by employees of SpinCo. In many cases, the spin-off constitutes a termination of employment and, under ParentCo’s plans, unvested awards are forfeited at the spin-off.
It is important to understand the extent to which the prescribed approach impacts the bottom line of both entities. It is also important to work with internal and external counsel to ensure that there is a common understanding of the contractual rights of employees under the equity plan and award agreements.
Another key issue is whether the plan provides for the conversion of outstanding awards in a spin-off transaction. The plan document will likely include a section addressing a change in capital structure and transactions like a spin-off. In most cases, the Committee is required to convert vested awards to preserve value, but is afforded significant latitude in determining the details of the conversion.
Exercise of Compensation Committee Discretion
In our experience, most Compensation Committees do not want SpinCo employees to forfeit outstanding unvested equity as a result of a spin-off transaction. Forfeiture of previously awarded equity could have a serious impact on morale. One way to address this is to accelerate vesting in ParentCo equity or to provide for continued vesting post-spin. Alternatively, if the ParentCo’s Compensation Committee does not take action to keep SpinCo’s employees whole, then SpinCo’s Compensation Committee may need to take action following the spin-off. But it is important to keep in mind that each situation is different. If outstanding awards are underwater, the spin-off may be an opportunity to eliminate overhang on the stock.
Approaches for Conversion of ParentCo Equity
There are several approaches that are used in practice when addressing how to treat outstanding equity upon a spin-off. The following table provides an overview of the alternative approaches:
|
Approach |
Description |
|
Employee |
Employee awards are converted to equity in the company where they are employed. The participants of the equity plan who remain employed by ParentCo retain adjusted ParentCo equity awards. The equity plan participants who are employed by SpinCo receive converted SpinCo equity awards with same terms and conditions |
|
Shareholder |
Employees are treated like shareholders. Regardless of where the participant is employed following spin-off, outstanding awards of all equity plan participants are converted into both ParentCo and SpinCo equity at the same conversion ratio as shareholders, with the same terms and conditions as the original awards |
|
Hybrid |
A combination of the “Employment” and “Shareholder” approaches based on any of the following: (i) when the equity award was granted, (ii) where the equity holder is employed post-spin, (iii) when the equity award will vest, and/or (iv) the type of equity held at spin-off |
|
Adjustment Only, No Conversion Approach |
All employees retain adjusted ParentCo equity with same terms and conditions. Continued employment with SpinCo is treated as employment with ParentCo, for purposes of continued award vesting |
While several approaches to conversion are used in practice, the Employee approach is the most consistent with the goal of aligning the executives of the company with the shareholders of the entity they support following the spin-off. Other approaches (e.g., shareholder) may attempt to recognize the efforts of employees, prior to the spin, given that such efforts contribute to the future business success of both entities, post spin. The hybrid approach is sometimes used in situations where there is a significant difference in the growth prospects of the SpinCo or ParentCo. (i.e., ParentCo is expected to have modest price appreciation potential and SpinCo has strong growth prospects). And it is sometimes the case that different treatments may apply to employees within one entity. For example, if the ParentCo hires a senior executive for SpinCo from outside the company, prior to the spin, their awards may convert using the Employee approach if they have minimal service at ParentCo, yet the Shareholder approach may be used for other employees.
For outstanding long-term performance share or unit/cash plans (typically with three-year performance cycles), practice is mixed, and the conversion approach used will depend on the length of time remaining in the outstanding award cycle, the performance measures used, whether a new program is put in place in SpinCo, and the type of SpinCo company structure. In many cases, ParentCo prorates outstanding LTI awards held by employees of SpinCo to reflect their time as an employee of ParentCo. The prorated awards held by SpinCo employees are then paid out based on the original performance criteria at the time payments are made to ongoing employees of ParentCo. Once employees have transferred to SpinCo, the remaining stub periods of each outstanding award may be paid out at the target award amount, or, in cases where the Committee of SpinCo wants to preserve a performance-based focus, they may establish new performance goals based on operational or stock performance of SpinCo. There are challenges associated with setting goals for these ‘interim’ performance periods, yet many companies will do so.
Retirement Programs. Agreement on the treatment of retirement programs, non-qualified deferred compensation (“NQDC”) plans and other benefits is a critical administrative decision. If ParentCo has a defined benefit plan, it must determine whether to transfer assets and liabilities of the pension associated with SpinCo employees to SpinCo. A decision on whether any applicable grandfathering of frozen plans/plan benefits will continue is also required. Non-qualified benefit programs are often only partially funded, or unfunded, and the amounts can be significant. Typically, employee accounts in any NQDC plan of ParentCo are transferred to a SpinCo plan for employees of SpinCo. Alternatively, SpinCo could receive a payout of the NQDC applicable balances. Plan provisions will dictate the course of action. Note that distributions in connection with a spin-off are generally not compliant with Section 409A of IRC, since a spin-off is not a separation of service for employees under 409A.
Health and Welfare Benefits. Generally, SpinCo is responsible for setting up new health and welfare programs and both ParentCo and SpinCo are responsible for claims incurred against the respective plans post-spin. Certain programs such as retiree medical, however, may require a determination of how to allocate liabilities to SpinCo (e.g., for current terminated employees, or just future retirees). Decisions on allocating liabilities related to LTD payments, accrued vacation, COBRA, workers’ compensation, etc. may also need to be made depending on the programs of ParentCo.
Severance and Change in Control (“CIC) Benefits. A spin-off could trigger a CIC depending on the provisions of ParentCo’s various plans. While many benefits arising from a CIC are only paid after a “double trigger” (i.e., they are only paid or vested if a termination of employment occurs in connection with the CIC), certain benefits may be accelerated or payments may be triggered immediately. As a result, severance payments could become due to employees transferring to SpinCo. The companies need to determine if any severance obligations apply when employees transfer to SpinCo and who bears the responsibility for such obligations. Note however, that in many transactions, outstanding awards are assumed by SpinCo, in which case, payments would not be accelerated, nor would any benefits be distributed.
3. SpinCo Going Forward Compensation
Developing a going forward compensation program for the SpinCo is a critical process that often evolves over time. While the default approach may initially be to maintain compensation programs similar to those of the parent company, there may be a compelling case to make fundamental changes to the compensation program to address differences between the SpinCo and the Parent. However, depending on the time-frame for completion of the spin-off and the corporate governance structure, the timing of any such changes may be delayed.
Corporate governance of a spin-off can vary and we have seen each of the following approaches used:
- SpinCo Board of Directors is led by ParentCo executives through time of spin-off until ParentCo no longer has majority stake
- SpinCo has Independent Board members appointed prior to spin-off; decisions on compensation for SpinCo may be subject to Parent Company Compensation Committee approval
- ParentCo Compensation Committee reviews and approves programs for SpinCo
Prior to a planned spin-off there is typically a designated subcommittee of the Parent company board that begins planning and making decisions related to the SpinCo’s compensation program. A Lead Director may be appointed to oversee this planning process on behalf of the new Board, working with the company’s HR or designated SpinCo CEO. Prior to the spin-off, coordinated efforts to recruit new directors, develop a compensation committee charter and a Board calendar, etc. are required.
In a one-stage spin-off, where all shares of the SpinCo are distributed to ParentCo shareholders at the time of the spin-off, the involvement of ParentCo executives and Board members in SpinCo corporate governance will cease at the time of the spin-off. In other cases, where the SpinCo is distributed in stages (e.g., partial IPO to public shareholders followed by a completion of the spin-off or incremental sale of shares in the SpinCo to the public), the parent company Board or parent company executives may continue to serve as Board members of the SpinCo up until the time that the parent company has fully distributed its interest in SpinCo.
When ParentCo Board members or executives are involved in the compensation design, they are more likely to fall back on maintaining a compensation approach that is consistent with that of the parent. They may continue to view the SpinCo as akin to a subsidiary. In these cases, the SpinCo’s compensation program may evolve from the timing of the initial spin-off through the year following the parent company fully divesting its interests in the SpinCo.
Pay Philosophy and Target Pay Levels
For the SpinCo, there is typically pre-planning around the desired compensation philosophy, including a defined market or peer group for pay and performance benchmarking. This peer group should be size and industry specific, reflective of the operating characteristics of SpinCo and may or may not include similar peers to ParentCo’s peers.
There is often extensive benchmarking conducted before the spin-off to determine competitive pay levels for executive positions at SpinCo, assuming new position roles/responsibilities as part of a standalone entity (vs. part of a business unit, prior to the spin-off). It is often the case that benchmarking for SpinCo as a standalone entity will support an increase in pay for executive positions. For example, the top finance executive of a subsidiary is a very different role than CFO of a stand-alone public company. Some adjustments to base salaries and bonus opportunities may be made prior to and/or near the spin date, but should be made within the context of an overall compensation framework to the extent possible. The desired pay mix needs to be determined, with the appropriate emphasis on long-term (equity) incentives to ensure equity ownership build up and alignment with shareholders.
Annual Incentive Program
As with any company, the ongoing bonus program is designed so that funding is based on an appropriate mix of corporate, business unit and/or individual performance. The mix depends on the company’s emphasis on line of sight unit results or overall corporate team results. Performance metrics, whether top line, bottom line, or return based, should appropriately support the company’s strategy. Some investors may initially focus on EBIT/EBITDA or cash flow, yet ultimately determine that a balanced mix of metrics is desirable.
It is worth noting that for both short and long-term incentives, based on the tax code rules (IRC Sec. 162(m), the “performance based compensation” tax exemption for select executive officers), if a company gets an annual and long-term incentive plan approved prior to the Spin by the ParentCo board, and discloses such plan documents in any S1 filing, the company is exempt from IRC Section 162(m) rules for one year. Reapproval of such plan(s) by SpinCo shareholders is required prior to Sec. 162(m) transition relief expiring, and is also required under applicable stock exchange rules. Most companies, however, will still construct their plans to conform with “performance based compensation” rules and best in class industry/market practices.
Long-term Incentives
Key objectives of the Long-term Incentive (“LTI”) program for the SpinCo are to build executive/ employee stock ownership and to create excitement, engagement and alignment with shareholder value creation.
An important first step is to determine an overall equity pool to reserve for equity grants at the SpinCo, i.e., the amount of public stock outstanding that will be shared with employees as part of the compensation program. (This amount is generally under 10% of CSO, once initial IPO, has occurred and/or upon completion of the full spin; industry norms should dictate). At the initial IPO, or at full spin-off, it is common to grant a front loaded equity award to ‘jump start’ employee ownership in the new company. Some companies make a broad-based award to employees deeper in the organization, or beyond the executive group. Stock options and restricted stock are used for this type of grant, yet use of options (vs. full value awards) should be balanced with participation, share usage and cost considerations.
The core LTI framework for SpinCo should be designed to accomplish multiple objectives. Emphasis on equity programs helps to build shareholder alignment. Stock-based performance programs are strongly recommended. Not only do they reflect prevalent practice, but they are viewed favorably by large shareholders. Performance-based equity will also serve as a tool for the new leadership team to promote a focus on specific longer term performance results.
Like any LTI program, balance is important. While some specific industries may use more restricted stock than others (e.g., energy companies), most restricted stock is granted at lower levels in the organization, or for special retention/recognition grants. As a new entity, any new design presents an opportunity to assess long term performance goals related to business strategy and those being communicated to the marketplace. Such goals should likely be incorporated into the LTI program.
Vesting, form of payout and termination provisions are also important. The spin-off event is an opportunity for the new company to re-evaluate ParentCo practices. For example, SpinCo may choose to implement somewhat more stringent award termination provisions to support longer term employment of employees. To further align with best practice, companies should include CIC provisions that provide for outstanding award vesting only upon both completion of a CIC and termination of employment for good reason (i.e., a “double trigger”).
Severance provisions should be established as part of a formal severance (CIC/non-CIC) program or through severance agreements, or less common, as part of an employment agreement. These programs should be implemented after careful consideration of potential costs and benefits to the participant and to the company. Recognize that severance benefits are a sensitive issue for many investors. Tax gross-ups for any 280(g) CIC tax liabilities are no longer common and should not be included. Non-compete and non-solicitation provisions should be put in place for the new entity, as standalone policies or as part of LTI award agreements.
Governance Practices
Certain good governance practices that are commonly in place should be implemented, as they are in the best interests of SpinCo and shareholders and have come to be expected.
Stock Ownership guidelines are now very mainstream and expected by shareholders. They should apply to the newly formed executive group. In SpinCo, it may take some time to ramp up ownership in SpinCo stock, particularly if outstanding ParentCo equity awards were converted at spin using the shareholder approach. Keep in mind there should be a phase-in period before executives are held accountable and a ‘soft’ penalty my make sense, to help facilitate ownership, such as a required holding of 50% of net shares (vested or settled), until the guideline is met.
A Clawback Policy for any awards that were based on results impacted by an accounting restatement is a matter of good governance. A majority of companies today have one, with the ability for discretionary recoupment in the case of fraud or earnings restatement. Note that potential Dodd-Frank rules may mandate a “no fault” policy if finalized.
An Anti-Hedging Policy should be in place that prohibits executives from entering into any hedging transactions related to the company’s stock or trading any instrument related to the future price of the stock.
If Dodd-Frank rules are finalized as currently expected, companies may need to modify these provisions to comply with final rules, but on their own merit, these provisions should be put in place as a baseline.
Directors Compensation. The outside directors’ compensation program of SpinCo should ultimately reflect appropriate market norms for companies of similar size and industry, in terms of the amount of pay provided, the cash/equity mix, and overall structure of board and committee service pay. The design should consider the duties required of directors, as well as the company’s executive compensation philosophy. Initially however, the structure of SpinCo’s program will often resemble the ParentCo program.
The directors equity plan, if separate, follows the same rules as executive equity plans. The ParentCo board typically approves the SpinCo plan prior to the spin-off. Shareholders of SpinCo must reapprove the plan prior to IRC Sec. 162(m) transition relief running out, and also to comply with stock exchange listing requirements.
If any directors work on SpinCo activities prior to the spin-off, special equity compensation may be awarded, or pro-rated. If board leadership includes a non-executive chair or lead director, compensation will need to reflect the expected role, responsibilities and time commitment expected at that time.
4. Modification to ParentCo Compensation Programs Post-Spin
After the spin transaction, it is a good time for the remaining ParentCo to review its own compensation programs to ensure that they reflect the company’s new size and business focus. While not inclusive, the following program components may require review and/or potential modification:
Compensation Philosophy and Competitive Market. The company should assess who the appropriate peer companies are in terms of size, business mix, customers, geographic footprint, domestic vs international business, etc. It may be that the company maintains a market median pay philosophy, but that market position means something different now. If the company’s size is significantly smaller than before, pay levels will need to be monitored for alignment with the newly defined market over time.
Annual Incentive Program. The company’s annual incentive plan, in particular, may need revision so that the performance metrics reflect key drivers of the remaining entity and adjustments to the plan should reflect the new adjustments to the plan should reflect the new organization structure as it relates to any Business Unit or Division performance components. If the remaining business has slower growth prospects and lower margins, for example, the performance metrics may need to be redefined and the weightings reallocated. It may also be the case that there is more of a role for strategic goals as ParentCo also embarks on a new business strategy.
Long-term Incentive Plans. The company should reassess the role of various LTI vehicles at ParentCo. For example, in a low growth business, stock options are not the most effective long term incentive and the company may be better served by increasing the role of a three year LTIP. Conversely, the company may want to instill renewed enthusiasm around the ParentCo’s long term stock performance and growth potential. It may be an appropriate time to emphasize the role of equity. It is also a good time to reassess equity award participation as it relates to overall cost and/or share utilization, both domestically and internationally.
From a more technical standpoint, the Parent should review its current equity plans and share reserve, in light of the recapitalization. A spin-off event itself may not necessarily require revisions to plan documents, but it is an appropriate time to review documents to ensure that appropriate terms and provisions are included. It is also a good time to review compliance with IRC Section 162(m) and 409A.
The compensation related programs and provisions that need to be addressed and acted upon in a spin-off are comprehensive. It is important to the ongoing entities that both ParentCo and SpinCo business objectives are supported by appropriate pay design. At the same time, employee perspectives need to be considered as these transactions can present uncertainty. Planning should begin well in advance of any potential or planned transaction. A cross-functional team from HR, legal, finance and possibly outside advisors, should oversee the necessary action steps. This report can be used to help guide the process and compensation decisions that an organization will need to consider in a spin-off.
1 Source: www.spinoffresearch.com
The CAP 100 Company Research consists of 100 companies from 9 industries, selected to provide a broad representation of market practice among large U.S. public companies. In this report, CAP reviewed Pay Strategies, Annual Incentives, Long-Term Incentives, Perquisites, and Shareholder Friendly Provisions of these companies in order to gauge general market practices and trends.


