On November 13, 2019, Institutional Shareholder Services (ISS) made two key changes to its Quantitative Pay-for-Performance Screens for 2020.
-
- ISS changed the Financial Performance Assessment (FPA) to be based on Economic Value Added (EVA) metrics (EVA Margin, EVA Spread, EVA Momentum vs. Sales, EVA Momentum vs. Capital) instead of the GAAP metrics that were used in 2019. The FPA will continue to be used as a secondary modifier screen affecting a relatively small number of companies.
ISS will continue to include the GAAP metrics in the report. Though they will not be used in the quantitative assessment, they may be included in the overall ISS evaluation of pay and performance alignment.
We expect that many companies will engage with ISS to determine their performance on the EVA metrics, given the complexity in replicating the EVA metrics from GAAP financial information.
- ISS changed the Financial Performance Assessment (FPA) to be based on Economic Value Added (EVA) metrics (EVA Margin, EVA Spread, EVA Momentum vs. Sales, EVA Momentum vs. Capital) instead of the GAAP metrics that were used in 2019. The FPA will continue to be used as a secondary modifier screen affecting a relatively small number of companies.
- ISS made changes to the thresholds that will trigger concern for the Relative Degree of Alignment (RDA) and the Pay-TSR Alignment (PTA) tests.
| Measure | Policy Year | Eligible for FPA Adjustment | Medium Concern | High Concern |
| Relative Degree of Alignment | 2019 | -28 | -40 | -50 |
| Relative Degree of Alignment | 2020 | -38 | -50 | -60 |
| Pay-TSR Alignment | 2019 | -13% | -20% | -35% |
| Pay-TSR Alignment | 2020 | -22% | -30% | -45% |
These changes will be welcomed by issuers as they lower the likelihood of ISS undertaking a qualitative review of a company’s pay program that may trigger an against recommendation from ISS on the Say-on-Pay vote.
CAP partners Bertha Masuda and Susan Schroeder discuss essential components to building robust long term and short term incentive plans as well as what companies overlook when developing incentive plans for their employees
Stock price growth? Meeting the business plan? Beating external expectations? Long-term stability? Companies must consider success across multiple fronts, and boards of directors play a role in defining success by working with management to set the strategic plan and by overseeing how the company progresses toward the achievement of the plan.
Incentive plans are foundational to motivating the senior management team to achieve the goals of a company’s strategic plan. Determining how to best measure and reward performance against these goals is key to designing effective incentive compensation programs that ensure proper alignment of pay outcomes with various degrees of suc- cess against the plan.
To determine how board members measure performance and incorporate it in their company’s incentive compensation plans, Corporate Board Member and Compensation Advisory Partners partnered to survey more than 250 public company directors. In this report, we present our findings and share our perspective on these key issues.
Download the PDF to read the full report.
Beginning with fiscal years ending on or after December 31, 2017, companies are required to disclose the ratio that compares the compensation of the CEO to the compensation of the median employee (pay ratio). This disclosure was part of the Dodd-Frank Wall Street Reform and Consumer Protection Act signed into law in 2010.
Compensation Advisory Partners LLC (CAP) researched early pay ratio disclosures. As of March 9, 2018, we obtained pay ratios from 150 companies with a median revenue of $2.1B from a cross-section of industries.
Pay Ratio
The median pay ratio disclosed by these companies is 87x. The lowest ratio is 1x (Apollo Global Management, Dorchester Minerals and The Carlyle Group) and the highest ratio is 1465x (Fresh Del Monte Produce Inc.).
| Summary Statistics | Median Employee Pay | Median CEO Pay | Pay Ratio |
| 75th percentile | $88,612 | $10.5M | 172x |
| Median | $58,256 | $5.6M | 87x |
| 25th percentile | $43,966 | $2.5M | 36x |
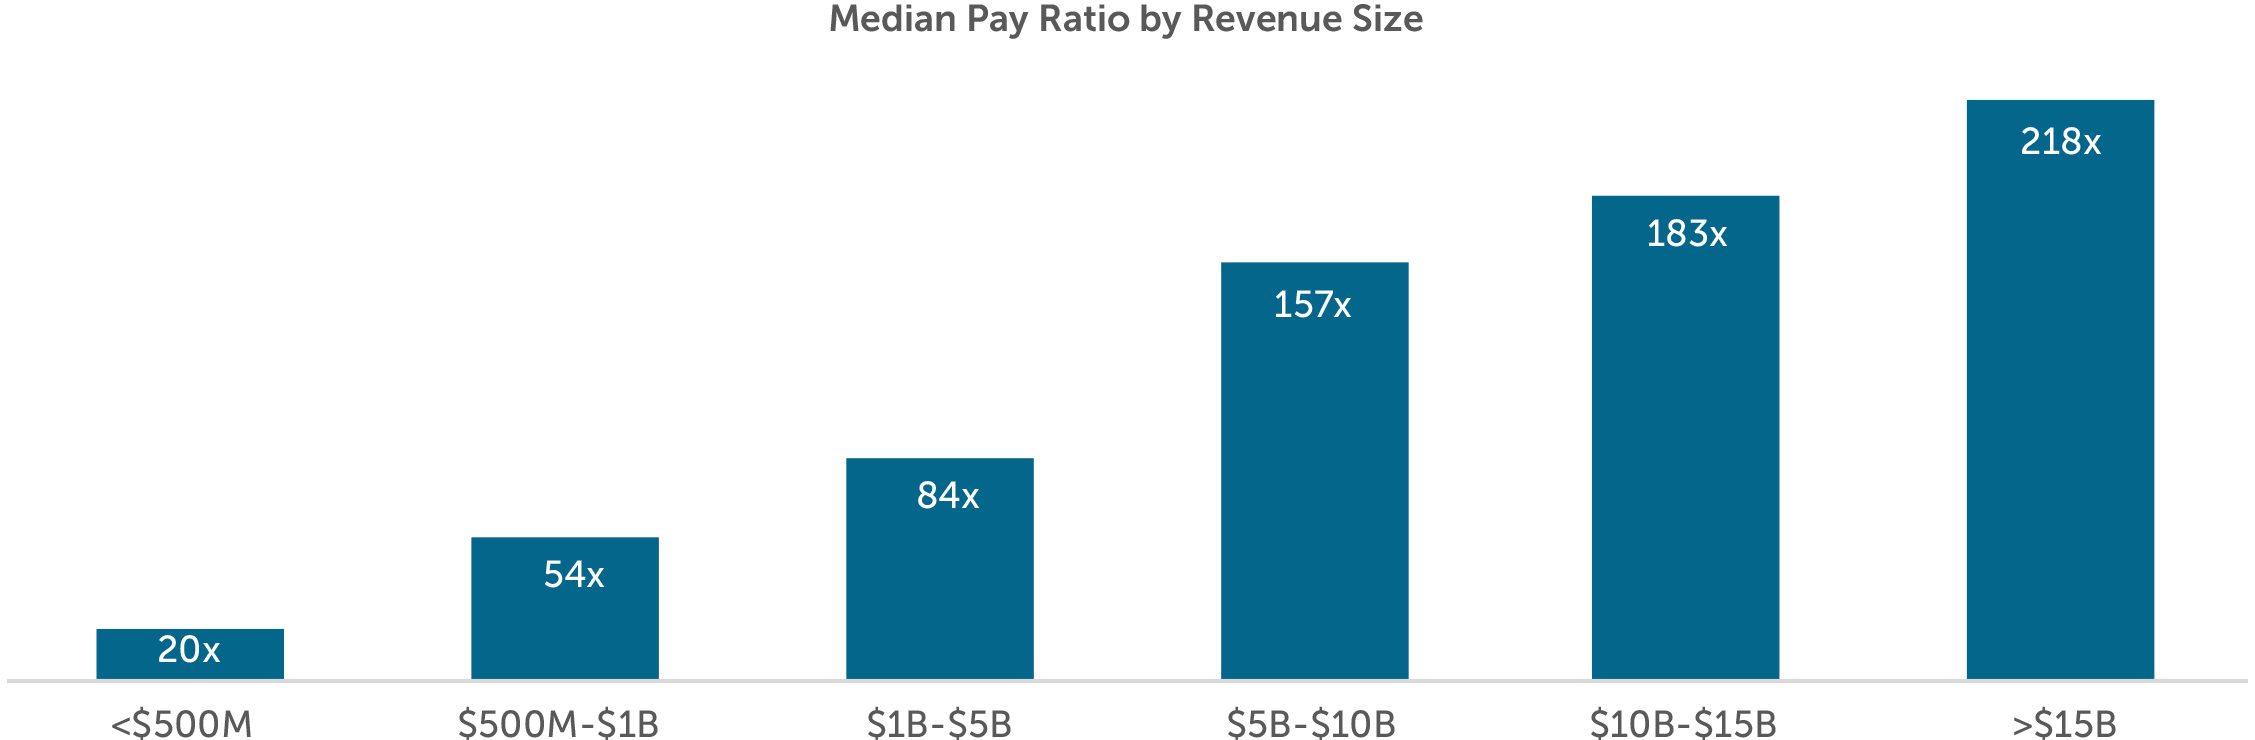
As expected, the pay ratio correlates with company size, with larger companies disclosing higher ratios. CEO pay varies greatly depending on the size and complexity of the organization. Employee pay has less variability since it reflects the job function and does not vary significantly based on the size of the organization. The median ratio in our sample of 150 companies ranges from 20x for companies with revenue less than $500M to 218x for companies with revenue greater than $15B.
Few companies, 15, disclose a supplemental pay ratio with only a handful of companies (three) disclosing more than one additional ratio. These companies with supplemental ratios are typically adjusting the CEO’s pay which may exclude anomalies such as a one-time special bonus or equity award. Interestingly, three companies disclosed a higher supplemental pay ratio likely to provide context for a large year over year increase in the 2019 proxy statement.
Location of Disclosure
Nearly 70% of companies disclose the pay ratio after the Potential Payments upon Termination or Change in Control section of the proxy statement. Approximately 25% of companies disclose the pay ratio just before or after the Summary Compensation Table and a small minority, 5%, disclose it in the Compensation Discussion and Analysis (CD&A).
Pay ratio is typically not disclosed in the CD&A, signaling to shareholders that the pay ratio is not used to determine CEO pay levels. Additionally, around 25% of companies include language in the disclosure that the ratio should not be used to compare pay levels to other companies within the industry, region of the country or revenue size.
Measurement Date
The SEC’s final rules give companies the flexibility to use any date within the last quarter of the fiscal year to identify the median employee. Companies most commonly used the last day of the fiscal year or a date within the last month of Q4. It is also common for companies to use a day within the first month of Q4 to identify the median employee.
| Measurement Month | Prevalence | Measurement Date | Prevalence | |
| First Month of Q4 | 29% | Last day of Q4 | 44% | |
| Second Month of Q4 | 8% | First day of Q4 | 17% | |
| Third Month of Q4 | 57% | Other | 33% | |
| Not Disclosed | 6% | Not Disclosed | 6% |
Exclusions from Median Employee Determination
Approximately one-third of companies excluded a portion of their workforce when determining the median employee. The most common rationale is the de minimis exemption (approximately 55%) whereby a company can exclude up to 5% of its non-U.S. employee workforce. Companies also commonly cited an acquisition or corporate not responsible for setting pay (e.g., independent contractors) as rationales for excluding certain employee groups.
Conclusion
As more companies continue to file their proxy statements in the coming weeks, we will likely see larger pay ratios, particularly as companies with a significant part-time workforce begin to disclose their ratios. We do not anticipate an increasing trend in the number of companies filing supplemental pay ratios though it will be interesting to see the rationale for those that do. We expect to continue to see companies placing the pay ratio outside of the CD&A with most disclosing it after the Potential Payments upon Termination or Change in Control section.
On a panel of leading executive compensation experts, Margaret Engel discusses some of the top executive compensation issues and trends including: the current public mistrust of executive compensation programs, the importance and the rigorous process of target goal setting, the challenges that many companies face with long-term performance awards, and the likely increase in the use of performance-based stock options in the future.
Setting goals for long-term incentives has been a persistent problem for companies and Compensation Committees ever since the reliance on long-term performance plans has increased. However, the results of the recent election take the uncertainty to an entirely new level, right around the time when companies are starting to think about setting goals for their upcoming long-term incentive cycle. Examples of challenges various industries will face include:
Energy & Utilities
- Volatility of energy prices given the views on natural gas and oil
- Environmental regulations (i.e. carbon dioxide emissions)
- Traditional sources of energy vs. renewables
Financial Services
- Dodd-Frank implications
- Movement in interest rates
- Return of Glass-Steagall
Industrial and Materials Companies
- Investment in large infrastructure projects
- Renegotiation of trade deals and increased tariffs on goods
None of the above even touches on the implications for businesses if the administration implements a broad-reaching immigration initiative which can have implications on labor costs or if President-elect Donald Trump is successful at dramatically lowering the corporate tax rate.
In many ways, it is similar to the level of uncertainty companies and Boards were dealing with during and immediately following the financial crisis. As Compensation Committees and management plan for 2017 and beyond, a challenge will be setting goals in a company’s 1- and 3-year incentive plans. As such, Compensation Advisory Partners (“CAP”) outlines four things to think about when setting goals to avoid unintended outcomes and maximize flexibility and accountability.
- Scenario Testing – Run scenarios to test sensitivities and potential outcomes. For example, test what will happen if energy prices go up/down/stay flat and what will happen to payouts under the varying scenarios. Discuss this analysis with the Compensation Committee and establish guiding principles for what is a reasonable payout under the varying scenarios.
- Retrospective analysis – Over periods of uncertainty, companies can meet or miss their goals for many reasons. If the next four years are as volatile as currently expected, Compensation Committees should encourage management to do a retrospective analysis at the end of each performance cycle comparing actual performance to expected performance when goals were set. For example, if the company ultimately delivers $3.00 EPS and the goal was $2.50, did the company get there through true outperformance, because of changes in non-controllable events or because corporate tax rates declined? This retrospective analysis can help guide the Compensation Committee in determining how challenging the goals wound up being and if appropriate, make necessary adjustments to payouts.
- Wider range – As the ability to predict the future diminishes, it can often be helpful to rethink the range around target that justifies a threshold and maximum payout. For example, if a company has a high level of confidence in the ability to achieve planned performance, then they might set a relatively narrow range around target (e.g., 95% of plan for threshold and 105% of plan for maximum). However, if the company has less confidence in the ability to set its plan, a wider range (e.g., 90% of plan for threshold and 110% of plan for maximum) may be more appropriate such that deviation from plan does not have as much as much of an impact on payouts.
- 162m Umbrella Plan – With significant uncertainty it may be challenging to predict what, if any, adjustments a Compensation Committee may want to make to their annual or long-term performance plan. This would be a good time to consider implementing, if you have not already, a 162m umbrella plan to provide the Compensation Committee with flexibility to make adjustments and maintain tax deductibility. An umbrella plan is a structure whereby a bonus is effectively “over-funded” for the Named Executive Officers (“NEOs”) such that the Compensation Committee can determine the final payout with some flexibility as long as the final payout is below the umbrella funded amount. For example, in order to qualify as performance-based compensation, a company could establish a maximum to be paid equal to 3% of net income and specify a percentage of the award pool for the each NEO (excluding the CFO). The Compensation Committee then retains negative discretion to pay less than the maximums established. These umbrella plans are very common for annual incentives, but are less common for long-term plans, though this might be a good time to consider whether one might be appropriate.
There are many other ways of addressing uncertainty around goal setting, but these four tips should help maintain a pay for performance structure, hold management accountable and provide Compensation Committees with appropriate flexibility.
Today, Institutional Shareholder Services (ISS) announced a methodology update to its CEO pay-for-performance assessment for U.S. companies. Beginning February 1, 2017, ISS proxy research reports will include a new standardized comparison of a company’s financial performance relative to its ISS-defined peer group.
This is a departure from ISS’ sole reliance on Total Shareholder Return (TSR) as a metric. ISS will measure multiple financial metrics which may include Return on Equity, Return on Assets, Return on Invested Capital, Revenue growth, EBITDA growth and Cash Flow (from Operations) growth; these metrics will supplement TSR, but only in the qualitative assessment. ISS will calculate a weighted average of select financial metrics; measures (and weightings) will be based on a company’s four-digit GICS industry group. For 2017, the new financial assessment will not be included in the quantitative assessment although ISS may incorporate a company’s relative financial performance in its qualitative discussion.
This is a significant change to ISS’ pay-for-performance methodology which primarily assesses performance based on Relative TSR. While the additional financial metrics will not be included in the quantitative assessment for the 2017 proxy season, it can provide shareholders with additional context of a company’s overall financial performance. The implication is that TSR will still drive a company’s specific level of concern in the quantitative tests. However, if the company’s financial metrics are not aligned with their stock performance, it could weigh heavily on whether they receive a “For” or an “Against” recommendation from ISS on the Say on Pay vote. Examples where this new policy could help a company is if the market has overreacted to news or industry shifts, but the underlying financials are still relatively strong. When ISS releases the details on the definition and weightings of each financial metric, it will be important for a company to model the financial performance relative to the ISS-defined peer group to understand how its performance will be viewed relative to comparators.
With this updated methodology, however, realizable pay will become increasingly more important in a company’s overall pay-for-performance assessment. By taking a more holistic look at stock and financial performance, ISS may more appropriately capture the linkage between actual compensation earned and the underlying financial performance.
Additionally, ISS has historically relied on S&P to provide financial data, which does an effective job at creating comparability across companies financials. However, they are typically limited in the adjustments they can make across companies (ISS will likely use GAAP definitions, where applicable) and, therefore, a company’s view of its relative performance (which may include adjustments) could differ from ISS. This could be true where there are significant differences between a company’s peer group and the ISS peer group, particularly for companies with a cross-industry peer group (which are more commonly used with large cap companies).
In addition to incorporating financial performance metrics, ISS also announced that it will no longer include companies with less than two years of TSR and pay data in the Relative Degree of Alignment (RDA) assessment. This change will only impact newly public companies.


