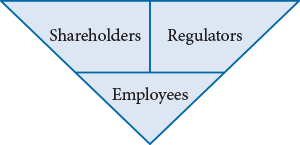
Private companies face unique incentive compensation challenges. Private companies lack publicly traded equity, so providing competitive long-term incentives can be challenging in terms of valuation, liquidity and ownership structure. Because private companies often do not share the same level of financial information, benchmarking incentives and performance against peers is difficult. However, private companies do have an advantage over their public peers in that they seldom/rarely are subject to the same level of scrutiny, so they have more freedom in incentive pay program design.
Survey Results: Short- and Long-Term Incentives
Of the respondents indicating that their private companies have an STI plan, nearly four out of 10 have one plan, while the rest have two or more STI plans in place. Nearly one-third of the respondents indicate that their companies are planning to add or modify a short-term incentive plan in 2011. The most common reasons for an added or modified STI plan are a change in strategy (50%), improving business results (36%) and a new management team (23%).
The private companies surveyed report modest equity overhang or pools for current and future grants. Seven out of 10 of the respondents with LTI plans in place report equity pools of about 10% or less. This reflects the fact that most private companies do not use real equity for LTI grants. (See graph 6.)
This resulted in significant new reporting requirements for banks and other financial institutions with $1 billion or more in consolidated assets regarding incentive compensation arrangements for Tier 1, Tier 2 and Tier 3 Covered Employees.1,2
- The Federal Reserve Board (“FRB”) first proposed guidance on incentive compensation in 2009 that was adopted by all the federal banking agencies in 2010 (“Final Guidance”).
- As a result, the focus of compensation program design at large banking institutions expanded. Beyond pay-for-performance and attracting / retaining talent, the programs must provide a greater focus on appropriately balancing risk and rewards.
To “improve” practices and require conformance with the Sound Guidance, in late 2009 the FRB began a multi-disciplinary horizontal review of incentive compensation arrangements at 25 large complex banking organizations (“LCBOs”). This led to an iterative pay program design process, as regulators now need to “sign off” on compensation program design for all Covered Employees. Based on client experience and a review of 2012 LCBO proxy statements, we have identified key themes concerning what has been done to-date to move towards substantial conformance with FRB requirements.3
| Key Themes | |
| 1. | The Fed is highly involved in the compensation design process at large bank holding companies for a sizeable number of employees (ranging from senior executives to employees well below that level) |
| 2. | A majority of variable executive compensation is linked to long-term performance and risk outcomes; it is now typical that more than the required 50% of incentive pay (annual + long-term) be deferred over at least 3 years |
| 3. | Performance adjustments are now expected before and after the grant of incentive compensation, and the role of the Risk function and formal risk assessments in that process has increased |
| 4. | Long-term incentive goals must now balance business plan and shareholder goals (EPS, TSR, etc.) with risk-based ex-post performance features (capital goals, etc.) |
| 5. | It is majority practice to have stock ownership requirements for senior executives that go beyond a more traditional guideline (multiple of base or number of shares achieved within a certain number of years) |
| 6. | Clawback provisions go beyond what is required by Sarbanes-Oxley or expected under Dodd-Frank |
Overall Incentive Compensation: Annual and
Long-term
With the goal of “de-leveraging” incentive pay programs and placing more focus on long-term performance and risk outcomes, some LCBOs have re-balanced the pay mix for senior executives. This typically includes a combination of: 1) increasing base salaries; 2) reducing annual incentive award opportunities; 3) increasing the mandatory deferral rate for a portion of annual incentive awards.
To ensure alignment of compensation with long-term performance and risk outcomes, proposed regulations require that at least 50 percent of incentive compensation (annual + long-term) be deferred over a period of at least 3 years (ratable vesting is acceptable), for specific Tier 1 executives at covered financial institutions with total assets of at least $50 billion (minimum deferral under proposed regulations; Dodd-Frank §956).
| approx. (rounded) | % of Incentive Compensation Deferred Over At Least 3 Years (Actual Bonus + Grant Date LTI Value) |
|
| CEO | NEOs (avg.) | |
| 75th%ile | 80% | 75% |
| 50th%ile | 70% | 65% |
| 25th%ile | 65% | 60% |
Currently, the portion of incentive compensation deferred at LCBOs is substantial and exceeds the minimum guideline. Many of these companies have additional stock retention requirements after deferred compensation vests.
CAP Perspective: These high deferral rates reflect a meaningful shift from historic industry practice.
CAP Perspective: Near-term, medium-sized financial institutions are likely to migrate their practices towards increased deferral rates leading to a change in typical senior executive pay mix.
Regulators also require that the deferred amounts be subject to: “performance adjustment for losses (or other measures or aspects of performance) that are realized or become better known during the deferral period.” These risk (and performance) adjustments are expected prior to the grant of incentive compensation (ex-ante / upfront) as well as post-grant and prior to vesting (ex-post / look-back).
In terms of ex-ante adjustments, all but one LCBO (93 percent) disclosed in its most recent proxy statement an annual risk review prior to payment of incentive compensation that can modify payout. Most companies disclosed a highly discretionary process (more structure likely exists), while 20 percent specifically described use of a risk/compliance scorecard.
CAP Perspective: These new concepts / design will cascade down in organizations, and create additional work for cross-functional teams.
In terms of ex-post adjustments, companies are introducing formulaic and/or discretionary reduction features (see LTI discussion below).
CAP Perspective: The FRB does not recognize market-based (stock price) adjustments alone as an adequate form of risk-based performance adjustment.
Incentive Compensation: Annual Incentives
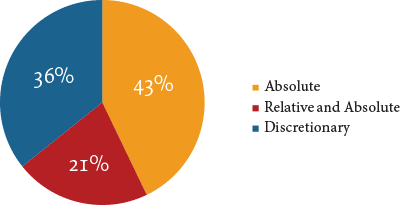
Measuring absolute (internal) performance against pre-established goals is the most common approach used by the LCBOs to determine bonus payments for senior executives. The goals are most often made up of multiple performance measures. The most prevalent metrics relate to profitability (for example, EPS), followed by return/efficiency metrics (for example, ROE).
Additionally, as a risk management technique, we observed that about 20 percent of LCBOs have reduced annual incentive plan upside leverage, by either reducing target opportunities or capping maximum payout opportunities.
Annual Incentive Plan Measurement
Relative vs. Absolute
CAP Perspective: Near-term, we expect large bank holding companies to add more structure to the annual incentive decision making process, including increased documentation and back-testing of decisions.
CAP Perspective: We also expect to see an increased use of risk-focused measures, such as use of a minimum capital level as a 162(m) funding requirement.
Incentive Compensation: Long-term Incentives
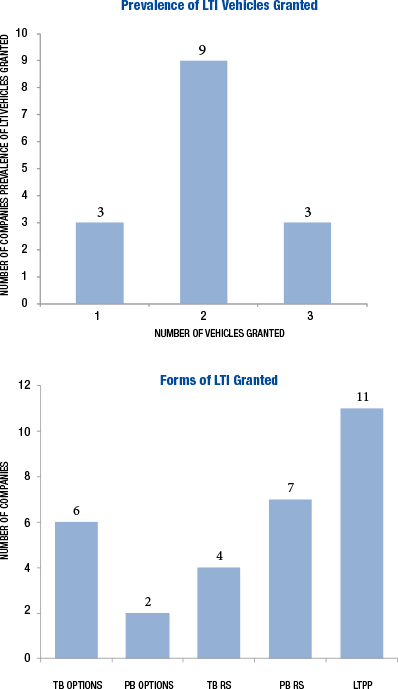
Most companies use two long-term incentive vehicles. Some form of long-term performance plan (LTPP; performance shares / cash) is the most widely used vehicle, followed by stock options. The most common LTPP performance period is 3 years, and the most common LTPP upside leverage is 150 percent of target.
CAP Perspective: Stock options have been de-emphasized in the proportion of the long-term incentive award that they represent due to recent stock price volatility and outside criticisms.
CAP Perspective: Stock options are not seen as appropriately performance-based among regulators. There is concern that value can be realized based on macro economic conditions, rather than company-specific events/financials, particularly over a 10 year timeframe. Attaching some form of ex-post performance-based adjustment can provide risk-balancing features.
In addition to traditional long-term goals tied to the business plan, relative performance or stock price, companies have been adopting secondary performance conditions, in reaction to the Final Guidance, intended to significantly reduce or eliminate unvested deferred incentive payments (post grant, an ex-post adjustment) if a risk event were to occur. These adjustments are designed to be done on a formulaic basis, discretionary basis, or both.
| Select Examples | |
| PNC |
|
| Goldman Sachs |
|
| BNY Mellon |
|
When designing a long-term incentive program, it is also important for financial institutions to consider accounting implications.
CAP Perspective: Truly new designs are being implemented, and it seems that some may lead to variable accounting for equity vehicles. Awards may lack a true grant date, resulting in variable accounting, if a discretionary risk assessment subjects the awards to reduction up until vesting. This can lead to increased cost / volatility in expense and therefore create a reason to consider providing a portion of long-term incentive compensation through a cash-based vehicle.
Stock Ownership Requirements
While all of the LCBOs have some form of stock ownership requirement, most have requirements for senior executives that go beyond traditional ownership guidelines (multiple of base and/or number of shares that must be achieved within a certain number of years).
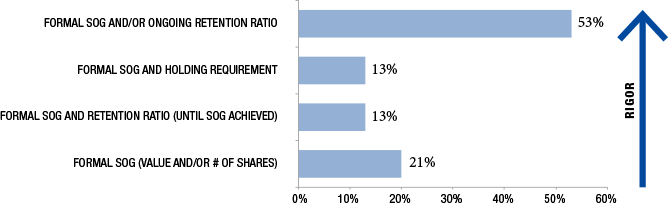
CAP Perspective: The most rigorous requirement for executives – an ongoing retention ratio – is most common.
CAP Perspective: Senior executive ownership standards in this industry exceed those typically found in the general industry.
Clawbacks
As most public companies await final SEC regulations, the horizontal review banks have begun to make comprehensive changes to their existing clawback policies. The horizontal review banks have a clawback provision that goes beyond what is required under Sarbanes-Oxley or Dodd-Frank legislation (SEC has not yet proposed rules). These clawback provisions are part of multiple programs and can impact different employee populations or pay elements for varying reasons.
CAP Perspective: Based on disclosed policies, it is noteworthy that “inattention to risk” is a triggering event among 40 percent of the horizontal review banks.
CAP Perspective: In our experience, most companies have yet to think through how they would implement a clawback of previously paid compensation, should one be triggered. This will likely be a complicated process, with a number of legal and tax considerations for both the employee and the company.
Conclusion
Compensation design and governance practices have been changing at LCBOs at an accelerated pace since the horizontal review process began and the Final Guidance was issued. Change will continue among these organizations, and will spread to other large (and smaller) financial institutions. While the regulations are focused on the largest banks ($50B+ in consolidated assets), the design practices discussed above will be increasingly relevant for financial institutions of all sizes.
There are now greater expectations for Board oversight, enhanced controls and related policies, and documentation for incentive plans and risk mitigation strategies. To comply, the Compensation Committee and a cross-functional senior management team must be fully involved, well-informed and possess an in-depth understanding of incentive arrangements for all Covered Employees.
Research assistance for this CAPFlash was provided by: Deep Patel, Devika Ray and Chelsea Carter.
1 These companies are required to disclose the structure of their incentive-based compensation arrangements to appropriate federal agencies.
2 As described in the Interagency Guidance, the full set of employees who may individually or collectively expose the firm to material amounts of risk are together referred to as “Covered Employees.”
3 16 LCBOs are U.S.-based. Our analysis focuses on these companies excluding Ally Financial (where the U.S. government remains the majority owner). Data found in proxy disclosures is most relevant to Tier 1 Covered Employees (senior executives).
This leads to a number of questions, such as:
- How is the benchmark group of companies defined?
- What metric is used most often to measure relative performance?
- What level of performance should equate to maximum, target and/or minimum payouts?
- What other considerations should be taken into account when designing these programs?
This CAPFlash tracks companies’ response to these questions through our proprietary research database. Each year, Compensation Advisory Partners (“CAP”) reviews proxy disclosures for a cross-industry sample of Fortune 250 companies. In 2011, our study included 111 companies, with 26 companies, or 24% of our sample, incorporating relative performance measurement into their long-term incentive program as a primary performance measure. An additional 7 companies, or 6% of our sample, incorporate relative performance measurement into their long-term incentive program through the use of a modifier.
How is the Benchmark Group of Companies Defined?
For relative performance measurement in long-term incentive (“LTI”) plans, the benchmark group of companies that performance is most often compared to is the executive compensation peer group. We found that 45% of companies measure pay and performance against a consistent group of companies. As shown below, just over half of companies take a different approach. For example, 42% of companies measure performance against an index that differs from the group of companies used to benchmark compensation levels.
| No. of | % of Cos. | |
| Comparator Groups Used to Measure Relative Performance | Cos. | n=33 |
| Compensation Peer Group | 15 | 45% |
| General Industry Index (e.g., S&P 500) | 9 | 27% |
| Industry Specific Group (Non-Compensation) | 6 | 18% |
| Industry Specific Index | 5 | 15% |
| Subset of Compensation Peer Group | 1 | 3% |
Note: Percentages add up to greater than 100% due to companies using multiple comparator groups.
Some companies use more than one comparator group. For example: AT&T measures performance relative to the Dow Jones Industrial Average constituents as well as a group of 11 domestic and global telecommunications companies. Intel measures relative Total Shareholder Return (“TSR”) against its executive compensation peer group as well as against the S&P 100; and Northrop Grumman measures relative TSR against a group of leading U.S. and European aerospace and defense companies and the S&P Industrials Index.
Companies tend to use industry peer groups or indices when economic factors have a unique impact on the industry. Companies that use a broader market group, such as a general industry index like the S&P 500, believe that companies compete broadly for investor dollars. They may also operate in industries with a small number of players, making it difficult to identify peers in the same industry.
What Metric is Used Most Often to Measure Long-Term Relative Performance?
As shown below, relative performance plans most often measure company TSR. While EPS is the second most common metric used, it is only used by 15% of companies studied and is typically given less weight than TSR in a relative long-term performance plan.
Relative Financial Metrics Used in Long-Term Incentive Plans
| Relative Metric | |||
| TSR | EPS | Other | |
| Overall Prevalence | 73% | 15% | 23% |
| Most Prevalent Weighting Given To Relative Metric | 100% | 50% | 100% |
Note: Excludes companies with TSR used as a modifier (n=7). Percentages do not add up to 100% due to certain companies using multiple relative metrics.
Some companies use more than one measure of relative performance. PNC Financial Services (EPS & ROCE) is one example and MetLife (TSR & EPS) is another. Approximately half of the companies studied (52%) combine relative metrics with absolute financial metrics in long-term performance plans. The most prevalent metric used to measure absolute financial performance, alongside a relative performance metric, is EPS.
What Level of Performance Should Equate to Maximum, Target or Minimum Payouts?
The chart below shows that the relative performance benchmarks used for maximum, target and/or minimum payouts of relative long-term performance plans vary by company. The most common approach is to set threshold, target and maximum payouts at the 25th, 50th and 75th percentiles compared to peers, as highlighted below:
Relative Long-Term Incentive Plan Performance Percentiles
| Threshold | Prevalence | Target | Prevalence | Max | Prevalence |
| (relative position) | (relative position) | (relative position) | |||
| 10th %ile | 6% | 40th %ile | 5% | 75th %ile | 33% |
| 20th %ile1 | 29% | 45th %ile | 5% | 80th %ile | 22% |
| 25th %ile | 29% | 50th %ile | 68% | 85th %ile | 11% |
| 30th %ile | 6% | 55th %ile | 12% | 90th %ile | 6% |
| 35th %ile | 24% | 60th %ile | 5% | 95th %ile | 6% |
| 40th %ile | 6% | 65th %ile | 5% | 100th %ile | 22% |
Note: In cases where a rank approach is uses, percentile was interpolated.
Companies use two approaches to define relative market positioning: either “percentile” or “rank.” As shown below, the percentile approach is most common. Examples of companies that use a ranking system include Motorola Solutions, Pfizer and Target. Examples of companies that use a percentile system include Lockheed Martin, Chubb and Express Scripts.
Relative Long-Term Incentive Plan Payout Measurement
| Payout Based On | ||
| Percentile | Rank | |
| Number of Companies | 17 | 10 |
| Prevalence | 63% | 37% |
Note: Excludes companies (n=6) that do not specifically disclose basis for relative long-term performance plan payout.
Leverage is another feature of long-term performance plans. Plans must define what percentage of the target opportunity threshold or maximum performance will yield. The chart below describes the leverage in relative performance plans among the companies in our study. It is most common for threshold performance to result in a payout of 50% of target, and for maximum performance to result in a payout of 200% of target.
Relative Long-Term Incentive Plan Payouts
| Threshold | Prevalence | Max | Prevalence |
| (as % of target) | (as % of target) | ||
| 15% | 9% | 120% | 4% |
| 20% | 5% | 125% | 4% |
| 25% | 22% | 150% | 8% |
| 30% | 9% | 200% | 80% |
| 35% | 14% | 250% | 4% |
| 40% | 5% | ||
| 50% | 31% | ||
| 60% | 5% | ||
Note: Percents have been rounded to nearest 5%.
What Other Considerations Should Be Taken into Account When Designing These Programs?
Accounting Implications
When determining what long-term incentive design to implement, it is important to consider accounting implications. If the award is denominated and paid in cash, then it requires mark-to-market accounting where the charge is generally “trued up” to the value of the final payout. A share-based award that utilizes a financial metric has a somewhat similar treatment, where the accounting charge is trued up for the number of shares earned, but the equity value is fixed at grant. Differently, for a share-based award that uses a market-based metric (such as TSR) the accounting charge is fixed on the grant date and the expense does not change to reflect the final payout. While some view this design feature as a positive as it avoids “volatile” period-to-period accounting, others are uncomfortable with the fact that the charge cannot be reversed if performance is below threshold and a payout does not occur.
A properly designed modifier approach (where the primary award determinant is an internal financial metric) is an alternative for companies not wanting to have a “fixed charge” while still utilizing a market-based relative metric. In this case, if internal financial goals are not met, there is no expense as the impact of the market condition was considered and locked in as part of the grant-date fair value per share. The final total expense equals the grant-date fair value per share times the number of shares earned under the EPS goal. Thus, total expense is trued up for the outcome of the performance condition – but not for the outcome of the market condition, which was incorporated in the grant date value per share.
Important: Before selecting a specific go-forward design for your unique circumstance, we recommend that you confirm accounting treatment for all designs under considerations with outside advisors.
Discretion
Relative performance plans help reduce the need for discretionary adjustments to performance goals, which is often viewed as a positive feature of these plans. However, attraction / retention issues can occur when relative performance plans do not pay out. Annual grants with overlapping performance cycles are a common way of maintaining motivational impact, even when performance is down in one or two years. While not seen frequently, we have observed some companies attempt to solve for these issues by using alternative approaches. Some approaches include:
- Providing an added opportunity to earn an award if a financial metric (such as EPS) exceeds a pre-determined level of absolute performance;
- Adjusting earned awards down by a small amount if absolute results do not reflect improvement;
- Limiting payout based on relative TSR to no higher than target if a company has negative TSR while it is outperforming its benchmark group; or
- Guaranteeing a minimum payout (threshold).
In most cases, annual grants are the approach that makes the most sense, since it clearly aligns with shareholder interests.
TSR Modifier
Of the 33 companies studied with relative performance plans, 7 companies or 21%, incorporate relative financial performance into their LTI program using a TSR modifier. These companies’ LTI plans are measured against absolute metrics and then a TSR modifier is used to adjust the payout up or down. Companies with plans that incorporate a TSR modifier measure relative TSR performance against a variety of benchmarks.
| No. of | % of Cos. | |
| Comparator Groups Used to Measure Relative Performance | Cos. | n=7 |
| Compensation Peer Group | 3 | 43% |
| General Industry Index | 3 | 43% |
| Industry Specific Index | 1 | 14% |
A TSR modifier typically applies in all cases. However, some companies intend for a TSR modifier to only operate in “fringe” situations where absolute performance results differ substantially from relative performance. For example, a modifier could function so that if relative three-year TSR is in the bottom quartile, the performance share payout will be reduced by 25%. Conversely, if relative three-year TSR is in the top quartile, the performance share payout will be increased by 25%.
Views of Proxy Advisory Firms are Important
Glass Lewis recently wrote that: “[the] sole use of absolute metrics under long-term incentive plans is inappropriate as they may reflect economic factors or industry-wide trends beyond the control of executives on individual performance.” This statement seems to indicate that they believe incorporating a relative measure into a long-term incentive plan can provide balance. Likely under a similar premise, ISS reviews both relative and absolute performance as part of its pay-for-performance analysis (specifically focused on TSR). Therefore, support of proxy advisory firms is another reason to consider relative performance measurement.
Conclusion
When designing long-term incentives, we recommend that companies start by defining their objectives (business, employee and shareholder), and then assess their ability to set long-term goals. When companies determine that a relative performance metric could help management drive performance, these plans should be considered. In the current Say on Pay environment, a properly calibrated relative long-term performance plan is one way to say: “we only pay above target for outperformance.”
1 For companies that set threshold performance/payout at the 20th percentile, maximum performance/payout is typically set above the 75th percentile.
The SEC announced its adoption of the rules on March 3rd. Seven other government regulators are expected to adopt substantially similar provisions, which will cover most financial institutions with assets greater than $1 billion.
The proposed rules will be effective six months after their adoption by all regulators and following a 45-day comment period. Current estimates are that the rules will go into effect sometime in late 2011. Compensation currently being determined for 2010 performance and long-term incentive awards being made now or this spring are unaffected. However, most affected institutions have not previously been subject to this level of review, therefore the process of complying and assessing the impact of the rules on compensation plan design needs to begin now.
Key Provisions
The new proposed rules:
- prohibit most financial institutions in excess of $1 billion in assets from providing incentive compensation arrangements that could encourage inappropriate risk-taking;
- prohibit any incentive arrangement or feature that is excessive or could lead to a material loss;
- require larger institutions whose assets exceed $50 billion to defer 50% of the incentive compensation of executive officers (and select individuals) over a three-year period;
- provide for additional annual reporting for all institutions over $1 billion to their respective regulators on how their incentive plans for executives and identified other individuals are structured to prevent material loss and excessive compensation;
- disclose the policies and procedures in place to monitor and evaluate these arrangements.
Covered Person
Executive officers including senior corporate executives and the heads of major business units, directors, principal shareholders and other individuals whose activities may expose the institution to significant risk.
Definition of Compensation and Excessive Compensation
Compensation includes all direct and indirect payments, fees, and benefits received including those under employment contracts or agreements, in the form of cash or non-cash. It also includes perquisites, stock options, post-employment benefits and any other compensatory arrangement.
Excessive compensation includes amounts that are determined to be unreasonable or disproportionate to the amount, quality and scope of services performed.
Board of Directors’ Role
The Board of Directors, or a designated Committee of the Board, is expected to actively oversee the institution’s incentive arrangements for covered employees, including executives. For larger institutions, the Committee will also need to identify individuals who may expose the company to material risk. In support of strong corporate governance the board’s (or committee) responsibilities would include:
- determining employees other than executive officers in their purview;
- reviewing and approving goals and payments;
- ensuring the alignment of goals with the institution’s overall risk tolerance;
- evaluating appropriate performance periods;
- ensuring risk adjustment of awards as appropriate.
In addition, the Committee would receive data and analyses sufficient to determine whether the arrangements are in compliance and performing in accordance with their terms.
Compensation Standards
The rule reiterates three key standards/ principles for sound compensation practices from earlier Banking Agency Guidance and the Financial Stability Board for determining whether an incentive arrangement is in compliance with the rule.
The incentive arrangement must:
- balance risk and financial rewards;
- be compatible with effective controls and risk management;
- be supported by strong corporate governance.
Deferral of Annual Incentive Compensation (Large Institutions)
The proposal mandates the deferral of 50% of incentive compensation for executive officers (and select individuals) over a three-year period. Incentive compensation is broadly defined in the proposal and would likely cover most forms of compensation other than base salary and salary-related benefits (e.g., employer contributions to a 401(k))
The deferrals may vest on a pro-rata basis, but no more than 1/3 per year. In order to recognize that an annual performance period may be too short a time to recognize the impact of actions taken, the deferred amounts are also subject to adjustment based on actual loss or other aspects of performance that are better evaluated over a longer period.
This provision places the US in closer alignment, but with greater flexibility, with the actions of the UK Financial Stability Authority (FSA) and EU remuneration guidelines.
Annual Reporting
An annual report, filed within ninety days of the financial year, must be made to the appropriate regulator. This report discloses the structure and features of incentive compensation arrangements for covered persons in a manner sufficient to determine whether the plan(s) incents behavior that could contribute to a material financial loss or provide for excessive compensation. The guidance provides that the form of the report is expected to be a clear, succinct narrative description of the plans. Further, it requires disclosure of the policies and procedures put in place to monitor/evaluate incentive plans as well as any changes made since the last report.
Impact of the Proposed Rule on Incentive Compensation
The rule reiterates principles that have been disseminated by multiple regulators since the financial crisis. The focus remains on minimizing risk to the institution and the financial system. The inclusion of all financial institutions over $1B provides for a broader level of compensation supervision than we have seen to date, creating more complexity for smaller institutions likely lacking the infrastructure and governance larger institutions have of necessity put in place. For public companies, recent SEC requirements on risk disclosure have likely started the process and raised Board awareness.
Smaller Institutions
For institutions who have not undergone risk assessments by their regulators or were not CPP (Capital Purchase Plan) participants, the rules will require a thorough review of existing incentive arrangements relative to the principles identified. This assessment would extend to plans that cover employees other than executives, and contain potential for material loss. In addition, the institution will need to develop (with the participation of its Board, or appropriate committee) policies and procedures for monitoring and approving plans that include:
- Significant involvement by risk management in the incentive plan process;
- An assessment of plan features to ensure that they minimize risk;
- A review of payouts to confirm that they are not excessive.
Larger Institutions
Larger institutions have had significant interaction with regulators over the last two years, either as CPP participants or through regulatory reviews which have included incentive compensation. Much of what is required in the proposed rules is similar to the guidance they have received. The requirement for a mandatory deferral of compensation for larger institutions is new.
While initially targeted at executives, individuals and/or groups who may expose the institution to losses, it is unclear how deep this policy will be extended. Companies that have undergone regulatory review have difficulty in clearly defining or segregating individuals and groups who are in a position to expose the institution to risk from other positions within their organization. This may have the unintended consequence of leading to the greater use of deferrals throughout institutions.
Additionally, the design of deferral features, allowing for risk adjustment due to material loss or changes in performance that can be linked to actions directly taken by these individuals, is more complex than it appears. The proposal suggests that adjustments can be determined quantitatively or subjectively. It is likely that Compensation Committees will prefer quantitative criteria but will also retain some judgment. Other suggestions from the regulators (not required) for minimizing the potential for loss include lengthening performance periods overall, reducing reliance on annual incentives and de-levering incentive awards at higher levels of performance.
The guidance makes no distinction between how companies structure incentive compensation. For example, many Wall Street firms have a compensation model that delivers total compensation (salary plus incentive compensation) for a year based on performance in that year. The incentive compensation is delivered to executives in a mix of fixed annual cash bonus and equity (e.g., stock options, restricted stock). Other financial services companies have a different compensation model where annual cash bonuses are based on annual performance, but the amount of equity-based compensation provided to executives is not necessarily dependent on annual performance. The proposed rules seem to have been designed with the Wall Street incentive compensation model in mind.
The rule does not mandate the form of a deferral – a departure from UK and European regulations that are more prescriptive. A variety of incentive programs utilized today don’t fit neatly into a “bonus deferral” and questions will be posed about how to apply the proposal to these forms of compensation. Some include:
- Stock options – does a three or four year vesting period meet the deferral requirement if the executive exercises no more than 1/3 per year of the award by the third anniversary of grant?
- Performance-based restricted stock – does a three-year cliff vest on the shares, assuming performance is met, substitute for the three-year deferral requirement?
- Performance shares or units – does the award need to be held post the three-year performance period to allow for a performance adjustment?
Boards and Committees that have been heavily involved in risk assessments over the last two years, will see the rules as confirmation of their oversight of compensation for all employees and a significant expansion of their charter. These additional responsibilities will require support from management and corporate functions – particularly risk, finance and human resources in order to meet the greater demands.
Please contact us at (212) 921-9350 if you have any questions about the issues discussed above or would like to discuss your own executive compensation issues. You can access our website at www.capartners.com for more information on executive compensation.
Annual Incentive Plan Metrics
In our June 25, 2010 CAPflash, we noted that the most frequently reported modification in 2010 CD&As was changing performance metrics used to fund annual incentive awards (reported by 15 companies, or 44% of the 34 companies making annual incentive plan changes).
The chart below shows that for all industry groups, the two most common metrics used in annual incentive plan funding are Revenue/Revenue Growth and various measures of earnings, such as Operating Income, EBIT or EPS. In four of the six industry groups, the most prevalent metric used is Revenue/ Revenue Growth. Among Insurance and Healthcare companies, Operating Income and EPS, respectively, are the most prevalent metrics. Strategic goals are used by 67% of the Pharmaceutical companies. Return metrics are rarely used as key funding criteria. ROIC is one of the top metrics in the Healthcare industry, but other industry groups do not commonly use return measures. Excluding financial services companies, 60 companies (82% of 73 companies) use more than one metric to fund annual incentives.
The chart summarizes the three most prevalent metrics used in each industry group:
| Industry | No. of Cos. | Annual Incentive Funding – Most Prevalent Metrics Used | ||
| #1 | #2 | #3 | ||
| Consumer Goods | Rev. / Rev. Growth | EPS | Operating Income | |
| # of Cos. | 13 | 9 | 8 | 7 |
| % of Cos. | 69% | 62% | 54% | |
| Healthcare | EPS | Operating Income | ROIC | |
| # of Cos. | 11 | 4 | 4 | 2 |
| % of Cos. | 36% | 36% | 18% | |
| Insurance | Operating Income | Operating Income EPS | Operating Income ROE | |
| # of Cos. | 12 | 9 | 6 | 6 |
| % of Cos. | 75% | 50% | 50% | |
| Pharmaceuticals | Rev. / Rev. Growth | EPS | Strategic Goals | |
| # of Cos. | 12 | 10 | 10 | 8 |
| % of Cos. | 83% | 83% | 67% | |
| Retail | Rev. / Rev. Growth | EBIT/ EBITDA | Operating Income | |
| # of Cos. | 10 | 3 | 3 | 2 |
| % of Cos. | 30% | 30% | 20% | |
| Technology | Rev. / Rev. Growth | Operating Income | Cash Flow | |
| # of Cos. | 15 | 10 | 5 | 4 |
| % of Cos. | 67% | 33% | 27% | |
| All Industry Groups | Rev. / Rev. Growth | Operating Income | EPS | |
| # of Cos. | 85 | 39 | 28 | 23 |
| % of Cos. | 46% | 33% | 27% | |
Note: Excludes financial services companies due to limited disclosure related to TARP participation/ restrictions. Four companies use a non-GAAP EPS metric.
As financial services companies increasingly come out of TARP, we expect their bonus pool funding to be linked to company profitability and performance expressed in bottom-line metrics as well as risk and capital adequacy metrics. In addition to financial services, many companies are making efforts in their plan design to offset any potential inappropriate risk taking by focusing on metrics used, time horizons, deferrals and performance sensitivities.
Long-Term Incentive Vehicles
In our June CAPflash, we found that the biggest change reported by companies with regard to long-term incentive practices was the mix of award vehicles.
Stock options are the most prevalent LTI vehicle used among the 85 companies studied, used by 62 companies (or 73%). Both Time Based Restricted Stock (“TBRS”) and Long-term Performance Plans (“LTIPs”) are also frequently seen, used by 53 and 51 companies, respectively (62% and 60%).
Here is the breakdown of overall LTI vehicle prevalence:
| Long-Term Incentive Vehicle Prevalence | No. of Cos. | % of Cos. (n=85) |
| Stock Options | 62 | 73% |
| Time-Based Restricted Stock (TBRS) | 53 | 62% |
| LTIP | 51 | 60% |
| Performance-Based Restricted Stock (PBRS) | 31 | 36% |
| Performance-Based Stock Options (PBSO) | 5 | 6% |
Note: Percentages do not add up to 100% due to multiple responses.
As companies continue to make changes to LTI programs they are balancing time-based equity with performance-based equity. Of the 85 companies, 48 use two LTI vehicles in their executive program (56%), 20 use three vehicles (24%), 17 use one vehicle (20%). The two most prevalent vehicle combinations used are:
- 2 vehicles: stock options and LTIP/or PBRS, used by 24 companies (28% of 85 companies), and
- 3 vehicles: stock options, TBRS and LTIP/or PBRS, used by 20 companies (24% of 85 companies)
Below is the breakdown of the combination of LTI vehicles awarded:
|
Combination of LTI Vehicles Used |
||
| # of LTI Vehicles Granted | No. of Cos. | % of Cos. (n=85) |
| 2 Vehicles (Options, LTIP/PBRS) | 24 | 28% |
| 2 Vehicles (Options, RS) | 13 | 15% |
| 2 Vehicles (TBRS, LTIP/PBRS) | 11 | 13% |
| 3 Vehicles (Options, RS, LTIP/PBRS) | 20 | 24% |
| 1 Vehicle (LTIP/ PBRS) | 8 | 9% |
| 1 Vehicle (TBRS) | 5 | 6% |
| 1 Vehicle (Options) | 4 | 5% |
We expect the use of performance-based LTI to continue to increase, modestly, in 2011 and beyond. Stock options will continue to be a part of the LTI mix, but with less emphasis. As the economy stabilizes and recovers, we also expect to see less time-based restricted stock granted at senior executive levels.
Performance-Based Long-Term Incentive Metrics
Of the 65 companies that use an LTIP or Performance Based Restricted Stock or Options, 27 companies use EPS (42%) and 23 companies use Relative TSR (35%) as metrics. We have seen a slight uptick in the use of Relative TSR, given its simplicity and clarity of measurement in a volatile market. Due to the difficultly in goal setting, companies continue to recalibrate performance metrics.
The breakdown of the most prevalent performance based LTI metrics used is as follows:
| LTIP / PBRS / PBSO Metric | No. of Cos. | % of Cos. (n=65) |
| EPS | 27 | 42% |
| Relative TSR | 23 | 35% |
| Revenue / Revenue Growth | 14 | 22% |
| ROC / ROE | 13 | 20% |
| Cash Flow | 7 | 11% |
| Operating Income | 6 | 9% |
Note: Percentages do not add up to 100% due to multiple responses.
Further, of those companies using EPS and Relative TSR, they are most common in certain industries:
- EPS is common in healthcare, consumer goods, pharmaceutical companies
- Relative TSR is common in technology, consumer goods, pharmaceutical companies
Of the companies that use an LTIP or PBRS, 52 companies (83%) pay out in stock.
| LTIP / PBRS Payout | No. of Cos. | % of Cos. (n=63) |
| Stock | 52 | 83% |
| Cash | 25 | 40% |
| Both (Stock and Cash) | 5 | 8% |
Note: Percentages do not add up to 100% due to multiple responses.
Other Long-Term Incentive Provisions
Consistent with broad market norms we also found that a three year time frame for performance measurement and or vesting is common:
- Among the companies that use an LTIP/PBRS, the most common performance period is 3 years (86% of those providing)
- 37% of companies granting stock options use 3 year installment vesting
- 36% of companies granting time based RS use a 3 year vesting period, with cliff vesting somewhat more prevalent than installment vesting
Conclusions
Companies are continuing to evaluate and modify executive annual incentive and long-term incentive plans. We expect to see continued modest shifts in LTI programs, as companies continue to evaluate the appropriateness of specific LTI vehicles in light of the recovering market, accounting cost vs. employees’ perceived value, and overall pay strategy. The increased emphasis on performance-based compensation will prevail through 2011 as shareholders continue to demand clear alignment between pay and performance.
Please contact us at (212) 921-9350 if you have any questions about the issues discussed above or would like to discuss your own executive compensation issues. You can access our website at www.capartners.com for more information on executive compensation.


