HIGHLIGHTS
- Most large public companies have maintained consistent approaches to delivering annual incentives to their executive leadership teams.
- We frequently see minor adjustments to annual incentive plan designs — most often modifying performance measures – rather than wholesale change.
- Most companies use multiple measures to ensure the annual incentive plan provides balance and aligns with overall business strategy.
- Median CEO annual target bonuses increased 10 percentage points to 170% of salary in 2014.
- In contrast, CFO annual target bonuses remained the same at 100% of salary.
- Overall, 2014 annual incentive payouts were slightly lower than in 2013.
CHANGES IN ANNUAL INCENTIVE PLAN DESIGN
32% of companies in CAP’s database changed their annual incentive plan design in 2014 or 2015. The most common changes were modifications to the performance metrics used to fund awards and increases to the target award opportunities offered to the CEO or CFO. Another common change was to adjust the weightings/mix applicable to performance metrics. These changes, as well as other modifications shown in the chart below, illustrate that companies continue to review and enhance the pay-for-performance relationship through changes to the annual incentive program.
|
Type of Change Reported in CD&A |
2014 No. of Cos. |
% of Cos. Reporting Changes |
||
|
2014 (n = 32) |
2013 (n = 34) |
2012 (n = 37) |
||
|
Change in performance metrics used to fund awards |
16 |
50% |
47% |
43% |
|
Increased/Reduced target award opportunities (CEO and/or CFO) |
12 |
38% |
32% |
11% |
|
Change in performance metric weighting/mix |
5 |
16% |
32% |
35% |
|
Change in maximum award payout |
4 |
13% |
9% |
8% |
|
Other changes |
3 |
9% |
12% |
22% |
Note: Due to multiple changes, does not add up to 100%.
Modifications to Performance Metrics
Among the companies that changed the performance metrics used for annual incentives, the most common approaches were to either maintain the same number of metrics or reduce the number of metrics. This avoids adding complexity to annual incentive while allowing for better alignment of pay with performance:
- Six (6) companies kept the total number of metrics the same, but replaced a metric;
- Six (6) companies reduced the number of metrics; and
- Four (4) companies added metrics to the current plan.
Changes made by many companies were done so to better align incentives with their business strategy:
- Bristol-Myers Squibb: Added a new pipeline metric as a measure to highlight the importance of pipeline delivery to the near-term and long-term success of the company.
- Intel: Moved from a single set of company-wide operational goals to business-unit-specific operational goals – significantly reducing the number of performance goals, in order to drive a sharper focus on key strategic initiatives, increase visibility into those initiatives, and enhance accountability.
- Verizon Communications: Consistent with Verizon’s strategic plan, adjusted the weightings of the financial measures from 2013 to place a greater emphasis on free cash flow, given the importance of cash generation and debt reduction following the acquisition of sole ownership of Verizon Wireless. In addition, a sustainability measure was introduced, reflecting Verizon’s commitment to reducing the environmental impact of its operations.
Increases in Target Bonus Opportunity
CAP’s database tracks the size of target annual bonus awards for both CEOs and CFOs. When we looked across all industries in 2014, we found that the median target bonus opportunity increased for CEOs by 10 percentage points to 170% of salary. By industry, the largest increase we saw was in Automotive, where CEO target bonus awards increased by 15 percentage points. Significantly, none of our industry groups registered a decline in CEO target annual bonuses, although Financial Services do not typically define target bonuses.
When we looked across all industries at CFO target bonus opportunities, we saw no change year-over-year. The median target bonus for CFOs remained the same at 100% of salary. By industry, Technology CFOs saw the greatest increase (25 percentage points). Across other industries, median target CEO/CFO bonus increases were generally between 0 and 10 percentage points. Similar to the CEO data, no industry group saw a decline in CFO annual bonus targets.
|
Industry |
Median Target Bonus as a % of Salary |
|||
|
CEO |
CFO |
|||
|
2014 |
2013 |
2014 |
2013 |
|
|
Automotive |
150% |
135% |
95% |
85% |
|
Consumer Goods |
165% |
160% |
100% |
93% |
|
Financial Services |
n/m |
n/m |
n/m |
n/m |
|
Health Care |
150% |
150% |
100% |
100% |
|
Insurance |
210% |
200% |
125% |
120% |
|
Manufacturing |
153% |
147% |
90% |
88% |
|
Pharmaceutical |
150% |
150% |
100% |
98% |
|
Retail |
200% |
200% |
125% |
125% |
|
Technology |
220% |
210% |
150% |
125% |
|
Total Sample |
170% |
160% |
100% |
100% |
Note: Companies among all industries that did not disclose target bonus opportunities were excluded from both the 2013 and 2014 target bonus analysis. Financial Services industry is excluded since most companies in our study do not disclose target bonus opportunities for the Named Executive Officers.
ANNUAL INCENTIVE PLAN DESIGN PRACTICES
Award Leverage
CAP reviewed proxy disclosure to understand how companies are establishing the payout range (i.e., the threshold payout and the maximum payout expressed as a percentage of the target payout) for annual incentives. Most companies that we reviewed identify the minimum payout as zero and do not separately disclose a threshold level of performance. For the 37 companies that did disclose a threshold bonus payout, a payout of 50% of target is the most common percentage. Twenty companies, however, disclose a minimum bonus payout of less than 50% of target which scales down to 25% or lower.
Approximately 75% of companies disclose the maximum bonus opportunity. A majority of companies in our sample (60%) have a maximum bonus opportunity of 200% of target bonus. Ten (10) companies have a maximum bonus of 250% of target or higher. Most of these companies are in the Consumer Goods, Pharmaceutical, and Technology industries.
|
Threshold Payout as a % of Target (n = 37) |
||
|
Range |
# of Cos. |
% of Cos. |
|
< 25% |
10 |
27% |
|
> 25% < 50% |
10 |
27% |
|
50% |
13 |
35% |
|
> 75% < 100% |
4 |
11% |
|
Maximum Payout as a % of Target (n = 73) |
||
|
Range |
# of Cos. |
% of Cos. |
|
> 125% < 150% |
2 |
3% |
|
> 150% < 200% |
14 |
19% |
|
200% |
44 |
60% |
|
> 200% < 250% |
3 |
4% |
|
> 250% |
10 |
14% |
Annual Incentive Plan Metrics
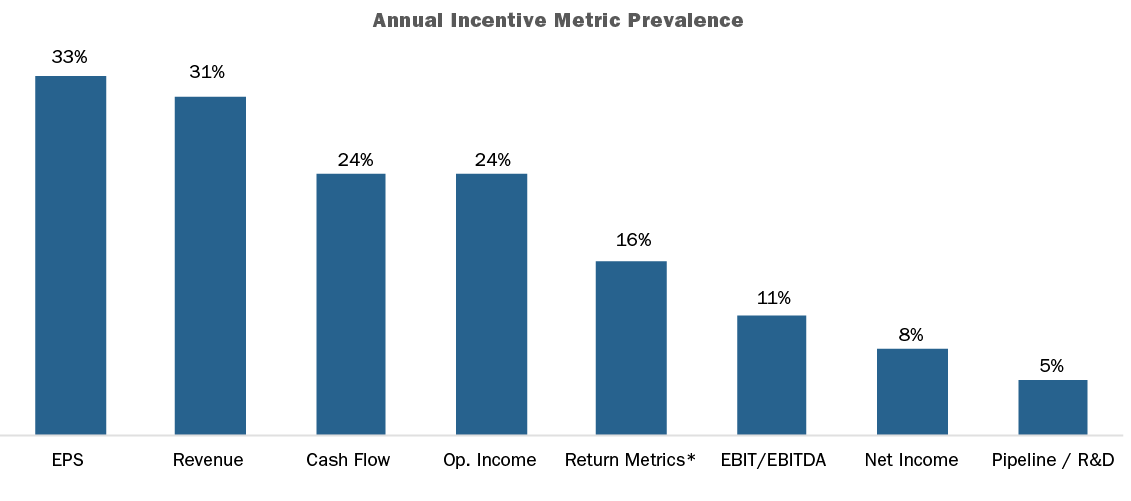
EPS, Revenue, Cash Flow and Operating Income are the most common metrics used in annual incentive plans. Similar to last year, our findings suggest that EPS is used more broadly across industries while Revenue tends to be used in consumer-driven industries.
Most companies use multiple performance metrics in the annual incentive plan. 33% of companies disclose using two (2) metrics, 31% use three (3) metrics, and 16% use four (4) or more metrics.
The use of multiple performance metrics allows for annual incentive payouts to be tied more closely to overall company performance. For example, companies using bottom-line measures in the annual incentive plan will often also include top-line measures for balance. Among CAP’s sample, 36% of “multiple-metric” companies that use a measure of profit (EPS, Operating Income, etc.) also use Revenue.
In addition to financial measures, approximately 15% of companies disclose using non-financial measures in their annual incentive plans such as talent, culture, and diversity initiatives. 55% of companies disclose that individual performance considerations impact annual incentive payouts.
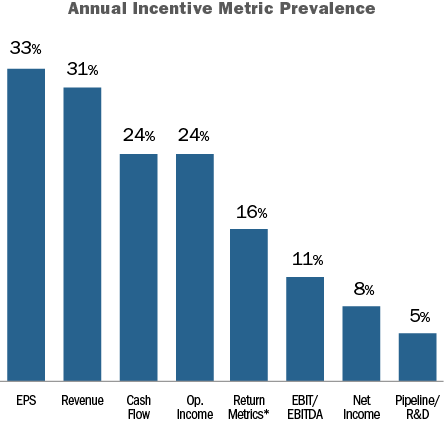
*Return metrics include: ROE, ROA, and ROI/ROIC.
The chart below shows the three (3) most common metrics by industry in 2014:
|
Industry |
Metric #1 |
Metric #2 |
Metric #3 |
|
Automotive |
Cash Flow (45%) |
EBIT (45%) |
ROA (27%) |
|
Consumer Goods |
Revenue (67%) |
EPS (58%) |
Cash Flow (33%) |
|
Financial Services |
EPS (33%) |
ROE (17%) |
Op. Income (8%) |
|
Health Care |
EPS (40%) |
Op. Income (30%) |
EBIT (30%) |
|
Insurance |
Op. Income (46%) |
Op. ROE (23%) |
Op. EPS (15%) |
|
Manufacturing |
Cash Flow (30%) |
EPS (30%) |
Revenue (20%) |
|
Pharmaceuticals |
Revenue (70%) |
EPS (70%) |
Pipeline/R&D (50%) |
|
Retail |
Revenue (40%) |
Op. Income (40%) |
EBIT (30%) |
|
Technology |
Revenue (58%) |
Cash Flow (50%) |
Op. Income (33%) |
Note: Percentages reflect the prevalence of companies disclosing the metric.
2014 Actual Bonus Payouts
Nearly all companies (94%) awarded bonuses to their CEO for 2014 performance. Three companies did not pay a bonus to the CEO as a result of company performance: Coca-Cola, McDonalds, and Target.
Overall, the median CEO bonus payout was 114% of target (or 225% of salary, at median). Across industries, bonuses for Pharmaceutical CEOs exceeded target by the greatest amount (146% of target, at median). 3 of the 9 industries CAP surveyed had a median bonus payout of less than 100%: Retail (82%), Consumer Goods (92%), and Technology (95%).
|
Industry |
Bonus Payout at a Percent of Target |
|||||
|
75th Percentile |
Median |
25th Percentile |
||||
|
2014 |
2013 |
2014 |
2013 |
2014 |
2013 |
|
|
Automotive |
146% |
183% |
122% |
165% |
103% |
120% |
|
Consumer Goods |
148% |
133% |
92% |
112% |
33% |
70% |
|
Financial Services |
124% |
142% |
112% |
126% |
97% |
102% |
|
Health Care |
149% |
149% |
124% |
127% |
108% |
116% |
|
Insurance |
139% |
170% |
132% |
150% |
110% |
123% |
|
Manufacturing |
155% |
119% |
115% |
111% |
98% |
98% |
|
Pharmaceutical |
173% |
158% |
146% |
138% |
118% |
122% |
|
Retail |
100% |
119% |
82% |
78% |
75% |
68% |
|
Technology |
127% |
121% |
95% |
88% |
86% |
69% |
|
Total Sample |
145% |
150% |
114% |
122% |
95% |
95% |
Note: Most companies in the Financial Services industry do not disclose a target bonus for the CEO. For these companies, 3-year average actual bonus was used as a proxy for target bonus.
Conclusion
In our experience, most companies strive to achieve the following with regard to annual incentive plan design:
- Alignment with the company’s business plan
- A balanced portfolio of performance metrics
- An appropriate mix of corporate versus business unit / strategic performance considerations
- The proper amount of structured discretion and/or individual performance
These objectives can be achieved by continuing to assess plan design in relation to strategy and making minor modifications, such as changes to performance metrics and their weightings, as necessary. Short of a major economic shift or regulatory change, we expect to see only modest changes to annual incentive plan designs.
Key Takeaways
- Compensation Committees face intense scrutiny with respect to executive annual bonus payouts and their alignment with performance
- Over a multi-year period, executives tend to earn an annual incentive payout approximately 90% of the time
- As a general rule of thumb, based on analysis of the past 6 years, the degree of difficulty, or “stretch”, embedded in performance goals translates to:
- A 90% chance of achieving Threshold performance
- A 70% chance of achieving Target performance
- A 15% chance of achieving Maximum performance
- This pattern indicates that threshold and target performance goals are set at attainable levels, but maximum payouts commonly reflect rigorous goals and superior performance
- Annual incentive payouts have generally been aligned with financial performance over the past six years for the companies reviewed
Background
Goal setting is one of the most challenging aspects of the compensation process. Compensation Committees struggle with this critical activity and try to determine if they are “getting it right”. Goals tied to annual incentive compensation face scrutiny from both internal and external stakeholders, pressuring Committees to achieve a balance between the rigor and the attainability of their goals. Appropriate performance targets will motivate and retain executives while driving corporate performance and creating returns for shareholders.
Summary of Findings
Plan Design
Annual incentive plans can be categorized as either “Goal Attainment” plans or “Discretionary” plans. Goal attainment plans contain traditional performance and payout scales that consist of a pre-determined minimum, target and maximum level of performance and corresponding payouts. Discretionary annual incentive plans allow the Committee to determine payouts by using discretion and targets are not necessarily defined up front.
In this study, we found that 71% of the sample companies have goal attainments plans. Discretionary plans are most prevalent among Financial Services companies. Our analysis focuses on those companies with goal attainment plans.
|
Plan Type |
|||
|
Industry |
Sample Size |
Goal Attainment |
Discretionary |
|
Auto |
n= 7 |
100% |
0% |
|
Consumer Discretionary |
n= 10 |
90% |
10% |
|
Consumer Staples |
n= 11 |
91% |
9% |
|
Financial Services |
n= 12 |
17% |
83% |
|
Healthcare |
n= 10 |
100% |
0% |
|
Industrials |
n= 14 |
79% |
21% |
|
Insurance |
n= 11 |
45% |
55% |
|
IT |
n= 12 |
75% |
25% |
|
Pharma |
n= 10 |
60% |
40% |
|
Total |
n= 97 |
71% |
29% |
Performance Metrics
In most goal attainment plans, awards are earned based on corporate performance related to two or three metrics. While the metrics vary by industry, some of the most common metrics are revenue and profitability. These metrics are popular because they are indicators of financial health to the investment community. From an internal perspective, revenue and profitability are simple to understand and in the “line of sight” for most executives in that the correlation can be seen between actions/decisions and results. From an external perspective, most shareholders would support an above target payout for executives who are driving top-line growth while maintaining or expanding margins.
|
# of Metrics Used in Goal Attainment Plan |
||||
|
Industry |
1 Metric |
2 Metrics |
3 Metrics |
4+ Metrics |
|
Auto |
0% |
43% |
57% |
0% |
|
Consumer Discretionary |
33% |
22% |
45% |
0% |
|
Consumer Staples |
20% |
40% |
10% |
30% |
|
Financial Services |
0% |
50% |
50% |
0% |
|
Healthcare |
20% |
50% |
20% |
10% |
|
Industrials |
27% |
55% |
9% |
9% |
|
Insurance |
0% |
40% |
40% |
20% |
|
IT |
11% |
22% |
56% |
11% |
|
Pharma |
0% |
0% |
50% |
50% |
|
Total |
16% |
36% |
33% |
15% |
Pay and Performance Scales
At companies with goal attainment plans, Compensation Committees must annually approve minimum, target and maximum goals and corresponding payout levels, for each metric in the incentive plan. Among companies included in our research, the most prevalent payout scale awarded executives 50% of target for threshold performance and 200% of target for maximum performance. Companies most often structure payout scales so that executives will earn 100% of their target annual incentive award for target performance and the actual payout is interpolated between threshold and target and target and maximum.
Annual Incentive Plan Payouts Relative to Goals
All Companies
Based on CAP’s review of annual incentive payouts, companies achieve threshold performance goals 90% of time. Annual incentive payouts most often fall between target and maximum. Companies’ annual incentive plans pay at this level 48% of the time or approximately one out of every two years. Executives earn bonuses in the range of threshold to target about 20% of the time, roughly once in every five years. Approximately 10% of the time, companies do not achieve threshold and executives do not earn a bonus. Payouts for the total sample are distributed as indicated in the following charts:
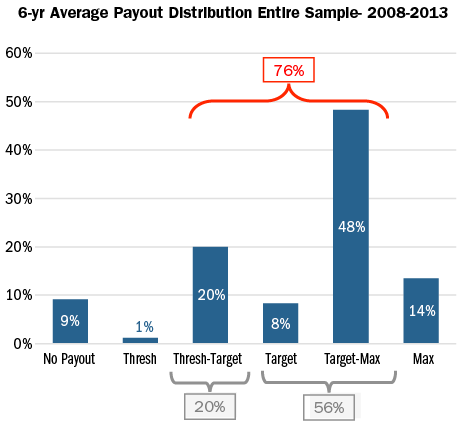
This analysis of the payout distribution is helpful in defining the degree of difficulty, or “stretch”, embedded in performance goals. Our analysis can be summarized with the following rule of thumb where Compensation Committees structure annual bonus performance goals with:
- A 90% chance of achieving Threshold performance
- A 70% chance of achieving Target performance
- A 15% chance of achieving Maximum performance
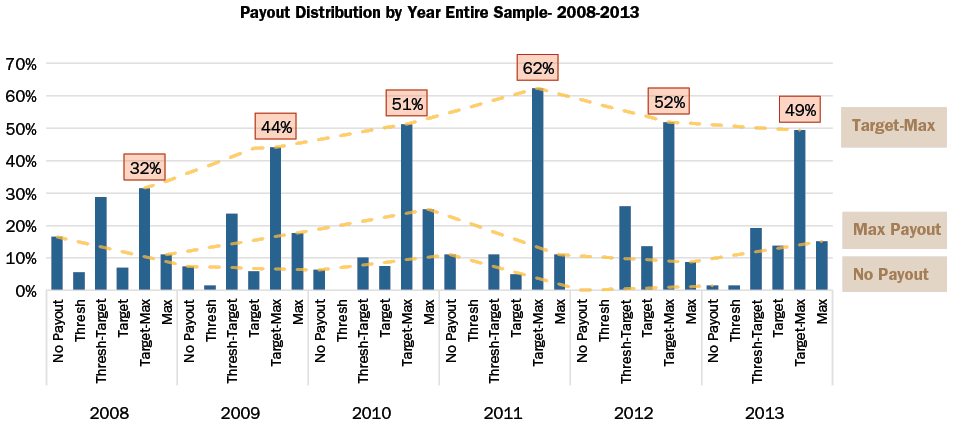
When the payout distributions are reviewed by year, the percentage of companies that paid target to maximum steadily increased from 2008-2011. This reflects an improvement in the overall economy since the financial crisis in 2008 as well as a greater ability to forecast performance in a more stable environment.
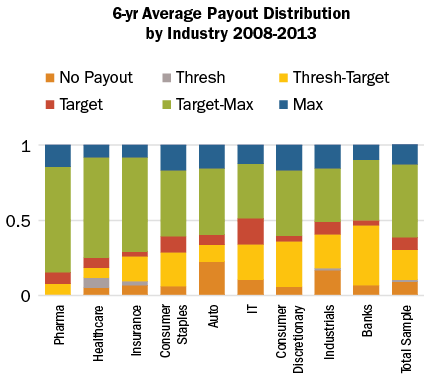
By Industry
While historical payout levels vary by industry, all industries, on average, have most frequently paid bonuses between target and maximum. The Auto and Industrials industries are notable outliers in that executives received zero payouts once in every four years and once in every five years, respectively, likely indicative of industry dynamics and macro-economic conditions more than overly rigorous goal setting. Most cases when Auto companies did not pay annual incentives occurred in 2008, the peak of the financial crisis. Average payouts for each industry are distributed as indicated in the following chart:
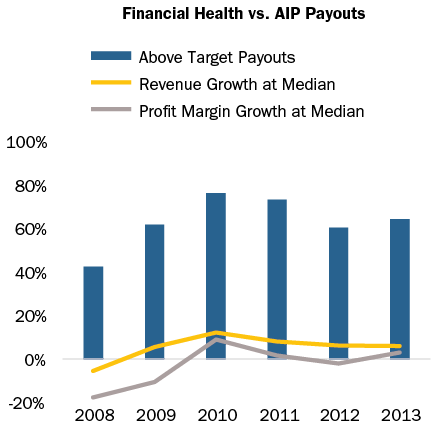
Relative to Performance
Over the past 6 years, the number of above target annual incentive payouts in a given year has generally tracked revenue growth and profit margin growth in the same year. In particular, payouts at Industrial and Pharmaceutical companies have aligned directionally with revenue and profit margin growth. This pay and performance relationship is key to aligning executives’ interests with those of shareholders. If the company exceeds anticipated performance, executives will earn above target payout levels without contest from internal or external stakeholders; however, if an executive is able to achieve extraordinary levels of pay without extraordinary performance, Committees risk facing opposition from shareholders and proxy advisory firms.
The chart below depicts the relationship between median revenue and profit margin growth and above target annual incentive payouts.
Conclusion
Threshold and target annual incentive performance goals are intended to be challenging but attainable. Maximum performance goals are meant to be attained only when executives achieve exceptional performance, exceeding internal/external expectations. Our study supports the formulation of a general rule of thumb, based on analysis of the past 6 years, where the degree of difficulty, or “stretch”, embedded in performance goals translates to:
- A 90% chance of achieving Threshold performance;
- A 70% chance of achieving Target performance; and
- A 15% chance of achieving Maximum performance.
This distribution indicates that Compensation Committees have built an appropriate degree of stretch into annual incentive plans overall.
We believe that when Committees set performance goals, they are influenced by prior year performance as well as economic and industry outlooks. Yet when measuring the directional trend over the past six years, we believe that Compensation Committees are adequately aligning internal performance goals with incentive payout objectives, and developing rational stretch above and below target — thus striking the right balance between the size and frequency of annual incentive payouts.
Methodology
Compensation Advisory Partners (“CAP”) reviewed the annual incentive plan designs of approximately 100 large companies representing a cross-section of industries. The companies included in this study have median revenues of $33 billion, a median market cap of $52 billion and a median 6-year total shareholder return of 9%, through year end 2013.
CAP analyzed the annual incentive plan payouts of the companies in the sample over the past 6 years to determine the distribution of incentive payments and the frequency with which executives typically achieve target payouts. In this analysis, CAP categorized actual bonus payments (as a percent of target) into one of six categories based on payout ranges as depicted in the following chart:
|
Payout Category |
Payout Range |
|
No Payout |
0% |
|
Threshold |
Up to 5% above Threshold |
|
Threshold – Target |
5% above Threshold to 5% below Target |
|
Target |
+/- 5% of Target |
|
Target – Max |
5% above Target to 5% below Max |
|
Max |
5% below Max to Max |
HIGHLIGHTS
- Companies rarely make wholesale changes to plans, but frequently revisit the performance metrics used
- Most companies use multiple measures to ensure the plan provides balance and aligns with overall business strategy
- Overall, 2013 annual incentive payouts were higher than in 2012 indicating stronger performance
Survey Sample
Compensation Advisory Partners (“CAP”) reviewed 2014 proxy disclosures at a sample of 100 companies among the Fortune 500 representing nine industry groups. Industry groups included: Automotive, Consumer Goods, Financial Services, Health Care, Insurance, Manufacturing, Pharmaceutical, Retail, and Technology. For the companies studied, the median revenue size and market capitalization was $32B and $52B, respectively. The median 2013 total shareholder return (TSR // change in stock price plus dividends) was 43%.
CHANGES IN ANNUAL INCENTIVE PLAN DESIGN
Overall, 34% of companies in CAP’s study changed their annual incentive plan design in 2013 or 2014. The most common changes were to the performance metrics used to fund awards (47% of the companies making a change) or to the weightings applicable to performance metrics (32%). Another frequent change was to increase the target award opportunities offered to Named Executive Officers; reductions in target awards were made much less frequently. These changes, as well as other modifications shown in the chart on the right, illustrate that companies continue to review and enhance the pay-for-performance relationship through changes to the annual incentive program.
|
Type of Change Reported in CD&A |
2013 No. of Cos. |
% of Cos. Reporting Changes |
||
|
2013 (n = 34) |
2012 (n = 37) |
2011 (n = 43) |
||
|
Change in performance metrics used to fund awards |
16 |
47% |
43% |
28% |
|
Change in performance metric weighting/mix |
11 |
32% |
35% |
42% |
|
Increased/Reduced target award opportunities (CEO and/or CFO) |
11 |
32% |
11% |
21% |
|
Other changes |
4 |
12% |
22% |
19% |
|
Change in maximum award payout |
3 |
9% |
8% |
12% |
Note: Due to multiple changes, does not add up to 100%.
Change in Performance Metrics
Among the companies that changed the annual incentive performance metrics, about one-half of companies modified plan metrics while maintaining the current number of metrics to better align pay with performance:
- Ten (10) companies kept the same number of metrics but replaced a metric in the incentive plan
- Four (4) companies reduced the number of metrics, and
- Two (2) companies added metrics to the current plan.
Several companies indicated that their rationale for changing annual incentive metrics was, in large part, to have a more holistic view of overall company performance and to better align incentives with their business strategy:
- AFLAC Inc: Added Operating Return On Equity (OROE) as a performance metric for senior vice presidents and above; this metric allows shareholders to evaluate AFLAC’s financial achievements relative to other organizations in terms of how effectively capital is used to generate earnings
- Danaher Corp: Added Return On Investment Capital (ROIC) in order to help validate the efficiency of earnings and complement the cash flow metric
- United Technologies Corp: Changed the earnings metric from EPS to Net Income since Net Income is not impacted by share repurchases
- Bristol-Myers Squibb: Replaced Adjusted Net Cash Flow from Operations with a metric for pipeline performance that consists of regulatory submissions and approvals and is a better indication of long-term growth potential.
Change in Target Bonus Opportunity
In 2013, median target bonus opportunities for CEOs increased (by 9 percentage points), while the opportunities for CFOs decreased (by 3 percentage points). Most notably, target bonus opportunity for CEOs in the Automotive, Insurance, and Retail industries increased by 10 percentage points year over year. However, the Technology industry experienced a significant decrease (21 percentage points) due to an increase in the base salary for Cisco’s CEO (from $375,000 to $1,100,000) and a decrease in the target opportunity for the new CEO at Intel (from 462.7% of base salary to 239.2%).
Median target bonus opportunity for CFOs in the Automotive industry experienced a decrease of 5 percentage points in 2013 largely due to the promotion of a new CFO at Goodyear (target opportunity decreased from 91% to 63% of base salary). Conversely, target bonus opportunity for CFOs in the Insurance industry increased (8 percentage points) in 2013; all other industries saw little movement to the target bonus opportunity.
|
Industry |
Median Target Bonus as a % of Salary |
|||||
|
CEO |
CFO |
|||||
|
2013 |
2012 |
2011 |
2013 |
2012 |
2011 |
|
|
Automotive |
135% |
125% |
130% |
85% |
90% |
88% |
|
Consumer Goods |
160% |
160% |
170% |
93% |
95% |
100% |
|
Financial Services |
n/m |
n/m |
n/m |
n/m |
n/m |
n/m |
|
Health Care |
150% |
145% |
145% |
100% |
101% |
100% |
|
Insurance |
210% |
200% |
200% |
133% |
125% |
120% |
|
Manufacturing |
157% |
154% |
156% |
100% |
97% |
95% |
|
Pharmaceutical |
150% |
150% |
150% |
98% |
97% |
91% |
|
Retail |
180% |
170% |
168% |
85% |
83% |
85% |
|
Technology |
210% |
231% |
200% |
130% |
131% |
121% |
|
Total Sample |
166% |
157% |
153% |
100% |
103% |
100% |
Note: Financial Services industry is excluded since most companies in our study do not disclose target bonus opportunities for the Named Executive Officers.
ANNUAL INCENTIVE PLAN DESIGN / PRACTICES
Award Leverage
Disclosure of the payout range (i.e., both threshold and maximum payout as a percentage of target) is a limited practice as most companies reviewed did not disclose a threshold level of performance required to receive a bonus payment. For the 37 companies that disclose a threshold bonus, 50% of target is the most common payout percentage. However, 20 companies disclose a minimum bonus payout of less than 50% of target; a majority of these companies provide a payout based on multiple plan metrics.
Approximately 75% of companies disclose the maximum bonus opportunity. A majority (60%) have a maximum bonus opportunity of 200% of target bonus. Ten (10) companies have a maximum bonus of 250% of target or higher. A majority of these companies are in the Consumer Goods, Pharmaceutical, and Technology industries.
|
Threshold as a % of Target (n=37) |
Maximum as a % of Target (n = 73) |
|||||
|
Range |
# of Cos. |
% of Cos. |
Range |
# of Cos. |
% of Cos. |
|
|
< 25% |
10 |
27% |
> 125% < 150% |
2 |
3% |
|
|
> 25% < 50% |
10 |
27% |
> 150% < 200% |
14 |
19% |
|
|
50% |
13 |
35% |
200% |
44 |
60% |
|
|
> 75% < 100% |
4 |
11% |
> 200% < 250% |
3 |
4% |
|
|
> 250% |
10 |
14% |
||||
Annual Incentive Plan Metrics
EPS, Revenue, Cash Flow and Operating Income are the most prevalent metrics used in annual incentive plans. Although EPS is the most common metric overall, it is the most common metric for only two industries (Financial Services and Healthcare). Revenue, the second most common metric, is the most prevalent in four industries (Consumer Goods, Pharmaceutical, Retail and Technology). Our findings suggest that EPS is used more broadly across industries while Revenue tends to be used in consumer-driven industries.
Most companies (approximately 70%) use more than one performance metric in the annual incentive plan. 25% of companies disclose using two (2) metrics in their annual incentive programs, 25% use three (3) metrics, and 21% of companies use four (4) or more metrics. Approximately 62% of these companies use a profit-based metric in combination with Revenue and/or Cash Flow.
The chart below shows the three (3) most metrics by industry in 2013:
|
Industry |
Metric #1 |
Metric #2 |
Metric #3 |
|
Automotive |
Cash Flow (45%) |
EBIT (45%) |
ROA (27%) |
|
Consumer Goods |
Revenue (67%) |
EPS (58%) |
Cash Flow (33%) |
|
Financial Services |
EPS (33%) |
ROE (17%) |
Op. Income (8%) |
|
Health Care |
EPS (40%) |
Op. Income (30%) |
EBIT (30%) |
|
Insurance |
Op. Income (46%) |
Op. ROE (23%) |
Op. EPS (15%) |
|
Manufacturing |
Cash Flow (30%) |
EPS (30%) |
Revenue (20%) |
|
Pharmaceutical |
Revenue (70%) |
EPS (70%) |
Pipeline/R&D (50%) |
|
Retail |
Revenue (40%) |
Op. Income (40%) |
EBIT (30%) |
|
Technology |
Revenue (58%) |
Cash Flow (50%) |
Op. Income (33%) |
Note: Percentages reflect the prevalence of companies disclosing the metric.
*Return metrics include: ROE, Op. ROE, ROA, and ROI/ROIC
2013 Actual Bonus Payout
Nearly all companies (98%) in our research awarded bonuses to their Named Executive Officers for 2013 performance. Overall, the median CEO bonus was 121% of target compared to 112% in 2012, indicating that 2013 performance was generally stronger than 2012. Most industries exceeded target bonus payouts by 11 – 65 percentage points. However, two industries (Retail and Technology) fell short of expectations by 22 and 12 percentage points, respectively.
Use of deferral mechanisms in the annual incentive plan is a limited practice and is more common in the Financial Services industry given regulations from the Federal Reserve. However, a few companies across industries also have a deferral policy in place. Companies typically defer annual incentive payment in the form of restricted stock/units.
|
Industry |
Actual Bonus as a % of Target Bonus – CEO |
||||||||
|
75th Percentile |
Median |
25th Percentile |
|||||||
|
2013 |
2012 |
2011 |
2013 |
2012 |
2011 |
2013 |
2012 |
2011 |
|
|
Automotive |
183% |
131% |
186% |
165% |
102% |
153% |
127% |
69% |
130% |
|
Consumer Goods |
133% |
137% |
149% |
112% |
103% |
132% |
70% |
94% |
78% |
|
Financial Services |
142% |
120% |
130% |
126% |
80% |
114% |
101% |
44% |
111% |
|
Health Care |
149% |
157% |
159% |
127% |
127% |
127% |
116% |
103% |
116% |
|
Insurance |
170% |
144% |
130% |
150% |
130% |
106% |
123% |
112% |
85% |
|
Manufacturing |
119% |
146% |
162% |
111% |
107% |
136% |
98% |
100% |
119% |
|
Pharmaceutical |
158% |
156% |
161% |
138% |
142% |
144% |
122% |
125% |
130% |
|
Retail |
119% |
136% |
147% |
78% |
117% |
129% |
68% |
79% |
112% |
|
Technology |
121% |
124% |
149% |
88% |
99% |
100% |
69% |
90% |
75% |
|
Total Sample |
151% |
144% |
156% |
121% |
112% |
133% |
96% |
93% |
105% |
Note: Most companies in the Financial Services industry does not disclose target bonus. Figures for the Financial Services industry reflects bonus as a percentage of 3-year average actual bonus.
Use of Discretion
Approximately 50% of companies in our research disclose the use of discretion in the annual incentive plan. Among these companies, approximately 40% allow only for downward adjustments of the final payout. Approximately 55% allow for both upward and downward adjustments by funding bonuses for Name Executive Officers at maximum based on a financial metric (this is unrelated to the final award allocation which may have additional performance requirements) to ensure compliance with Section162(m) of the Internal Revenue Code. This approach provides the Committee with the most flexibility in determining the bonus payout.
Conclusion
Given significant changes to the annual incentive plan design in recent years, companies rarely made wholesale changes to the overall plan design in 2013 or for 2014. Among the companies that made changes, most were focusing on refining the incentive metrics to ensure a more complete view of company performance and alignment with the overall business strategy. Despite these changes to the incentive metrics, EPS, Revenue, Cash Flow and Operating Income continue to be most common. While we would not expect to see extensive changes to the incentive plan design in the future, we anticipate that companies will continue to refine their metrics and the metric weightings as they continue to ensure executive pay is aligned with performance.
Regional banks in the Western states rely heavily on cash to compensate their Chief Executive Officers (CEOs), according to recent proxy data analyzed by Vivient Consulting and compiled by Main Data Group. We analyzed the 2014 proxies for the Chief Executive Officer position at over 40 publicly-traded banks ranging in asset size from $500 million to $10 billion in the 10 Western states. The median bank asset size is $1.4 billion, with approximately one-third of the banks in the $2B to $9.9B asset size range. Median performance metrics were 1.0% Return on Assets (ROA) and 8.7% Return on Equity (ROE).
Partner Susan Schroeder and Principal Bonnie Schindler are interviewed on their 2014 survey private company incentive pay practices.
Underlying the Fed’s input to financial institutions is a legitimate concern about the potential for incentives to encourage excessive risk taking. The Fed has stated that: “risk-taking incentives provided by incentive compensation arrangements in the financial services industry were a contributing factor to the financial crisis that began in 2007” and “Before the crisis, large banking organizations did not pay adequate attention to risk when designing and operating their incentive compensation systems.” Agree or disagree with these points, over the past several years compensation-related risk management processes have vastly improved.
In this CAPflash, we provide an overview of how compensation practices have evolved following the Fed’s guidance, what (in our view) the Fed has got “right” and where they may have gone too far, and what we expect to see from banks and regulators in the near future.
Where We Are Now
The Final Guidance was principles-based, leaving leeway for implementation to consider differences among the institutions subject to this new level of oversight. For example, companies with significant differences in their businesses, such as select investment banks, custody banks, regional banks, and credit card companies were all subject to the same guidance. In its October 2011 publication, the Federal Reserve noted, “The interagency guidance helps to avoid the potential hazards or unintended consequences that would be associated with rigid, one-size-fits-all supervisory limits or formulas.” In our experience, banks devoted considerable time and resources to demonstrate substantial conformance with the new requirements, but went about responding and demonstrating conformance to regulators in different ways.
The Interagency Guidance was founded on three key principles:
- Balance between risks and results. Incentive compensation arrangements should balance risk and financial results in a manner that does not encourage employees to expose their organizations to imprudent risks;
- Processes and controls that reinforce balance. A banking organization’s risk-management processes and internal controls should reinforce and support the development and maintenance of balanced incentive compensation arrangements; and
- Effective corporate governance. Banking organizations should have strong and effective corporate governance to help ensure sound incentive compensation practices, including active and effective oversight by the board of directors.
Improved Risk Management
In our experience, companies have come a long way in addressing all three key principles. Most banks have greatly strengthened their risk management processes and ensured that the risk function has a defined role in reviewing compensation design, as well as performance outcomes and their impact on compensation payments. Where the risk function seldom had any role in the incentive compensation process in the past, they are now integrated into the process. Similarly, great strides have been made to ensure that Compensation Committees are informed about risk-taking within the organization and how incentive compensation designs across the company address risk. Many banks have also formed internal committees responsible for maintaining controls and risk oversight of incentive compensation plans across their organizations.
Prescribing Plan Design
The Fed and other agencies have become more prescriptive in their “guidance” to banks, at times almost to the point of allowing for limited leeway in compensation practices. The table below provides a summary of the methods for linking compensation and risk outcomes described in the Final Guidance, and select examples of how current compensation design practices have evolved based on input from regulators.
|
Areas of Principles- based Interagency Guidance |
Select Examples of Design Practices Reacting to Fed Direction |
|
Deferred Incentive Compensation |
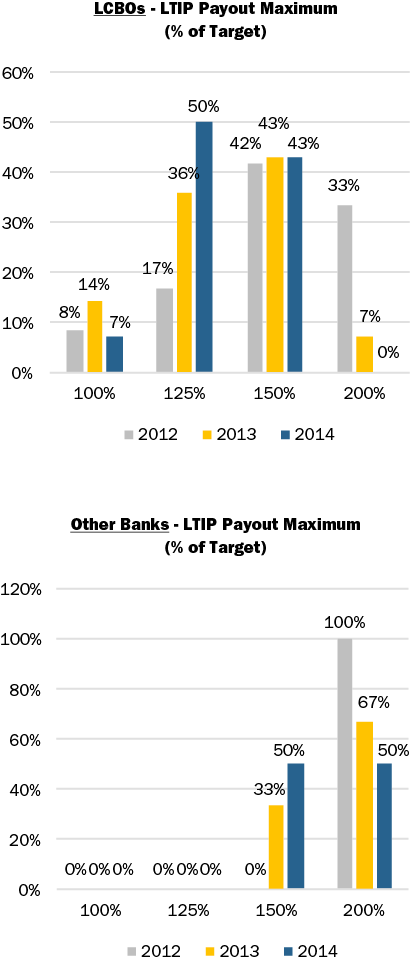
Significant Changes Reduced upside leverage in long-term performance plans (from 200% to 125%-150% of target) Elimination of stock options (or significant reduction to modest percentage of total long-term) |
|
Risk Adjustment of Incentives |
Significant Changes Risk-adjusting incentive pools Performance-based adjustments that apply to deferrals/long-term incentives over the full vesting period with ability to reduce awards to zero based on risk outcomes |
|
Other Methods that Promote Balanced Risk-Taking Incentives |
Modest Changes Discretionary annual incentives most common (some shifts where formula-based payouts had existed) Reduced upside leverage in annual incentive plans, at times with corresponding increases to fixed pay (salaries) Some reduction in the use of relative performance measures in annual and/or long-term incentive plans |
|
Enhanced Control Functions |
Modest Changes Risk management and internal control functions involved in designing, implementing, and evaluating incentive arrangements to ensure proper risk-balancing in a more formal way |
|
Strong Corporate Governance |
Modest Changes Increased Board/Committee oversight of incentive compensation arrangements below senior executive level, for other covered employees (including non-executives) Mechanisms to facilitate communication between the Compensation Committee and Risk and Audit Committees |
In our view, the area where the Federal Reserve has had the most positive impact on incentive compensation design is in requiring deferrals to be subject to performance adjustment, before and after grant, based on risk outcomes (generally not the case before the guidance). Other changes encouraged by the Fed (e.g., eliminating/reducing stock options, reducing upside incentive plan leverage to 125%-150% of target, reducing the use of relative measures, etc.) seem to be less well founded in the principles of risk balancing and more arbitrary. It is difficult to identify the role that these incentive design features played in the financial crisis and it seems to us that Fed input on these areas is based more on theoretical objections than any empirical data supporting the hypothesis that these incentive design features encouraged excessive risk-taking among executives at financial institutions.
Future Concerns and Expectations
U.S. regulators should be commended for maintaining a largely hands off approach thus far with respect to pay levels, focusing primarily on incentive compensation design and control features. This approach provides a strong focus on risk balancing of incentive compensation, while recognizing the need for the industry to maintain competitive compensation programs. In contrast, in the European Union, CRD-IV places caps on the level of incentive pay that may be delivered (as a ratio of fixed pay). This type of regulation severely limits the ability to implement a pay-for-performance compensation design and, in response, has led many companies to increase fixed pay. As a result, CRD-IV has potentially harmed shareholders by weakening the pay-for-performance relationship. Thankfully, to-date, the Fed has avoided this kind of heavy-handed approach in addressing compensation in U.S. financial institutions.
Still, we may have unanticipated consequences in the U.S. Many shareholders and shareholder advisory groups prefer formulaic performance-based incentive arrangements to discretionary incentives, as they fear that discretion will be used for the benefit of management. However, because regulators have discouraged formulaic, performance-based upside in incentive compensation plans, many financial institutions have moved to more discretionary incentive arrangements to allow for greater flexibility to compensate executives. Another potential response to the Fed’s input is that, over time, financial institutions may increase pay levels to address concerns that executive talent will depart for other industries (e.g., hedge funds, private equity, asset management) where there are no restrictions on incentive design.
Going forward, we expect regulators to provide more guidance on monitoring and validation processes and results. Many companies developed approaches to retrospectively review risk outcomes and the corresponding impact on compensation decisions, but communicating these processes and results for all covered employees to regulators is still, generally, in early stages. Regarding incentive plan upside leverage, regulators have started to state more and more directly a belief that 125% is most appropriate, but many banks have held their ground at 150%. Some of the banks that moved to 125% may start to re-evaluate their program and consider moving back to 150% to remain competitive.
As companies and Committees try to “live with” the restrictions of the guidance, we expect to see a continued move away from formal targets and increased use of discretion, increases in pay levels to recognize decreased incentive plan upside leverage, and challenges in applying risk adjustments and clawbacks.
Conclusion
Incentive compensation processes and designs among financial institutions have changed a great deal over the past four years, to a large degree driven by regulatory input. If we look back at the principles (Final Guidance), most banks have come a long way in addressing them. At this point, we hope that regulators can step back and consider how much progress has been made and consider taking a pause to begin to evaluate what changes were necessary and effective and what changes may have been excessive.
Appendix – Summary Market Data
[company-by-company data available upon request]
Methodology
CAP reviewed 2012, 2013, and 2014 proxy statements and the most recent equity award agreements of the 23 large publicly-traded banks1 that were included as part of the Federal Reserve’s horizontal review of incentive compensation. Our analysis looked for year-over-year changes in compensation structure, annual and long-term incentive design, performance-based vesting, recoupment policies and stock ownership guidelines/retention requirements.
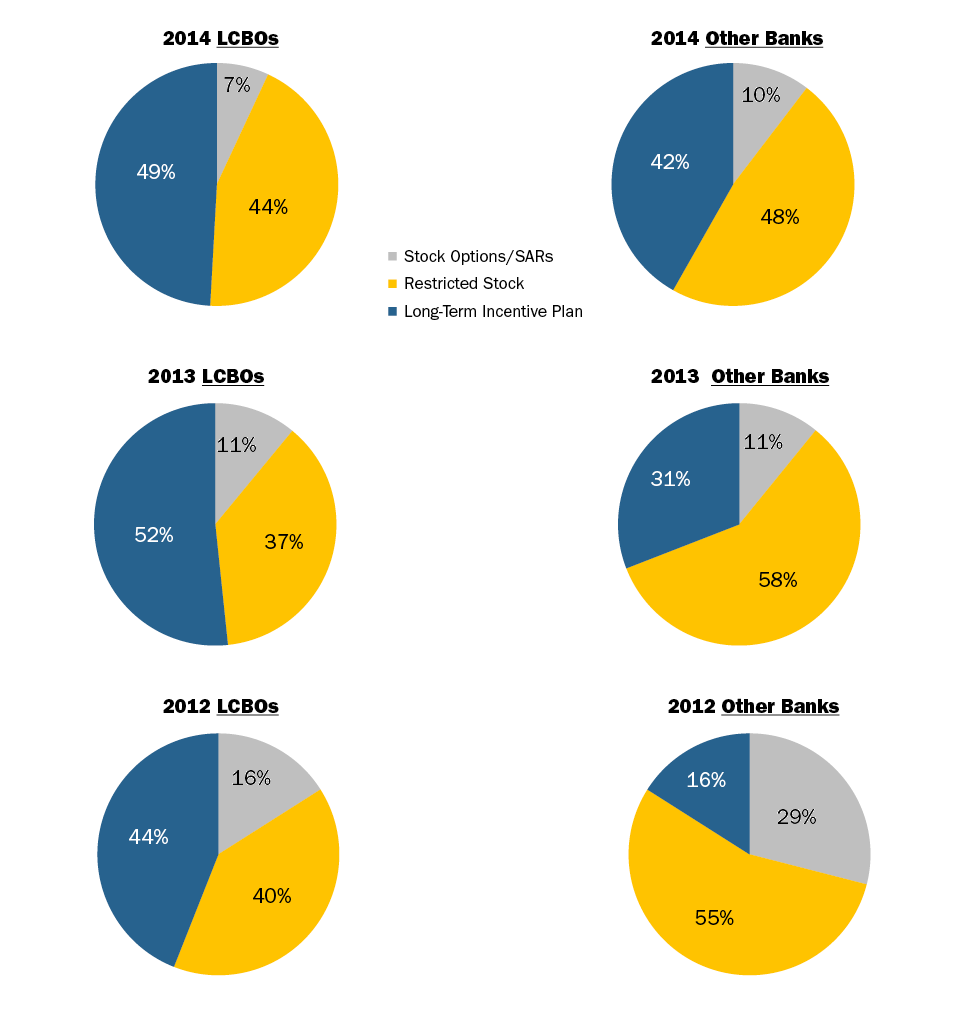
Select summary data is shown below. Findings have been divided into two data sets, large complex banking organizations (LCBOs) and other large banks with assets exceeds $50 billion. LCBOs are one year ahead of the other large banks in terms of their interaction with the Fed, and the related implications on compensation program design.
Long-term Incentive Mix, 2012-2014
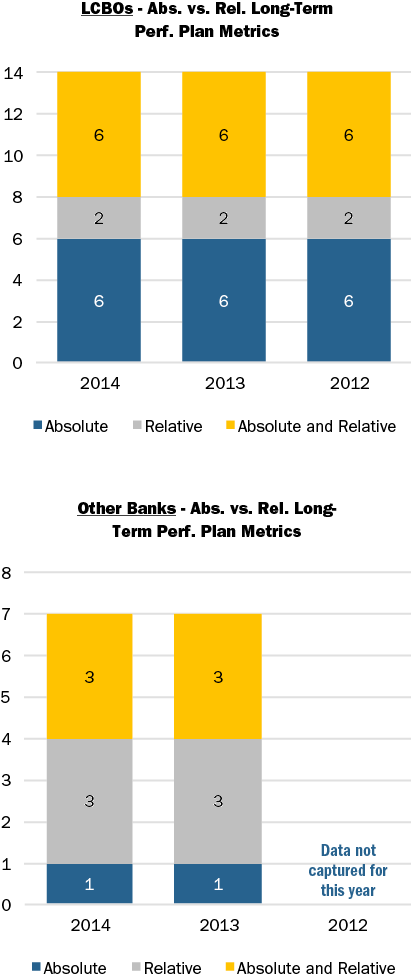
Long-term Incentive Absolute vs. Relative Performance Metrics, 2012-2014
Long-term Performance Plan Maximum Upside Leverage, 2012-2014
Stock Ownership Requirements
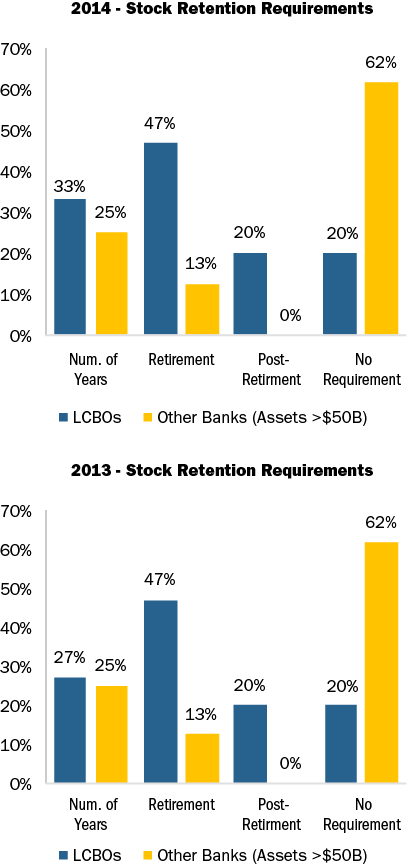
Some companies differentiate stock retention requirements for the CEO versus Other NEOs. Therefore in some instances the prevalence shown is greater than 100 percent.
Research assistance was provided by: Myron Lising, Roman Beleuta, Michael Biagi, Michael Bonner, Rachael Holland, and Jasmine Yanes.
1 Companies reviewed include American Express, Bank of America, BNY Mellon, Citigroup, Capital One Financial, Discover Financial Services, Goldman Sachs, JPMorgan Chase, Morgan Stanley, Northern Trust, PNC, State Street, SunTrust Bank, US Bancorp, Wells Fargo, BB&T, Comerica, Fifth Third, Huntington Bancshares, KeyCorp, M&T Bank, Regions and Zions Bancorp.
Do incentive-pay practices differ between publicly traded and privately held companies? If so, how? Research released this year by WorldatWork, Deloitte Consulting and Vivient Consulting set out to answer these questions.
Incentive-pay practices do differ between public and private companies. Short-term incentives (STIs), including annual incentive plans, are structured similarly across both organizational types. However, public companies are much more likely than their private counterparts to offer STIs to the broader employee population. In contrast, private companies place greater emphasis on STIs in their total rewards programs, as STIs are the companies’ most effective compensation tool for attracting and retaining talent. However, private companies tend to reserve short-term rewards for exempt employees and above.
On the long-term side, publicly traded companies rely heavily on long-term incentives (LTIs), such as restricted stock and stock options. Restricted stock has surpassed stock options as the LTI vehicle of choice for public companies. In contrast, private companies favor cash LTI plans, such as bonus plans with goals and payouts tied to multiyear performance, over real equity. Public companies are more likely to make broad-based equity grants to the larger employee population, while private companies concentrate LTI awards on top executives.


