DOWNLOAD A PDF OF THIS REPORT pdf(0.3MB)
Contact
Roman BeleutaPartner [email protected] 646-532-5932 Kelly Malafis
Founding Partner [email protected] 212-921-9357
Compensation Advisory Partners (CAP) provides an annual update on pay levels for Chief Financial Officers (CFOs) and Chief Executive Officers (CEOs). This year’s update is based on a sample of 118 companies with median revenue of $12 billion. Additional information on criteria used to develop the sample of companies is included in the Appendix.
Highlights 2016 vs 2015
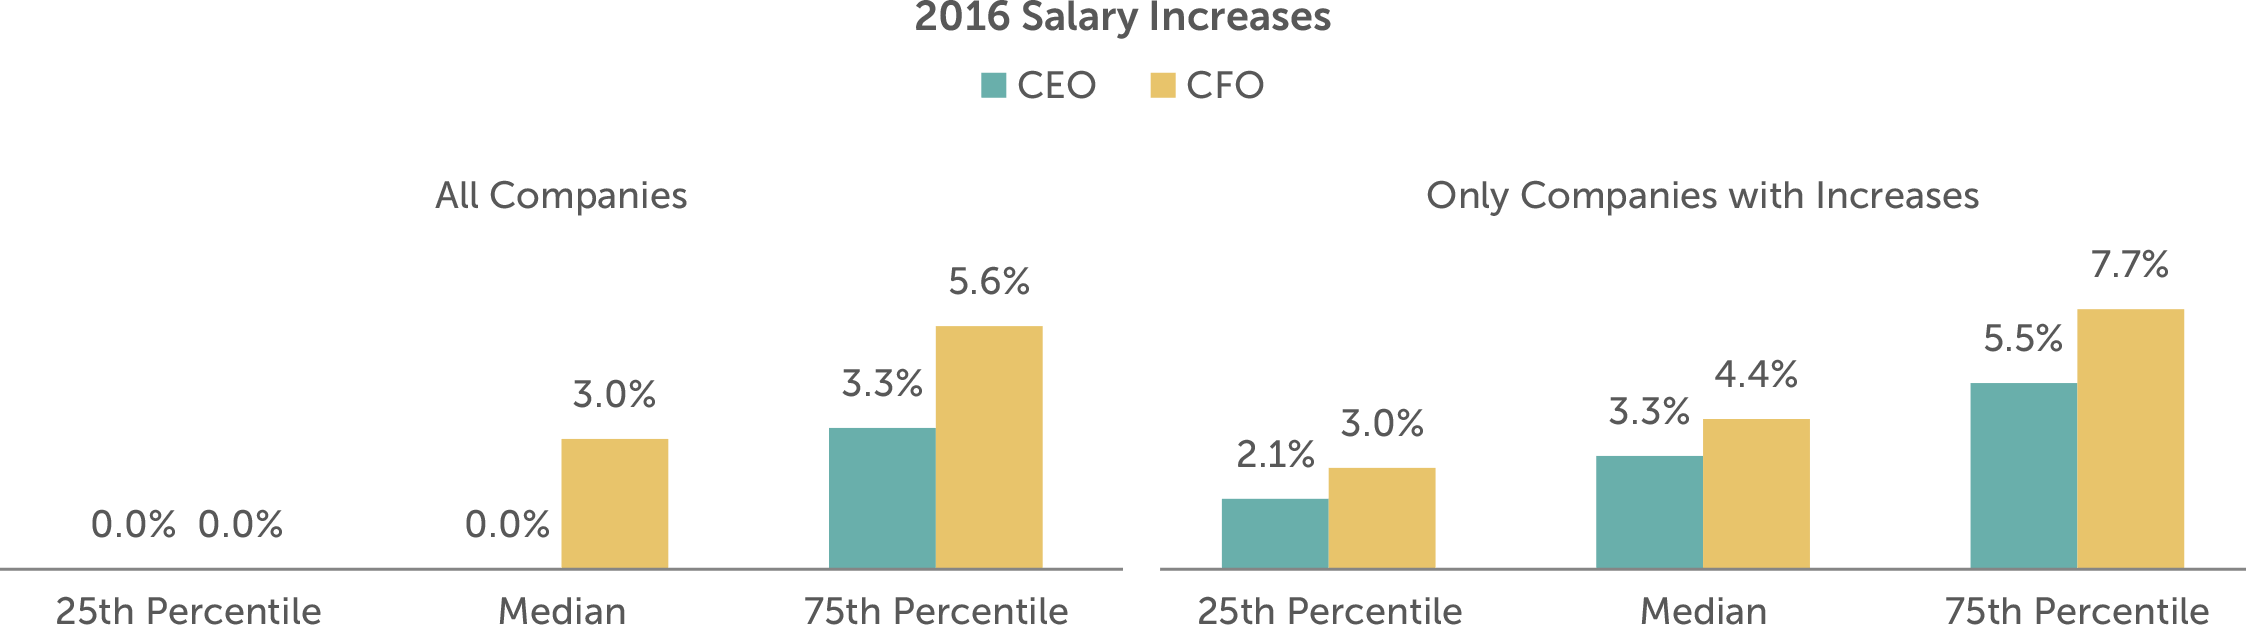
- Adjustments to base salaries were less frequent in 2016 than in the past 3 years for CEOs and CFOs. Less than 50% of companies made increases in 2016 for CEOs, resulting in a median increase of 0%, while 70% of CFOs received an increase, with median increase of 3.0%
- Among the companies that made salary increases, the median CEO and CFO 2016 increase was 3.3% and 4.4%, respectively, and these increases were lower compared to the increases in our 2015 study (3.8% and 5.1% respectively)
- The 2016 median increases in actual total direct compensation (i.e., cash plus equity) for both CEOs and CFOs were 5.4% and 3.9%, respectively
- Median actual bonus increases were up modestly, 1.5% for CEOs and 1.1% for CFOs, reflective of modest performance improvement (revenue and net income growth) in 2016
- Median target bonus opportunities remained unchanged for both CEOs (150% of salary) and CFOs (100% of salary), with CEO target bonus unchanged for the fourth year of our study
- Growth in long-term incentive opportunities at median approximated 4% for both positions
- CFO total compensation continues to approximate one-third of CEO total pay
- The emphasis of variable pay over fixed pay, and performance-based equity over time-based equity, continues
Study Results
Salaries
In the past, we have seen a steady growth in the number of CEOs and CFOs receiving salary increases in each year. However, for the 2015-2016 period the salary increase prevalence of 49% for CEOs and 71% for CFOs was lower than more recent years and comparable to the 2012-2013 period where only 48% and 69% of CEOs and CFOs, respectively, received increases. Median 2016 salary increases were 3.0% for CFOs and 0% for CEOs.
|
% of Executives Receiving Salary Increases |
||||
|
|
2014 – 2015 |
2015 – 2016 |
||
|
Position |
No Increase |
Receiving Increase |
No Increase |
Receiving Increase |
|
CEO |
42% |
58% |
51% |
49% |
|
CFO |
23% |
77% |
29% |
71% |
Actual Pay Levels
As shown in the table below, salary increases were higher for CFOs since most CEOs did not receive an increase. Yet, the median increases in actual bonus and long-term incentives remained similar for both CFOs and CEOs.
The median rate of increase in actual total direct compensation levels for CEOs and CFOs was 5.4% and 3.9% in 2016, respectively. We also found that in 60% of companies CFOs were receiving higher increases (6.2% at median) than CEOs. However, in the 40% of companies where CEO increases were higher, the median increase approximated 1.5x the CFO increase, contributing to the slightly higher increase in actual total direct compensation for CEOs.
|
Median Percentage Change in Pay Components |
||||
|
Pay Components |
2014 – 2015 |
2015 – 2016 |
||
|
CEO |
CFO |
CEO |
CFO |
|
|
Salary |
2.5% |
3.9% |
0.0% |
3.0% |
|
Actual Bonus |
0.0% |
-0.1% |
1.5% |
1.1% |
|
Long-Term Incentives |
6.8% |
7.6% |
3.8% |
4.1% |
|
Actual Total Direct Compensation |
2.2% |
1.4% |
5.4% |
3.9% |
Similar to actual bonuses, median target bonuses remained flat for both CFOs and CEOs.
|
Target Bonus as % of Salary |
||||
|
Summary Statistics |
2015 |
2016 |
||
|
CEO |
CFO |
CEO |
CFO |
|
|
25th Percentile |
130% |
80% |
138% |
85% |
|
Median |
150% |
100% |
150% |
100% |
|
75th Percentile |
180% |
120% |
190% |
120% |
Median Pay Increase by Industry1
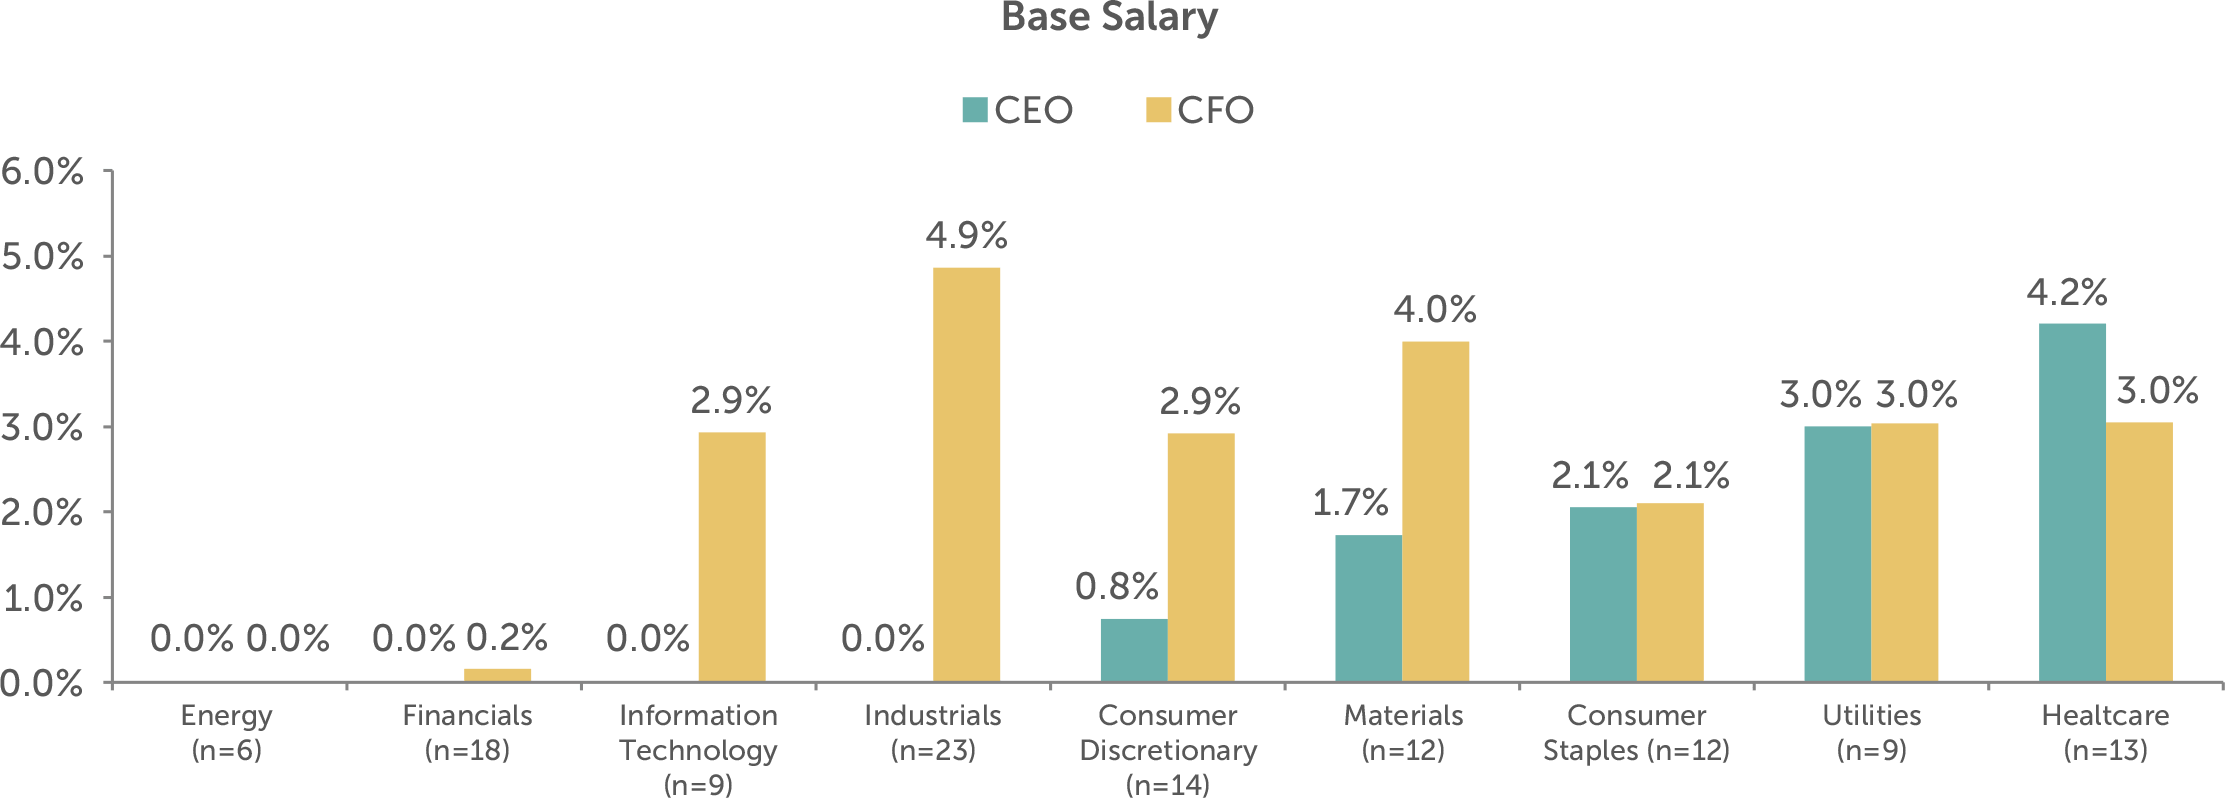
Median salary increases were generally aligned between CEOs and CFOs in 5 of 9 industries. There were some differences in the Consumer Discretionary, Industrials, Information Technology, and Materials industries. The biggest difference was in the Industrials industry where the median CEO increase was 0% compared to the CFO median increase of 4.9%. In the Industrials industry, only 10 of 23 CEOs received a salary increase with a median of 3.2%, compared with 19 of 23 CFOs received salary increases with a median of 6.3%. The Energy industry increases were 0% for both CFOs and CEOs for the second year in a row as the industry continues to face challenges with low oil prices.
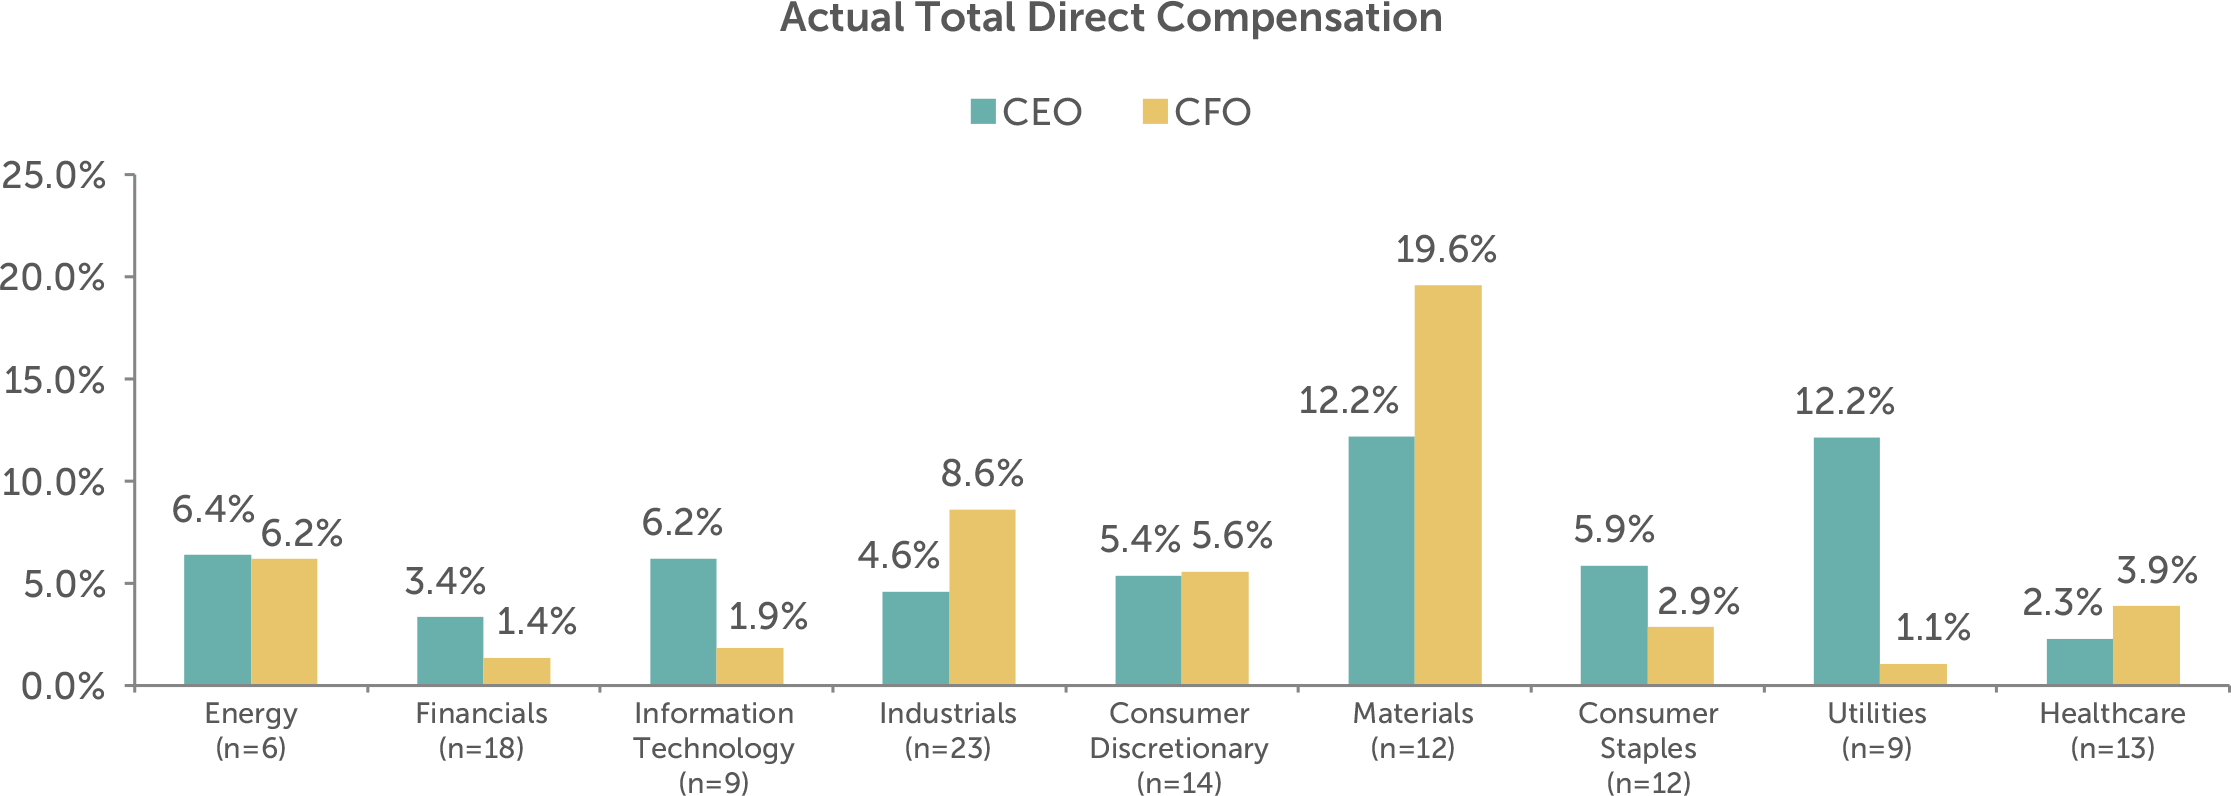
Differences by industry were slightly more pronounced when looking at actual total direct compensation, with the biggest difference in the Utilities industry where the median increase was 12.2% for CEOs and 1.1% for CFOs. Given a sample of 9 companies, the median results are skewed by two companies that had very different increases for each position. Excluding these outliers creates a narrower difference (approximately 3%) between median CEO and CFO increases. None of the industries saw a decrease in total compensation at median.
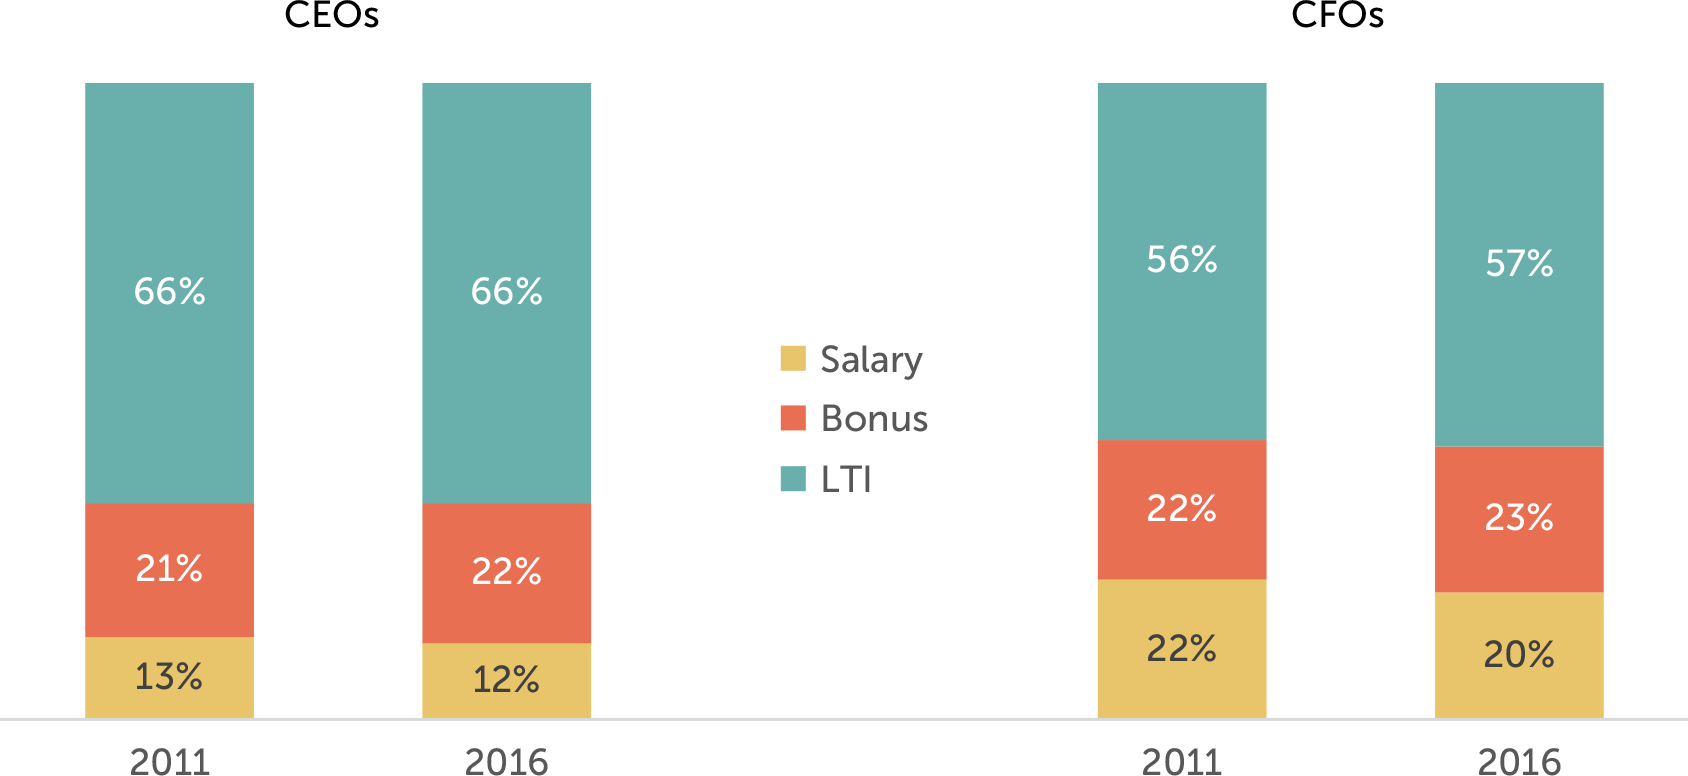
Target Pay Mix
The structure of the overall pay program (salary, bonus, LTI) has remained largely unchanged since 2011. CEOs continue to receive less in the form of salary and more in variable pay opportunities, especially LTI, than CFOs.
Long-Term Incentive (LTI) Vehicle Prevalence and Mix
There was very little change in the type of vehicles used to deliver LTI awards in 2016 vs. 2015. Most companies continue to use two different vehicles to deliver LTI, with approximately 20% of companies studied using all 3 equity vehicles (stock options, time-based stock awards, and performance plan awards).
Performance plans account for roughly 50+% of LTI awards on average among companies studied. The other half of LTI is delivered through an almost equal mix of stock options and time-vested restricted stock awards.
The most notable change since 2011 has been a general shift from stock options to performance plans.
|
LTI Mix |
||||||
|
|
2011 |
2015 |
2016 |
|||
|
LTI Vehicles |
CEO |
CFO |
CEO |
CFO |
CEO |
CFO |
|
Stock Options |
32% |
32% |
24% |
23% |
23% |
22% |
|
Time Vested Restricted Stock |
17% |
22% |
20% |
25% |
20% |
24% |
|
Performance Plans |
51% |
46% |
56% |
52% |
57% |
54% |
Conclusion
2016 performance overall, was generally flat compared to last year. Median revenue growth was 1% (vs -1% in 2015) and net income growth was 0% (vs -1% in 2015). Total shareholder return was much higher in 2016 and most of the growth was post the election results; the full year return was 16% (vs -2% in 2015). Yet total pay increases were slightly higher than in 2015, which we believe were directionally aligned with the small performance improvements.
We expect the overall executive pay mix to continue to emphasize the variable, at-risk components of pay (such as bonuses and LTI). We also expect the emphasis on performance-based LTI plans to remain similar to current practice. Given increased shareholder scrutiny and influence of Say on Pay, we anticipate that aligning pay outcomes with company performance is the imperative for all companies and Boards.
Appendix
Sample Screening Methodology
Based on the screening criteria below, we arrived at a sample of 118 public companies with median 2016 revenue of $12B.
|
Revenue |
At least $5B in revenue for fiscal year 2016 |
|
Fiscal year-end |
Fiscal year-end between 9/1/2016 and 12/31/2016 |
|
Proxy Statement Filing Date |
Proxy statement filed before 3/31/2017 |
|
Tenure |
No change in CEO and CFO incumbents in the past three years |
|
Industry |
All industries have been considered for this analysis |
1 Excludes one company in the Telecommunications Services industry and one in the Real Estate industry.