
DOWNLOAD A PDF OF THIS REPORT pdf(0.1MB)
Contact
Eric HoskenPartner [email protected] 212-921-9363 Michael Bonner
Principal [email protected] 646-486-9744
Compensation Advisory Partners (CAP) conducted a study of executive compensation levels and design practices in the banking industry. The study includes 19 U.S. banks with greater than $50 billion in assets across three different groups: Money Center banks (n=4), Custody banks (n=3), and Super Regional banks (n=12). This report summarizes the findings of CAP’s study and identifies other hot topics in executive compensation affecting the banking industry.
Key Takeaways
- Pay and performance: 2018 performance was mixed. Pre- and post-tax earnings growth improved over the prior period, while revenue growth and total shareholder return (TSR) were weaker. Chief executive officer (CEO) compensation generally aligns with these results, with CEO pay increasing in 2018, but to a lesser degree than in 2017.
- Compensation program design: In recent years, executive incentive plan design among banks in this group has been stable. Earnings per share (EPS) is the most common short-term incentive metric and return on tangible common equity (ROTCE) is the most common long-term incentive metric. Stock options continue to be less common among banks than among companies in other industries.
- Looking ahead: Diversity and inclusion and gender pay equity, the adoption of the new credit loss measurement standard, and regulators’ intentions to finalize Dodd-Frank rules governing incentive compensation at banks are some of the key issues that compensation and human resources committees of banks will need to consider in the second half of 2019 and beyond.
2018 Pay and Performance Outcomes
2018 was a mixed performance year for the banks in CAP’s study. EPS and net income both grew significantly, due in large part to the reduction in the corporate tax rate under the Tax Cuts and Jobs Act of 2017. Operating income growth was also up in 2018, indicating that strong operating results also played a part in the increases in EPS and net income. At the same time, revenue growth in 2018 was slightly lower than revenue growth during the prior year. TSR declined for the one-year period that ended December 31, 2018, consistent with the overall market. In addition, TSR was lower for the three-year period that ended December 31, 2018, than for the prior three-year period that ended December 31, 2017. The chart below summarizes median performance results for the banks in CAP’s study:
| Metric | Median Percent Change | |
| Year Ended December 31, 2017 | Year Ended December 31, 2018 | |
| EPS | +14.0% | +31.7% |
| Net Income | +15.3% | +25.9% |
| Pre-tax Operating Income | +9.6% | +13.4% |
| Revenue | +7.0% | +5.4% |
| 1-Year TSR | +19.3% | -18.3% |
| 3-Year TSR (Cumulative) | +57.1% | +25.3% |
Source: S&P Capital IQ Financial Database.
In 2018, total direct compensation, including base salary, annual cash bonus, and awarded long-term incentives, among CEOs increased 7.8 percent versus 2017 at median. This is a smaller increase than in 2017 when total direct compensation for CEOs increased 11.1 percent at median. The smaller increase in 2018 is primarily due to changes in annual cash bonuses, which were mixed among this group and resulted in an increase of 1.5 percent at median. This is a shift from the period from the prior year when nearly all banks in CAP’s sample increased CEO bonuses, and the median increase was 16.3 percent. The chart below summarizes median changes in CEO pay for the group:
| Element | Median Percent Change for CEOs | |
| Year Ended December 31, 2017 | Year Ended December 31, 2018 | |
| Base Salary | No Change | No Change |
| Annual Cash Bonus | +16.3% | +1.5% |
| Awarded Long-term Incentive | +7.0% | +6.5% |
| Awarded Total Incentive | +12.7% | +7.8% |
| Total Direct Compensation | +11.1% | +7.8% |
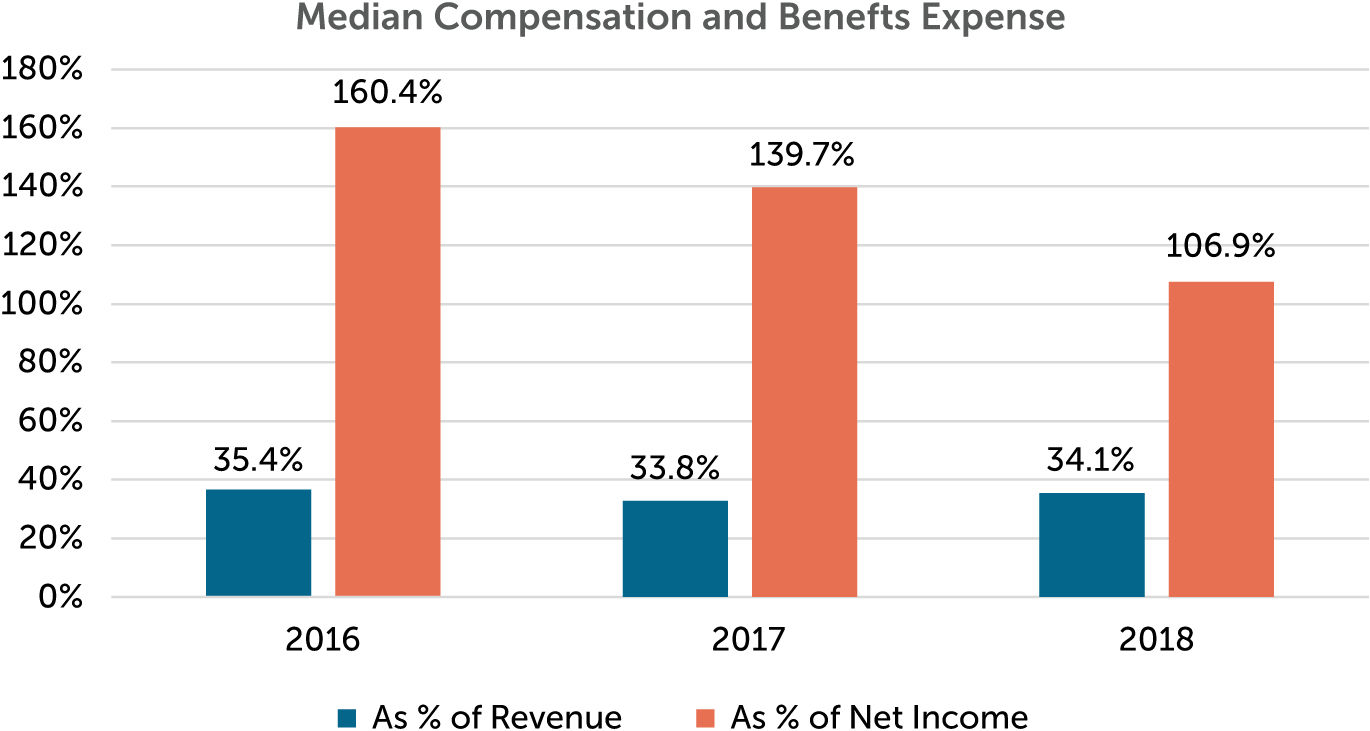
Compensation and benefits expense increased approximately three to four percent at median on an absolute basis in 2017 and 2018 but stayed relatively flat as a percentage of revenue. In addition, compensation and benefits expense declined as a percentage of net income, likely due to tax reform.
Executive Compensation Program Design
Incentive Compensation Model
The banking industry is different from other industries in that some banks determine a total incentive award based on annual performance and then allocate the total incentive between annual cash bonus and long-term incentive awards (e.g., the total incentive award for the year is delivered 40 percent through an annual cash bonus and 60 percent through long-term incentives). One-third of the banks in CAP’s study use this approach. The remaining two-thirds make separate decisions for the annual cash bonus and long-term incentive awards, which is consistent with general industry practices.
Short-term Incentive Plan
Short-term incentive plans in the banking industry tend to be more discretionary than in other industries. Of the companies in CAP’s study, 47 percent have primarily discretionary short-term incentive plans.
The remaining 53 percent of companies maintain more formulaic short-term incentive plans that pay out, at least in part, based on financial results relative to pre-established “threshold”, “target”, and “maximum” goals. These plans most often provide for a payout of 200 percent of target for “maximum” performance or better, though several companies provide maximum opportunities of less than 200 percent of target, and one company provides a maximum opportunity of greater than 200 percent of target.
EPS is the most common financial metric across these short-term plans. Companies also use Efficiency Ratio, return on assets (ROA), and ROTCE, but they are less common in short-term plans. Most companies measure annual performance against absolute performance goals; however, several companies include a relative performance component.
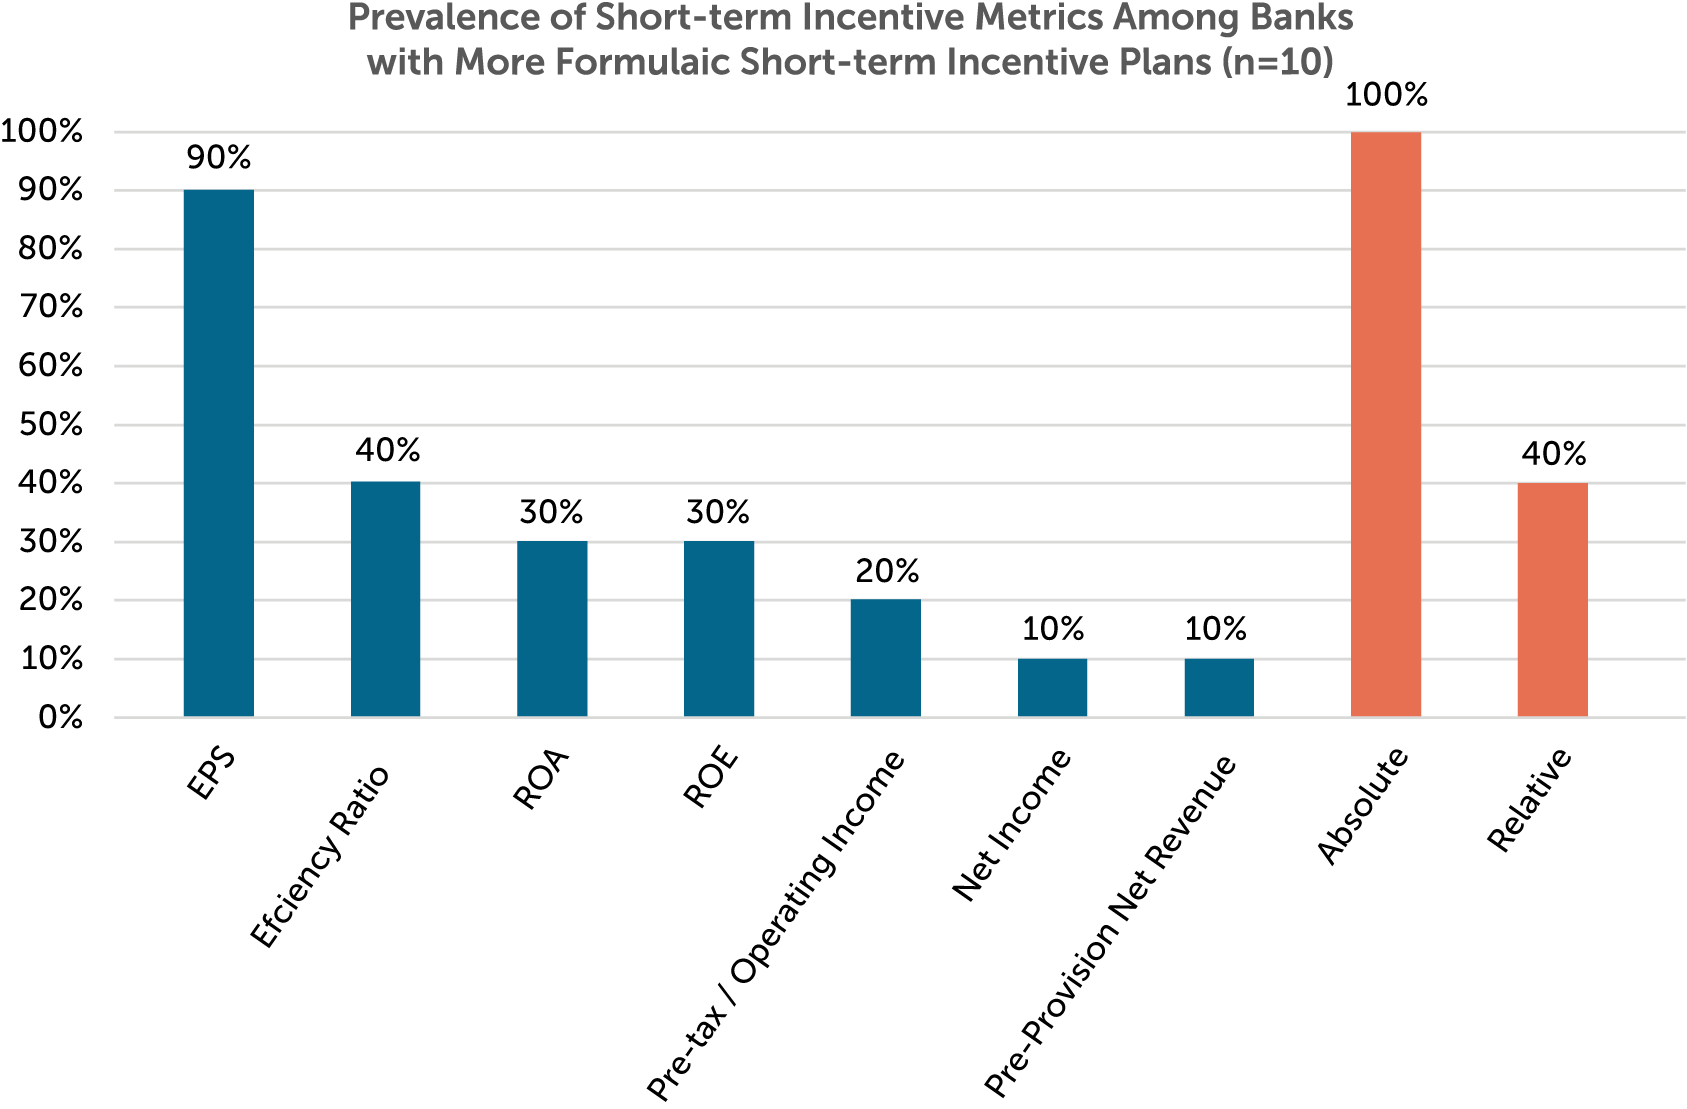
Note: Percentages do not add to 100 percent due to some companies using multiple metrics.
Long-Term Incentive Plan
Long-term incentive programs among companies in CAP’s study are most often composed of time-based restricted stock or units and long-term performance plans (e.g., performance share units). Only 26 percent of banks in the study use stock options, making them less common among this group than in the broader market. Companies tend to weight long-term performance plans as at least 50 percent of the target total long-term incentive award. Of the companies in the study, 11 percent use long-term performance plans as their only long-term incentive vehicle. The chart below outlines the average long-term incentive mix across companies in CAP’s study:
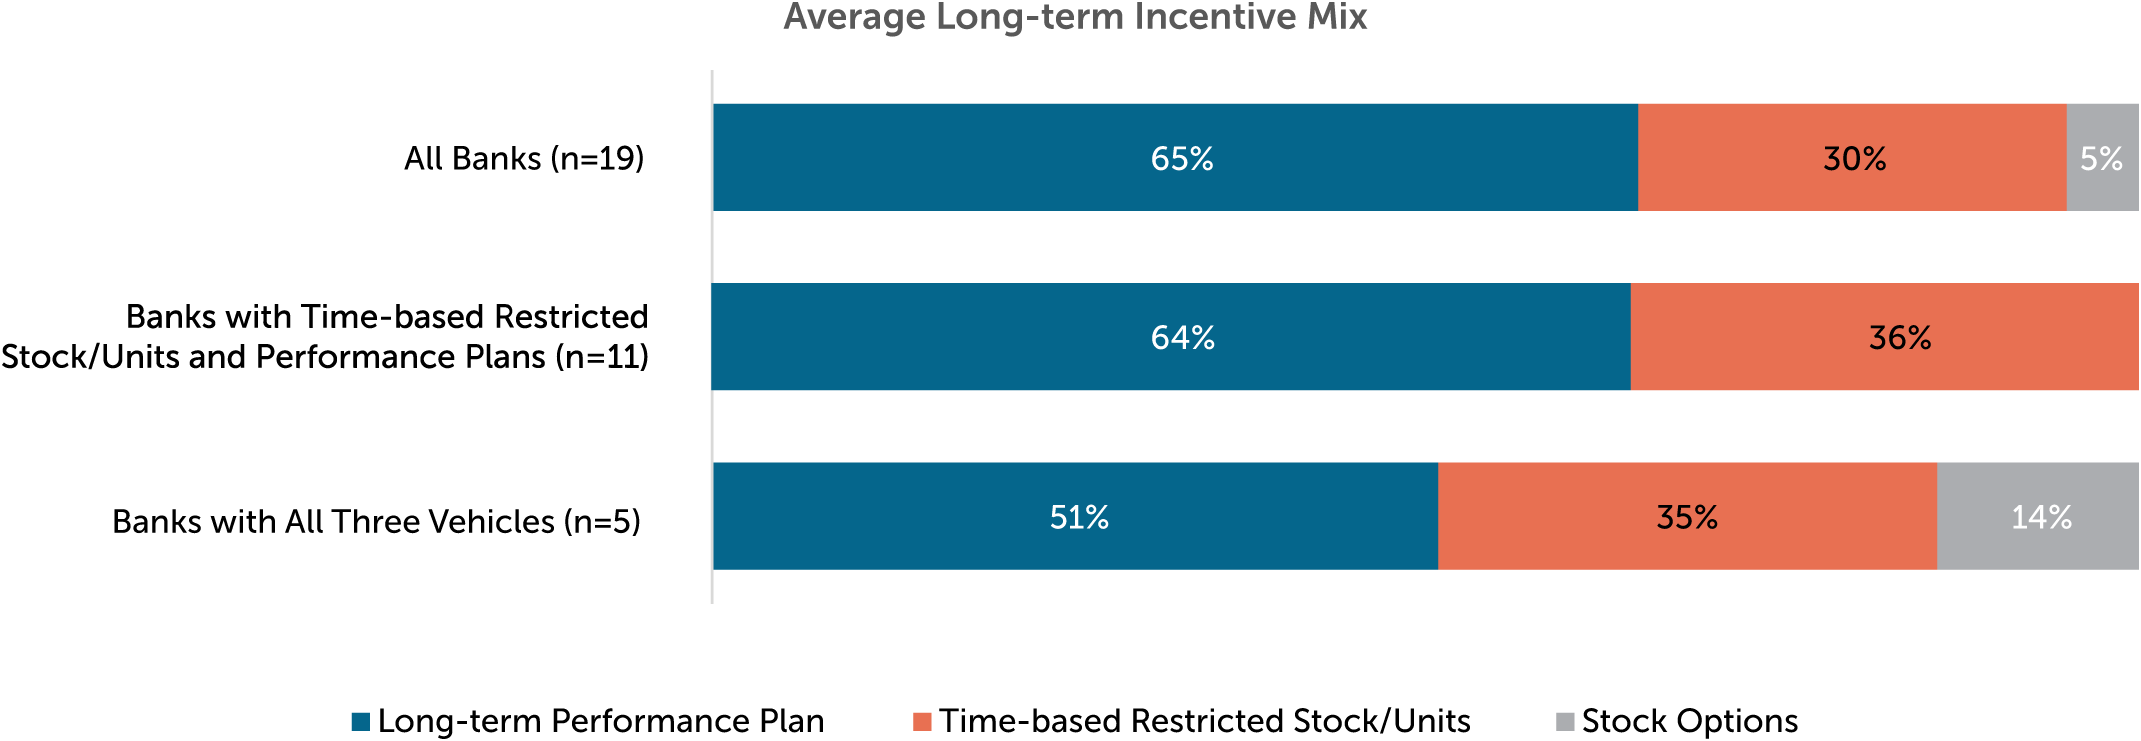
Note: Two companies use long-term performance plans as their only long-term incentive vehicle and one company uses a long-term performance plan and stock options.
84 percent of the banks in CAP’s study use return on equity (ROE) or a variant of that measure as a metric in their long-term performance plans. Variants of ROE include ROTCE and return on common equity (ROCE). ROTCE is the most common of these variants. Relative TSR and EPS are also common long-term performance plan metrics.
68 percent of companies use at least one relative metric in their long-term performance plans. Specifically, nearly all Super Regional banks use relative metrics in their long-term performance plans. In other industries, relative metrics are typically limited to TSR; however, the banks in CAP’s study also use relative financial measures, including relative ROE variants, EPS growth, and ROA. This is likely due to the significant degree of comparability between the Super Regional banks in CAP’s study.
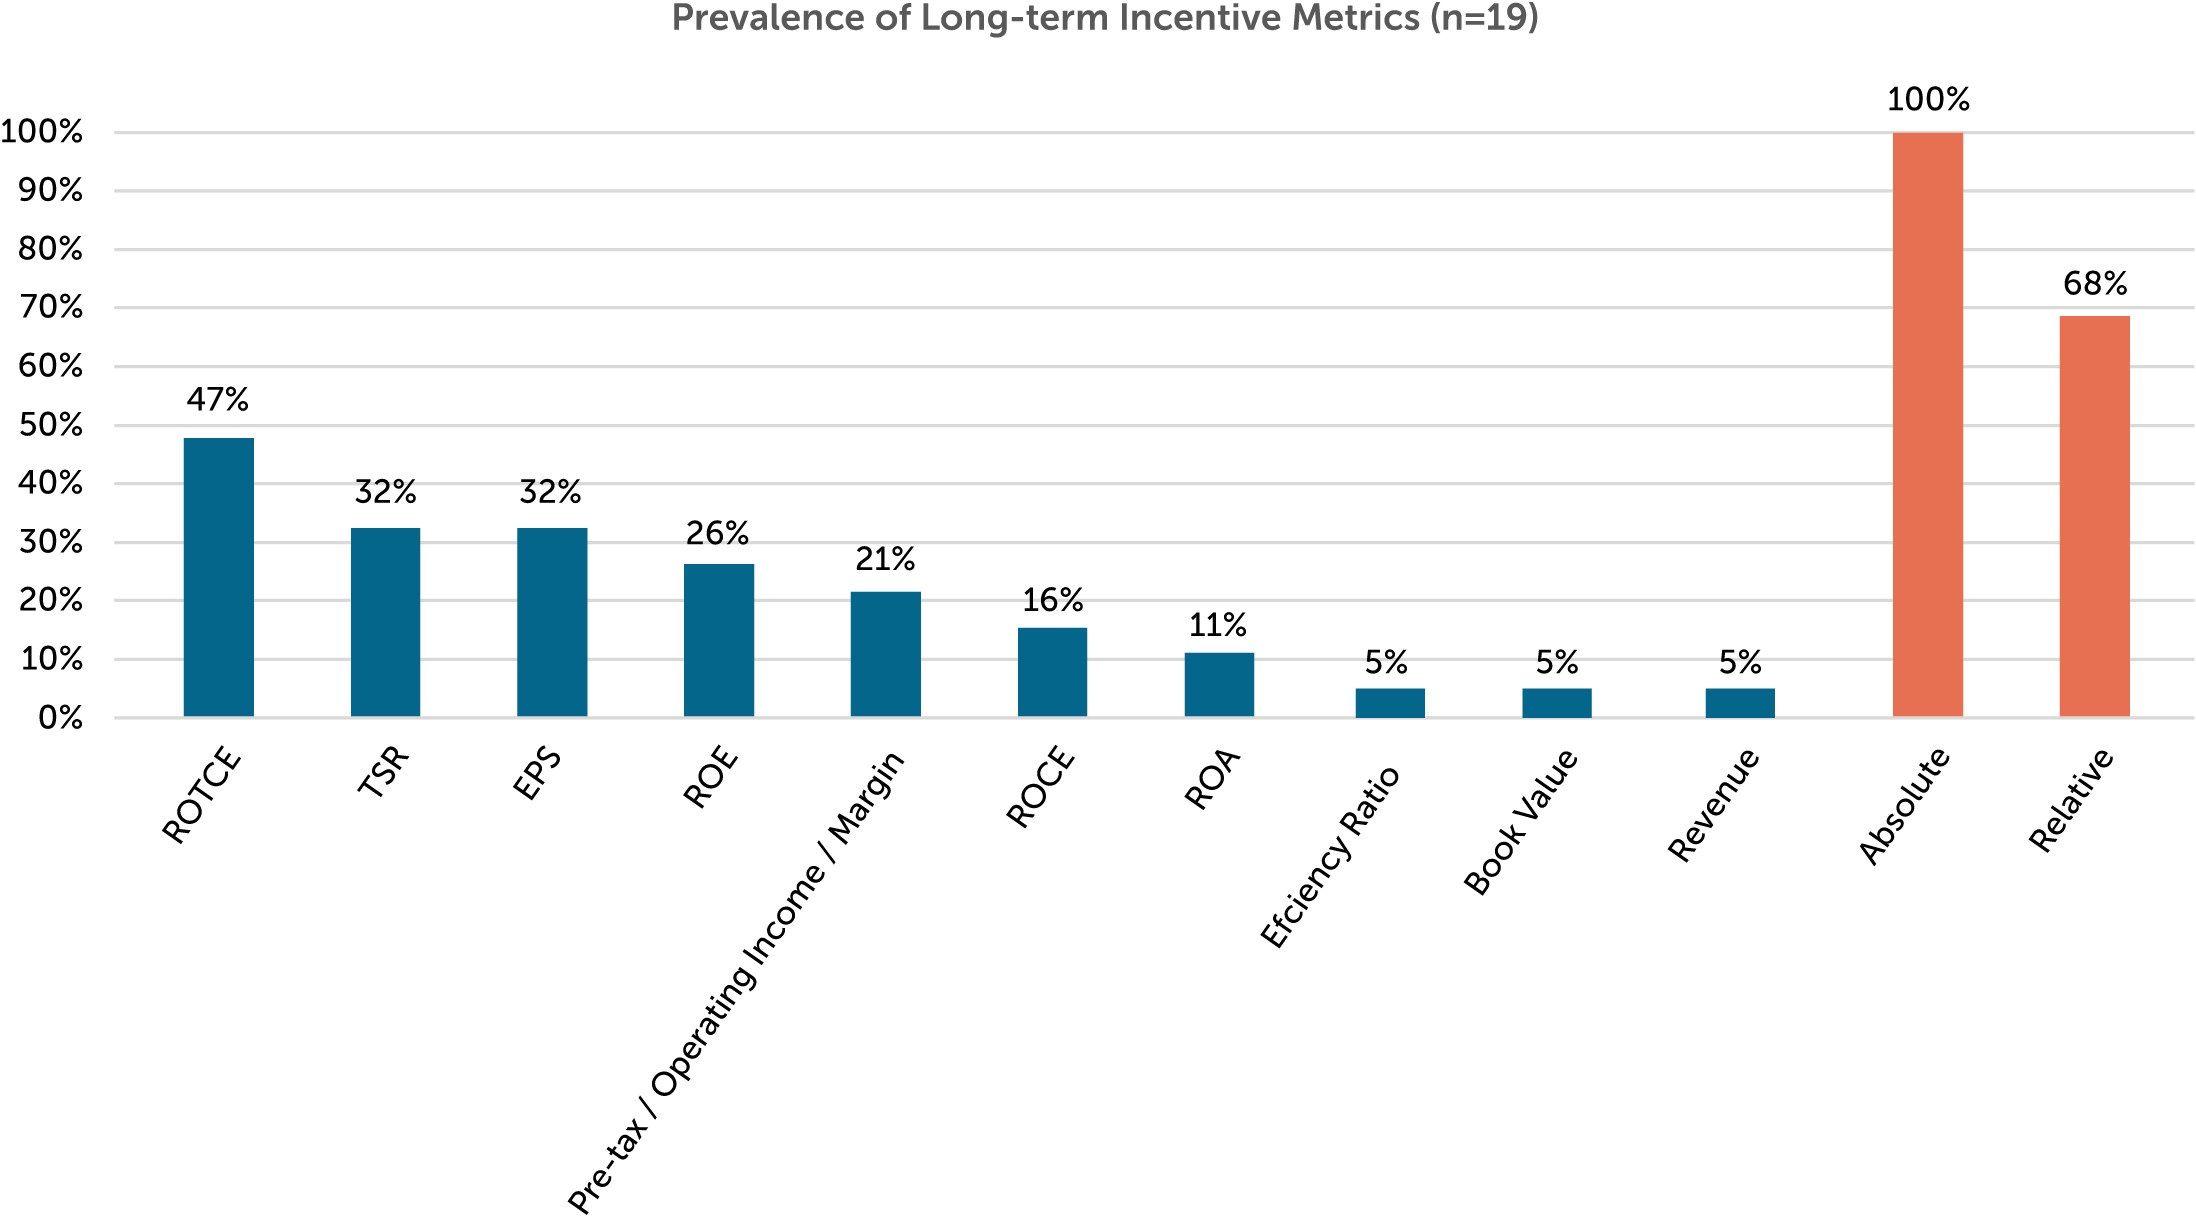
Note: Percentages do not add to 100 percent due to some companies using multiple metrics.
Among banks, long-term performance plans most often have maximum payout opportunities of 150 percent of target. In the broader market, most long-term performance plans have maximum payout opportunities of 200 percent of target. Maximum opportunities tend to be lower at banks due, in part, to regulatory guidance to limit upside leverage in incentive plans to avoid encouraging imprudent risk-taking.
Stock Ownership Guidelines and Holding Requirements
In recent years, practices around stock ownership guidelines and holding requirements have generally been stable. All of the banks in CAP’s study have ownership guidelines and/or holding requirements.
89 percent of companies maintain stock ownership guidelines. Most companies express the guideline as a multiple of salary. The most common guidelines are 6x base salary for CEOs and 3x base salary for other NEOs, though several companies maintain higher guidelines.
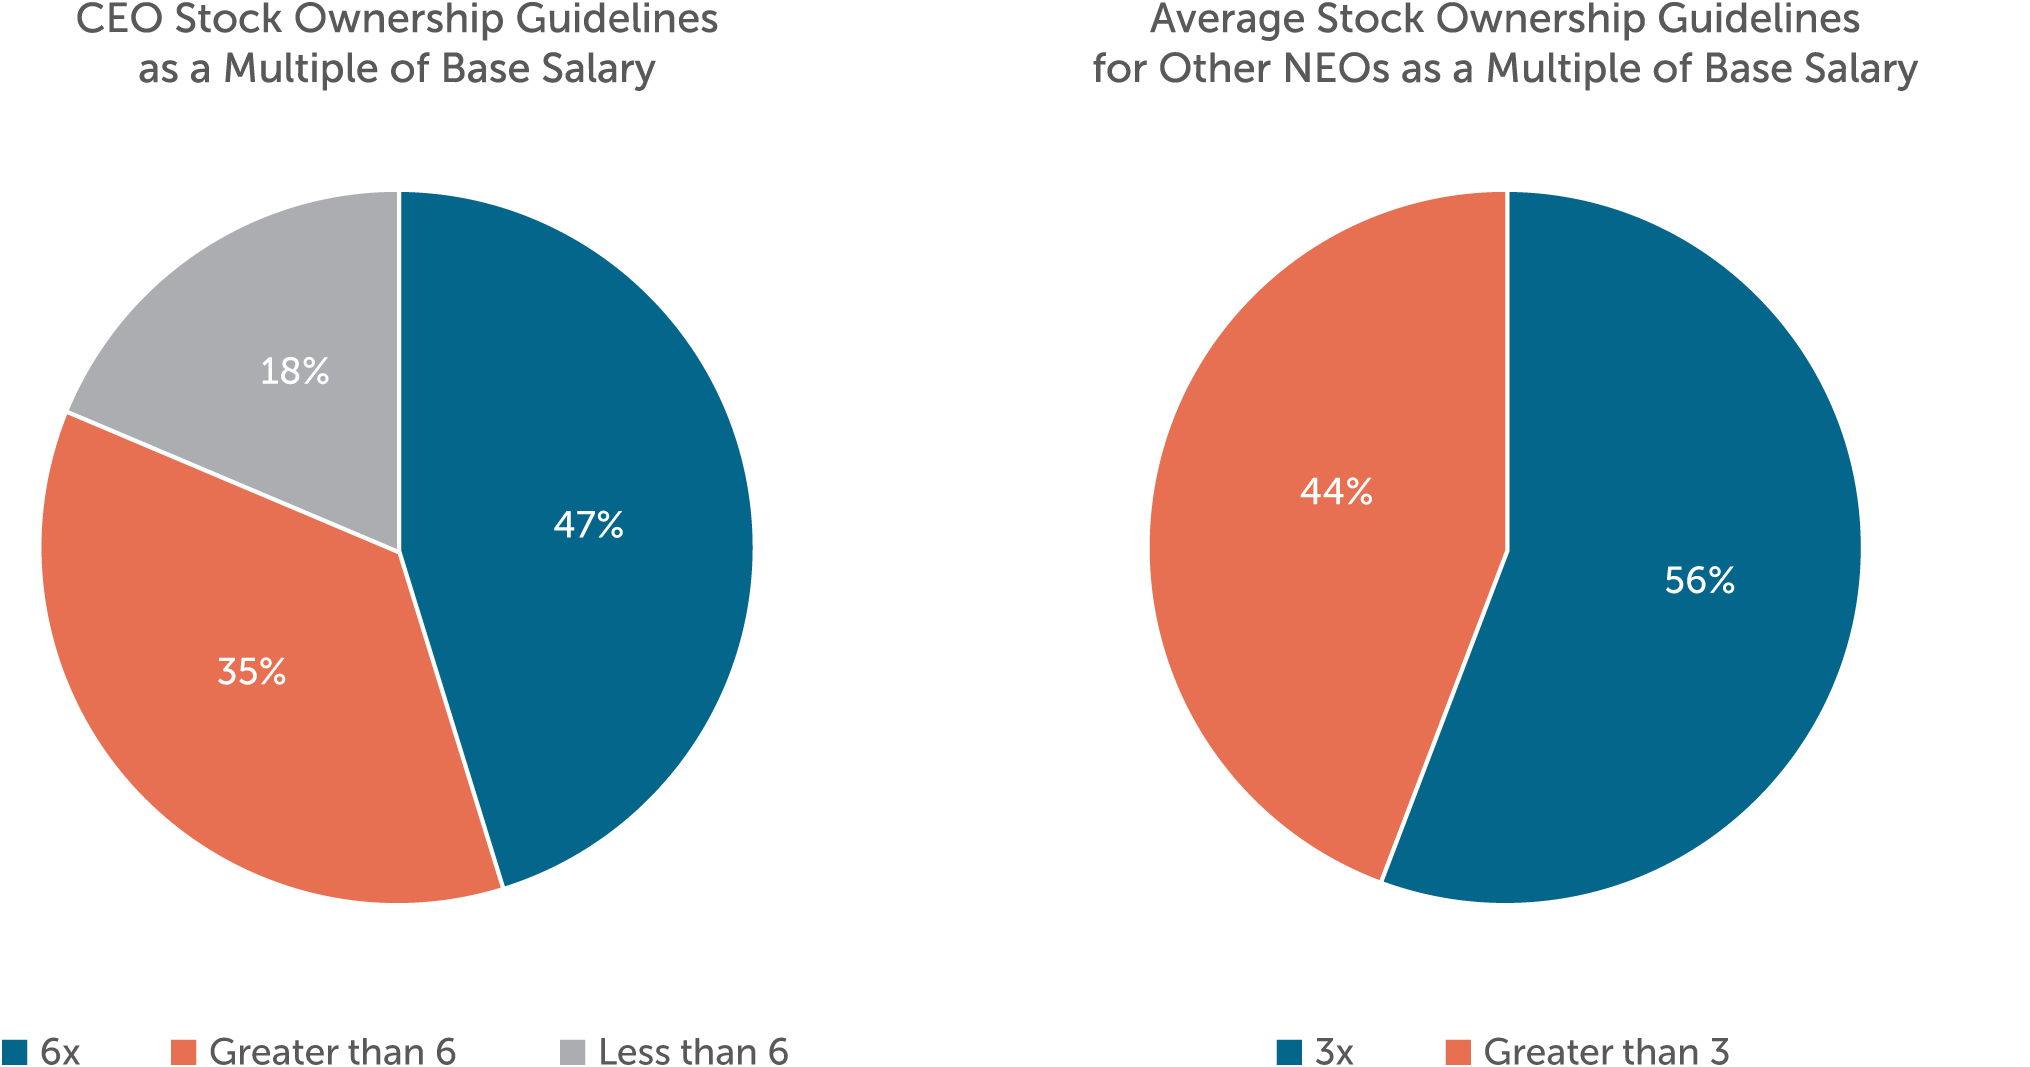
Note: Guidelines that are not a multiple of salary have been converted to an implied multiple of salary in the charts above.
In the years following the 2008 financial crisis, several banks in CAP’s study, including the Money Center banks, adopted policies requiring NEOs to hold a portion of the net after-tax shares received from stock vesting or option exercises (“net shares”) until retirement or termination from the company or later. Many thought this trend would catch on throughout the banking industry; however, most smaller banks never adopted such policies. Of the companies in CAP’s study, 42 percent disclose policies of this kind. These policies typically require NEOs to hold 50 percent of net shares until retirement or one-year post-retirement.
Looking Ahead to the Rest of 2019 and Beyond—Hot Topics in Executive Compensation
Diversity and Inclusion and Gender Pay Equity
In recent years, corporate diversity and inclusion have become a main area of focus culturally and for certain institutional shareholders. As a result, compensation and human resources committees are increasingly focusing on gender pay equity and representation at companies across industries. In particular, the financial services industry faces intense public scrutiny around its diversity and inclusion policies and gender pay equity.
This public pressure has only increased in 2019. Earlier this year, Arjuna Capital, an institutional investor that is notably outspoken on this topic, published a gender pay equity scorecard that included several of the banks in CAP’s study. In June, Congresswomen Maxine Waters and Joyce Beatty sent a letter to bank holding companies with assets of greater than $50 billion, requesting information about each institution’s diversity and inclusion data and policies. In 2019, 21 percent of companies in CAP’s analysis included shareholder proposals in their proxy statements requesting that the banks report the median gender pay gap. Though these proposals failed to receive majority support from shareholders, CAP expects that requests for disclosure around diversity and inclusion policies and gender pay equity will continue both in the banking industry and broader market.
Current Expected Credit Loss (CECL) Standard
One key development for 2020 is the implementation of the Financial Accounting Standards Board’s (FASB’s) new credit loss measurement approach, the current expected credit loss (CECL) model, which will impact loan loss reserves. An early announcement from JPMorgan Chase indicates that it expects the change to increase reserves by 35 percent; however, the impact on reserves will vary from bank to bank based, in part, on the makeup of the loan portfolio. The move to the new reporting standard will impact results for profit and return measures and may have an impact on incentive plan goals that were previously set for outstanding long-term performance plan cycles.
Dodd-Frank Rules on Incentive Compensation at Banks
Recently, news outlets have been reporting that regulators plan to finalize the Dodd-Frank rules governing incentive compensation at banks ahead of the 2020 presidential election. While this may seem counterintuitive to the current climate of deregulation, many believe that the current administration aims to finalize the rules to prevent the adoption of more onerous rules under a Democratic administration. If regulators move forward with this agenda item, banks will need to review their current incentive plans and, as necessary, consider adjusting them to comply with the final rules.
Mergers and Acquisitions (M&A) Activity
Early in 2019, BB&T Corporation and SunTrust Banks, Inc. announced that they will merge to create the eighth largest U.S. bank by assets. The combined bank will be called Truist Financial. The industry has not seen a merger of this magnitude since the 2008 financial crisis. The success of this combination could indicate a shift in attitudes around M&A activity between major financial institutions. However, given the regulatory uncertainty heading into the 2020 election, it remains to be seen if this merger will be the first in a series or a one-time event.
Conclusion
Compensation programs among the banks in CAP’s study continue to effectively tie pay outcomes to performance. In recent years, incentive plan designs among these banks have generally been stable.
However, the impending change in regulatory guidance following adoption of final Dodd-Frank rules may cause banks to begin to adjust incentive plan designs, though will likely not result in major changes. Other areas of uncertainty, including the impact of the implementation of the CECL standard, potential for a credit cycle or economic downturn, and uncertainty around the 2020 election, may affect incentive plan goal-setting processes or cause banks to make additional adjustments to executive compensation programs in 2020 and 2021.
For questions or more information, please contact:
Eric Hosken Partner [email protected] 212-921-9363
Michael Bonner Senior Associate [email protected] 646-486-9744
Diane Lee and Joshua Hovden provided research assistance for this report.
Banks in CAP’s Study (n=19)
Money Center Banks
- Bank of America Corporation Citigroup, Inc.
- JPMorgan Chase & Co.
- Wells Fargo & Company
Custody Banks
- The Bank of New York Mellon Corporation Northern Trust Corporation
- State Street Corporation
Super Regional Banks
- BB&T Corporation
- Citizens Financial Group, Inc. Comerica, Inc.
- Fifth Third Bancorp
- Huntington Bancshares, Inc.
- KeyCorp
- M&T Bank Corporation
- The PNC Financial Services Group, Inc. Regions Financial Corporation SunTrust Banks, Inc.
- U.S. Bancorp
- Zions Bancorporation


