

The 2010 Dodd-Frank Wall Street Reform and Consumer Protection Act (“Dodd-Frank”) directed the SEC to enact rules that require disclosure in the annual proxy statement of the ratio of CEO compensation to that of the median employee, including the absolute value for each input that goes into the ratio calculation. More than four years later, final pay ratio rules are yet to be released by the SEC (proposed rules were released in September 2013). In fact, the SEC recently pushed back its deadline to adopt final pay ratio rules from October 2014 to October 2015. According to some stakeholders, this is actually a good thing.
- The Center on Executive Compensation has stated that: “The Commission’s Proposed Rule will impose significant and wholly unnecessary costs on U.S.-listed companies and U.S. investors. The pay ratio requirement itself is mistaken: it will provide no useful information to investors and to the extent the information is used by investors at all, it is likely to be misleading and thus will be harmful to them.”
- The House Financial Services Chairman submitted a letter to SEC Chair Mary Jo White arguing that adopting the proposed pay ratio rule would be unduly costly and detract from more important SEC priorities
Separate from Dodd-Frank requirements, are there other pay ratios that Compensation Committees should track and discuss? Yes.
This CAPflash focuses on two such pay ratio calculations: CEO versus second highest paid Named Executive Officer (“NEO”) and CEO versus average of Other NEOs (i.e., CFO and next 3 highest paid executive officers). Below we provide and discuss market practice among S&P 500 companies, as well as relevant proxy advisor policies. Why do these two ratios matter? If these ratios get too high, they may indicate either potential succession planning issues or excessive CEO compensation.
What does our research show?
To evaluate market norms, Compensation Advisory Partners (“CAP”) conducted an analysis of senior executive pay ratios among S&P 500 companies during the most recent three fiscal years (as of February 28, 2015).1
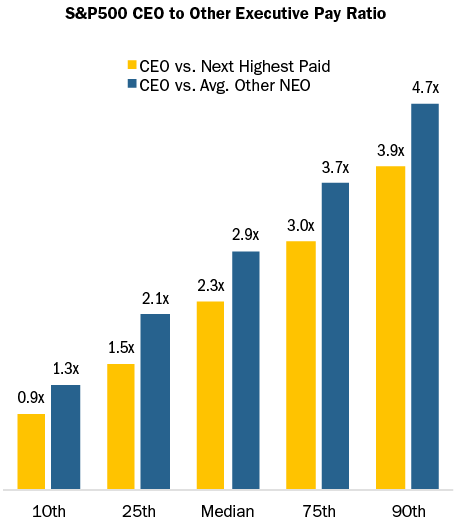
- At median, CEO pay was 2.3x the second highest paid NEO; i.e., for every $1.00 paid to the second highest paid NEO, the CEO was paid approximately $2.30
- At median, CEO pay was 2.9x average Other NEO pay; i.e., for every $1.00 paid to an average NEO, the CEO was paid approximately $2.90
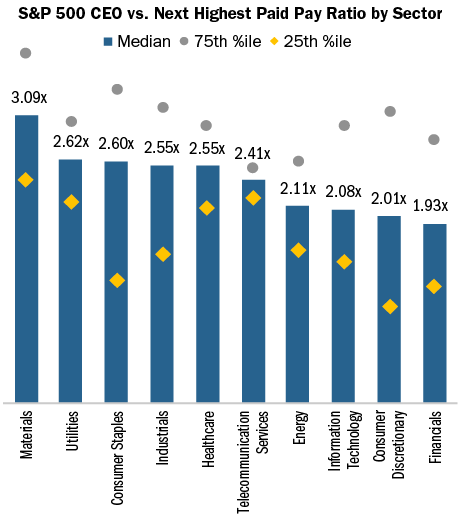
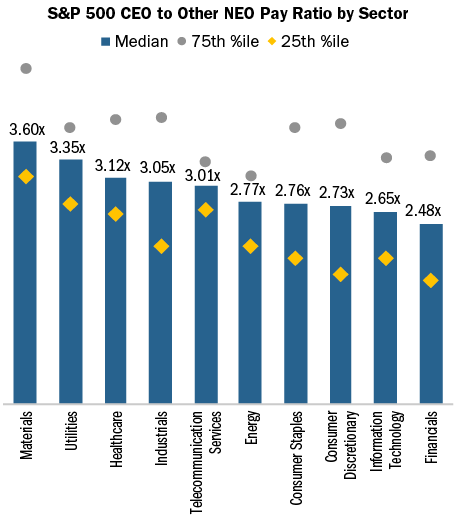
CAP also analyzed the S&P 500 senior executive pay ratios by industry.
- For the CEO vs. second highest paid NEO ratio, the materials sector had the highest ratio of 3.09x at median, while financials had the lowest ratio of 1.93x at median
- For the CEO vs. average Other NEO ratio, the Materials sector had the highest ratio of 3.60x at median, while financials had the lowest ratio of 2.48x at median
How do ISS and Glass Lewis use pay ratios?
Both proxy advisory firms include senior executive pay ratios in their annual proxy reports.
- ISS includes the ratio of CEO pay versus the second highest paid active NEO, as well as the ratio of CEO pay versus the average of the other active NEOs. “Pay” includes all elements from the Summary Compensation Table; however, the grant-date value of stock options is updated to reflect ISS’ methodology which differs from accounting rules
- Glass Lewis includes the ratio of CEO pay versus the average of other NEOs during each of the past three years. “Pay” includes select elements from the Summary Compensation Table: Salary, Bonus, Non-Equity Incentive Plan, Stock Awards, and Option Awards
ISS also uses pay ratio as one of the inputs to the Compensation score it assigns companies in its QuickScore 3.0 tool, which is meant to influence investment decisions through an assessment of governance risk factors. The ratio of CEO pay versus the second highest paid active NEO is included in QuickScore 3.0.
When do proxy advisors perceive there to be a possible issue?
To our knowledge, these ratios have not been used by ISS or Glass Lewis to justify an Against Say on Pay vote recommendation. However, large pay discrepancies can reinforce other negative factors. In general, comments from ISS and Glass Lewis are likely when the ratio exceeds 4x. Ratios exceed 4x at 5-10% of S&P companies, depending on which ratio is used (see ISS and Glass Lewis definitions above). Ratios rising to 5-6x, or greater, will receive more strongly worded commentary.
Conclusion
We believe that there is limited utility in the pay ratio disclosure that will be required by the SEC under Dodd-Frank. In contrast, it is a worthwhile exercise to track and discuss these senior executive pay ratios with the Compensation Committee. The ratio(s) can be discussed as part of succession planning and best-in-class talent management. The ratio(s) can also be another input in the executive officer benchmarking process; i.e., when setting or adjusting target pay levels.
1 Total compensation as disclosed in the Summary Compensation Table was used for this analysis.