


DOWNLOAD A PDF OF THIS REPORT pdf(0.2MB)
Contact
Daniel LaddinFounding Partner [email protected] 212-921-9359 Matthew Vnuk
Partner [email protected] 212-921-9364
CAP analyzed director compensation programs among Fortune 100 companies. These firms are generally considered trend-setting organizations. This CAPflash reflects key findings from the analysis.
Notable Findings
Total Board Compensation
At median, non-employee director compensation increased three percent in 2012, to $257K, after a six percent increase in 2011 and a flat period in 2010. Year-over-year, median Total Board Compensation increased from $250,000 to $257,0003.
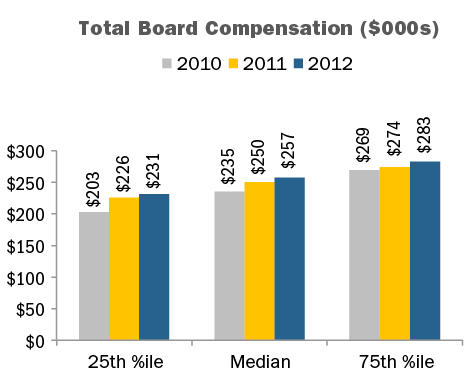
In line with emerging practices, large companies are relying on annual retainers to compensate outside directors. Use of Board meeting fees remained a minority practice in 2012, with only 18 percent of companies paying board meeting fees. This is similar to 2011 and 2010, where 19 percent and 23 percent of companies provided meeting fees, respectively.
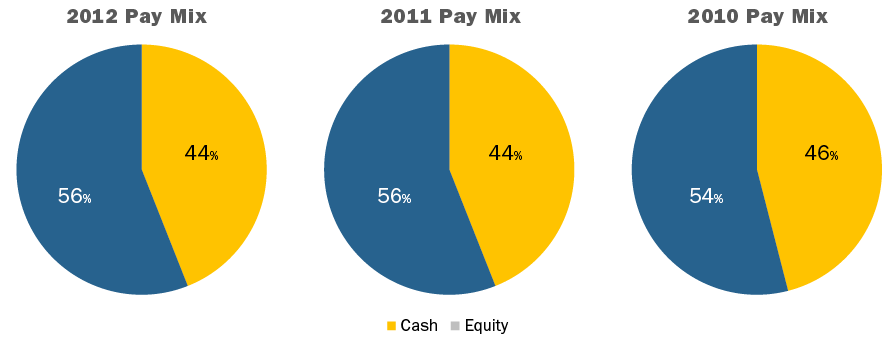
Pay Mix
The mix of cash and equity paid to outside directors was generally consistent between 2010 and 2012. On average, the majority of compensation delivered to directors continues to be in the form of equity.
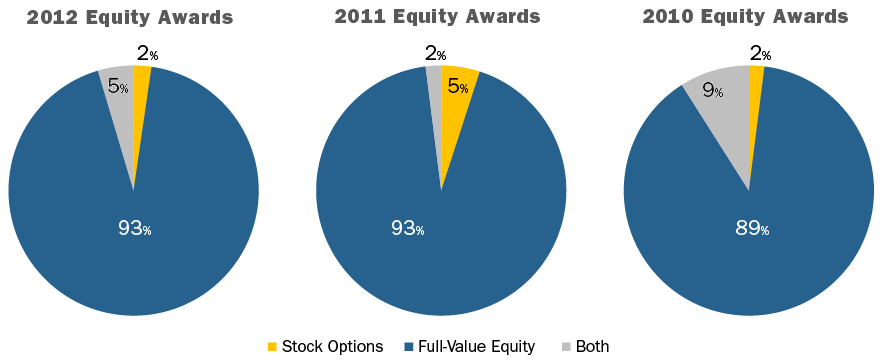
Equity Compensation
Full-value share equity, including restricted stock units, restricted stock, deferred stock units and outright awards of common stock, continues to be by far the most common form of equity delivered to non-employee directors, with only seven percent of companies using stock options as part of the director compensation package.
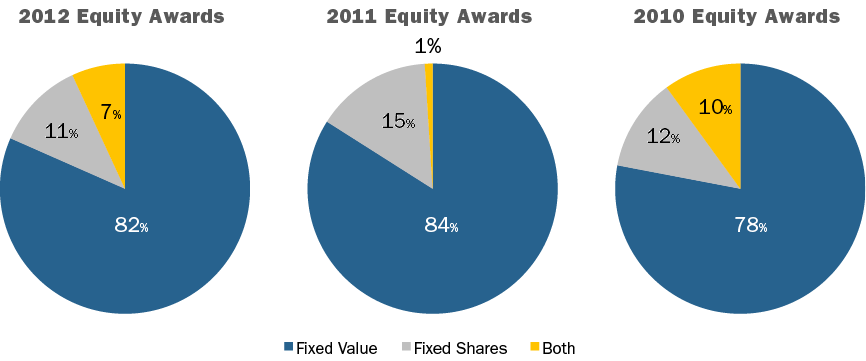
In the recent years, equity awards denominated as a fixed value increased in prevalence, as opposed to awards based on a fixed number of shares.
CAP Perspective: Over the next few years, we expect the following changes in director compensation to take place: 1) low-to-mid single-digit annual increases in Total Board Compensation; 2) more companies moving to fixed retainer pay structures with a component in cash and a component in equity as opposed to paying meeting fees; and 3) a continued emphasis on full-value equity awards. Delivering a majority of compensation in the form of equity coupled with stock ownership / retention requirements creates strong alignment with long-term shareholders and is considered a best practice.
Committee Compensation
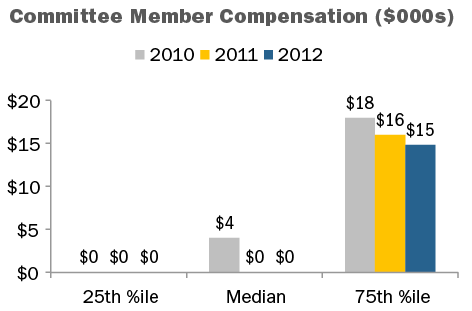
Companies have de-emphasized committee member compensation, instead focusing on overall Board compensation. Our research found that just over 50 percent of companies pay no committee-specific fees to members of any of the three major committees4, similar to 2011 and up from just over one-third in 2010. Since a slight majority of companies do not pay separate fees for committee service, at median committee member compensation is now $05. Among companies that do pay separate fees for committee service, median committee member compensation is $16K.
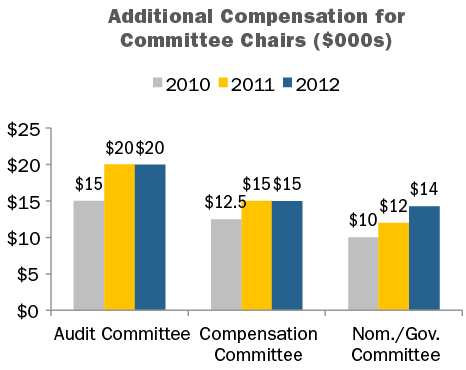
From 2011 to 2012, median additional compensation for committee Chairs remained flat for the Audit and Compensation committees, and increased +17 percent for the Nominating / Governance Committee. Relatively flat year-over-year changes may be associated with a better understanding of the time requirement of the leadership role versus that of a committee member.
CAP Perspective: We expect the trend away from committee member fees to continue, at a slow-to-moderate pace, with the value being rolled into Board cash or equity retainers.
Serving as a committee Chair is generally viewed as a Board leadership role, with additional time requirements, responsibilities, and reputational risk; as a result, additional compensation is often provided for the role.
Near-term, we expect a differential to continue between the additional compensation paid to the Chair of the three major board committees.
Lead/Presiding Directors and Non-Executive Chairmen of the Board
During 2012, the prevalence of providing additional compensation for Lead/Presiding Directors and non-Executive Board Chairs increased to nearly 80 percent, up from approximately 70 percent in 2011 and 65 percent in 2010. In terms of additional compensation for the role, median pay was unchanged at $25,000 in from 2010 to 2012 for Lead/Presiding Directors, and increased slightly for non-Executive Chairs.
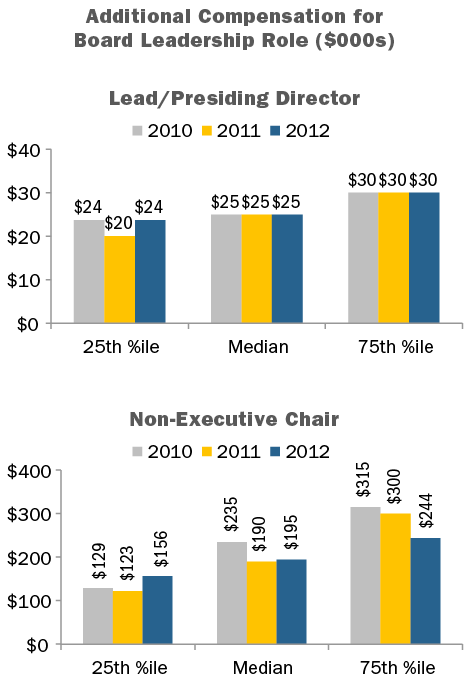
CAP Perspective: While not all non-executive Board leaders receive additional pay for the role, prevalence of additional compensation for these roles is expected to continue to increase over time. The differential in pay between Lead/Presiding directors and non-Executive Chairs is in line with the typical responsibilities of each position.
Conclusion
With the increased scrutiny Boards are under and the time commitment required, in the last five years we have seen a relatively significant increase in non-employee director compensation, though at this point we have hit more of a “steady state” and expect more modest pay level changes going forward. In terms of practices, pay programs have continued a trend towards simplification, as director compensation has become viewed more as an “advisory fee” than an “attendance fee.”
It continues to be important to comprehensively evaluate director pay programs on a regular basis or risk falling behind the curve in terms of desired market positioning and best in class program design. When programs are evaluated, the process and practices listed below should be considered.
|
Best in Class Director Compensation PROCESS |
|
|
Best in Class Director Compensation PRACTICES |
|
1 Analysis includes public Fortune 100 companies (excludes privately held companies).
2 Research assistance for this report was provided by Alex Stahl, Kevin Scott, Armando Rivera and Ryan Colucci.
3 Total Board Compensation reflects all cash and equity compensation for Board and committee service, excluding compensation for additional leadership roles such as committee Chairman, Lead/Presiding director, or non-executive Chairman of the Board.
4 Audit, Compensation and Nominating / Governance committees.
5 Reflects all compensation for committee member service (excludes additional fees for leadership roles), across all Board committees.


