


DOWNLOAD A PDF OF THIS REPORT pdf(0.1MB)
Contact
Shaun BismanPartner [email protected] 212-921-9365 Daniel Laddin
Founding Partner [email protected] 212-921-9359
Compensation Advisory Partners (CAP) examined 2017 pay levels and financial performance across forty-two companies in the utility industry with median revenue of approximately $6.6B1. CAP analyzed all companies in the Philadelphia Utility Index and the Edison Electric Institute. The study focused on performance trends and external market factors affecting pay practices within the industry.
Key Takeaways
- Adjusted earnings (non-GAAP) were up +6% year-over-year
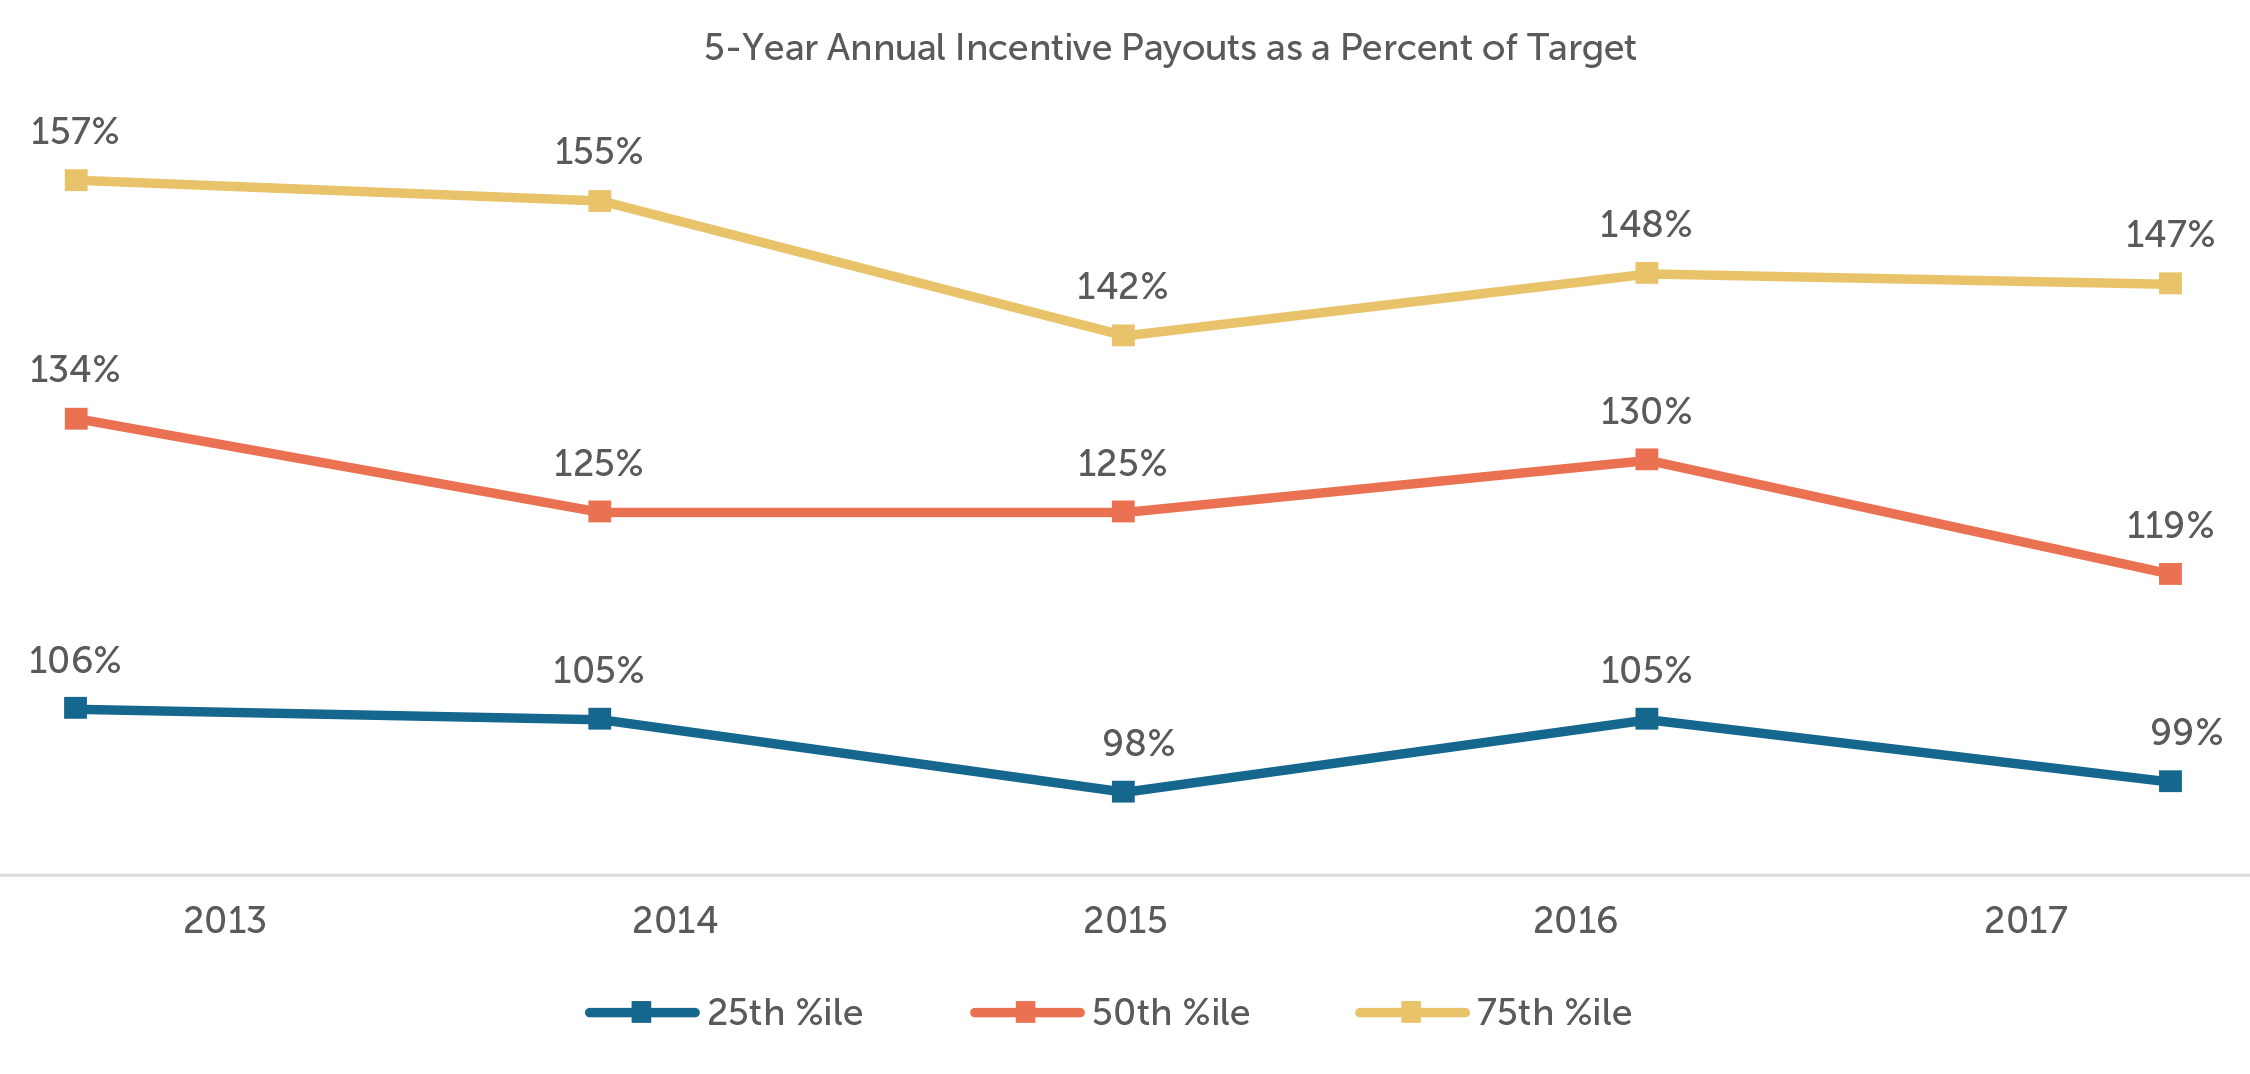
- Median annual incentive payout was above target in both 2016 (130%) and 2017 (119%) reflecting consistently strong performance
- 80% of companies adjusted annual incentive payouts for the Tax Cuts and Jobs Act (“Tax Reform”)
- Adjusted (non-GAAP) earnings measures continue to be prevalent metrics in both the short- and long-term incentive plans
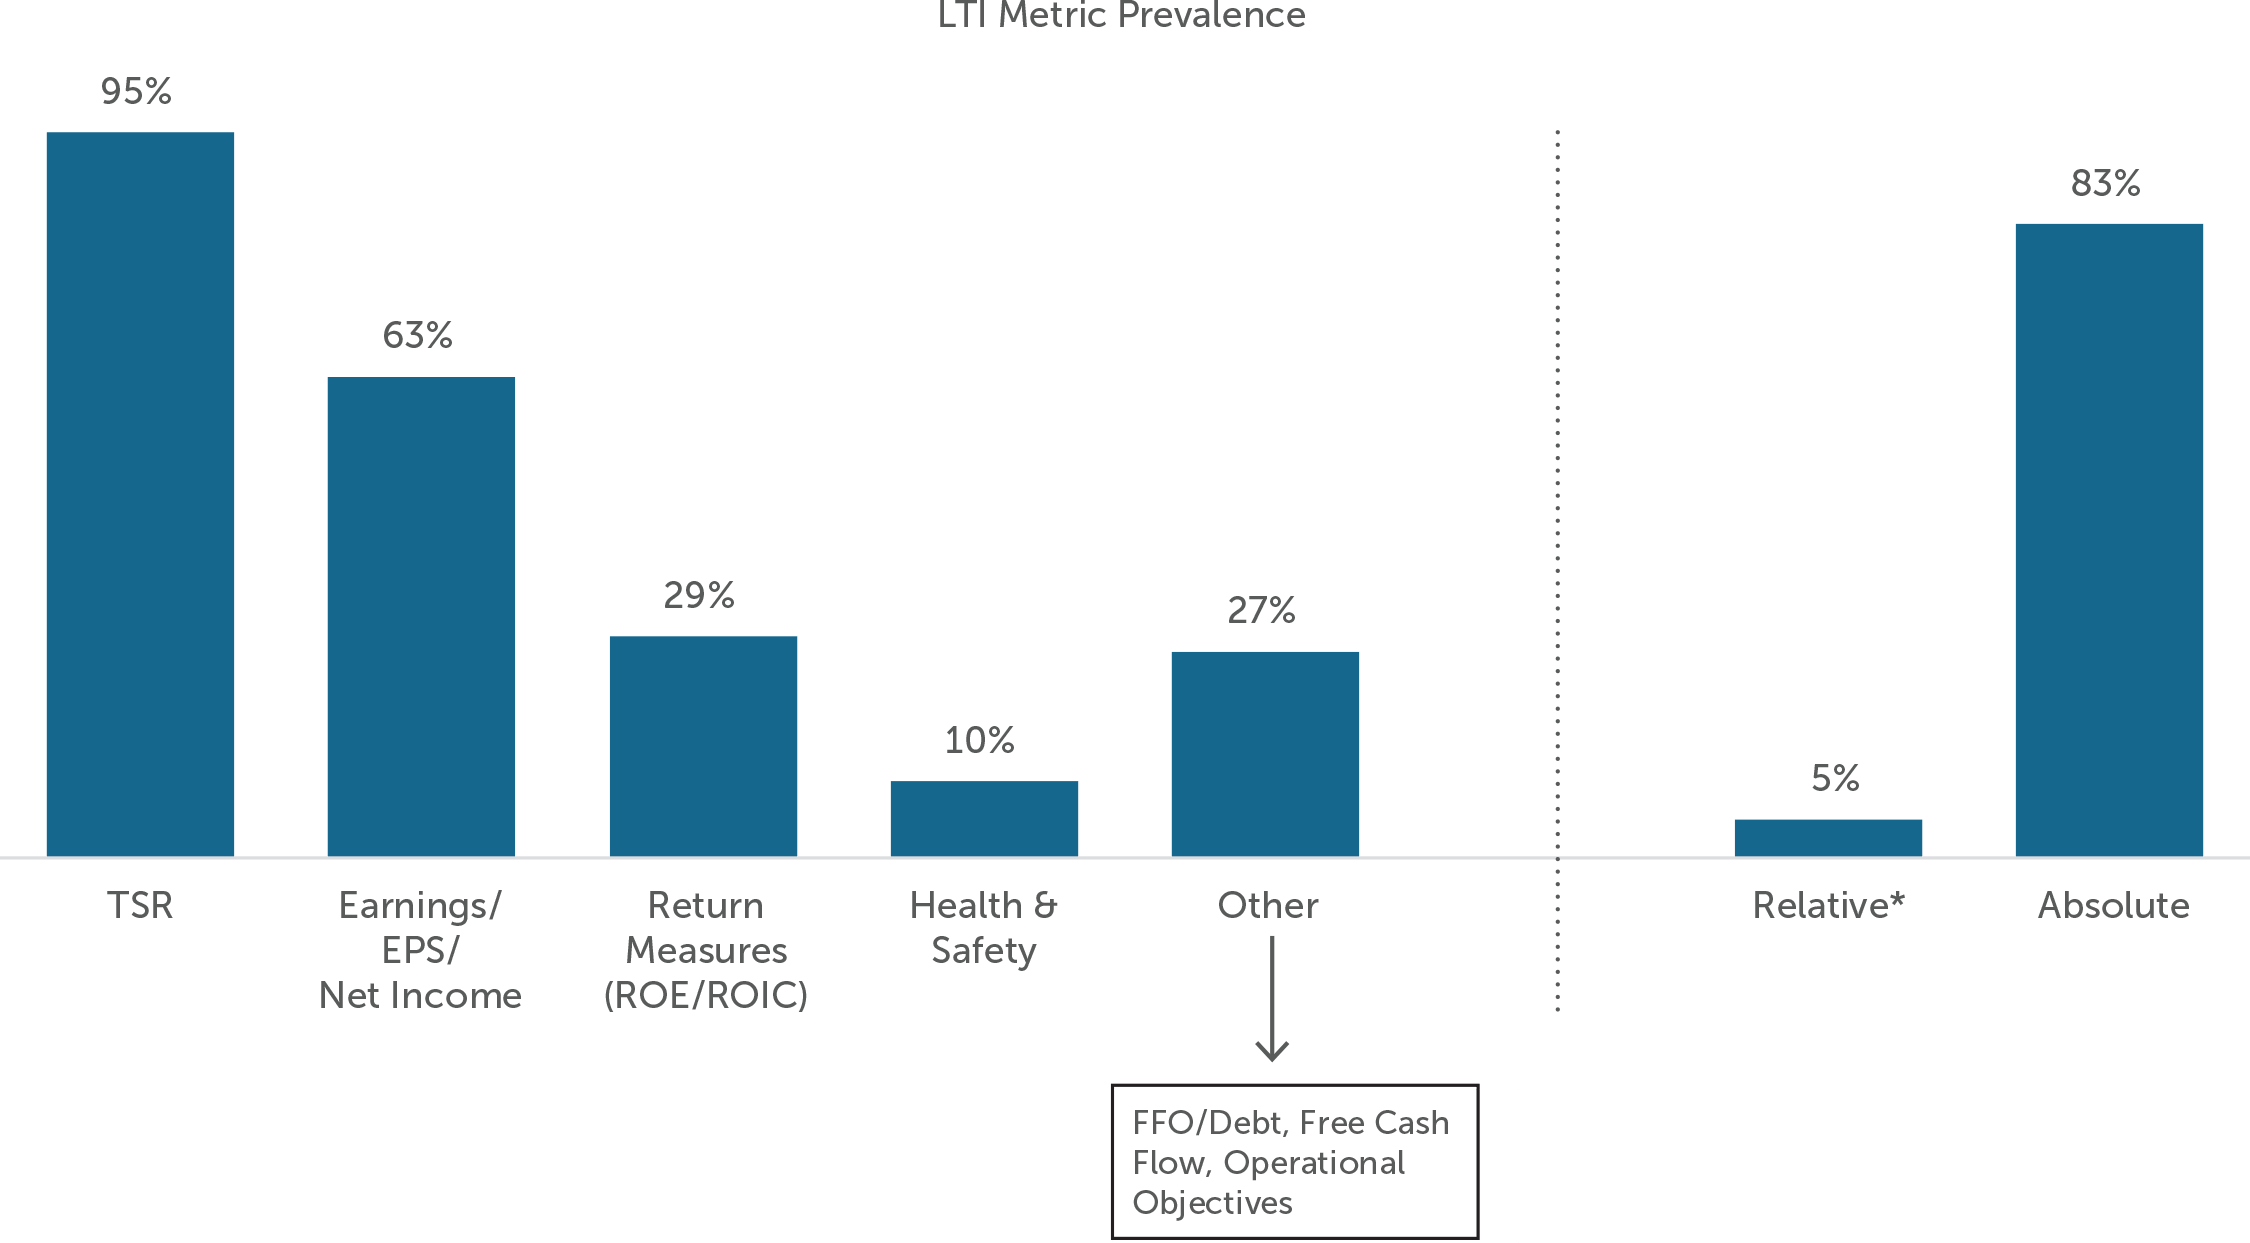
- 95% of companies use total shareholder return (TSR) to measure long-term performance
2017 Financial Performance
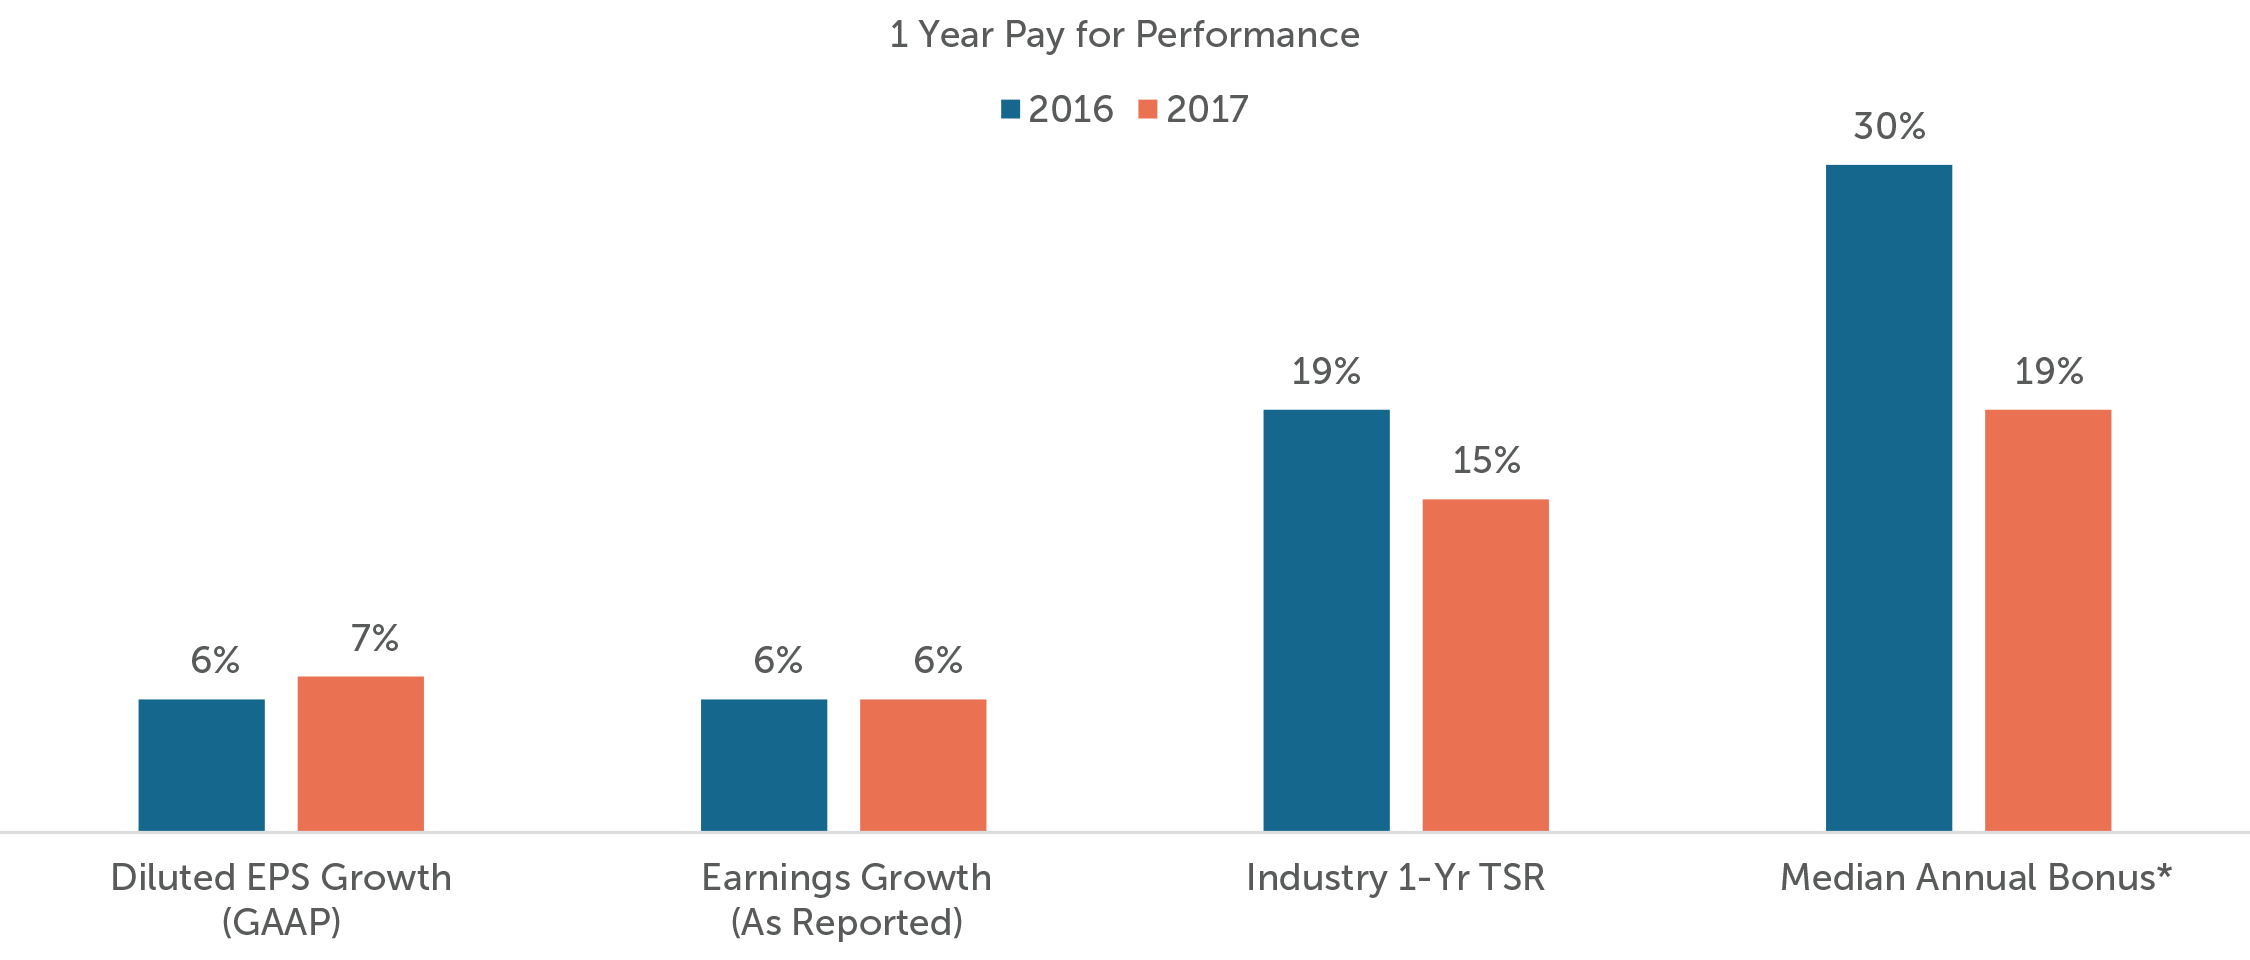
Overall, the utility sector experienced revenue and earnings growth in 2017. Unlike the broader market, utilities are regulated at both the federal and state levels; as regulatory agencies oversee pricing, reliability, and safety. With the rising regulation comes more limited opportunities for revenue growth. Further, given the non-cyclical nature of the utility industry, utilities generally under-perform bull markets and over-perform bear markets. Utilities saw strong TSR of +15% for the year, compared to +20% for the S&P 500; however, year-to-date TSR (as of August 31, 2018) has slowed, with a median return of +4% for the utility industry and +6% for the S&P 500. Revenue and diluted EPS growth for utilities were also up year-over-year, at +4% and +7%, respectively.
Companies saw their financial results impacted by the Tax Reform signed by President Trump in December 2017. Reported (adjusted) non-GAAP earnings for the companies in our sample reflect modest growth (+6%). This slight difference compared to GAAP earnings is partially due to Tax Reform. Many companies experienced a positive impact on their financials, reflected in GAAP numbers, but adjusted numbers would likely eliminate this boost as it was an unknown when budgets were set at the beginning of the year. Return on average capital was also up in 2017 (+3%) compared to +2% in 2016. Overall, despite weaker performance as compared to the S&P 500 index, the utilities industry had a positive year, as evidenced by above-target annual incentive payouts.
| Industry Group | 2017 Median Company Performance | ||
| Revenue Growth | Diluted EPS Growth | TSR | |
| Utilities Cos. (n=42) | + 3.6% | + 7.2% | + 15.1% |
| S&P 500 | + 6.7% | + 9.5% | + 19.8% |
Source: S&P’s Capital IQ
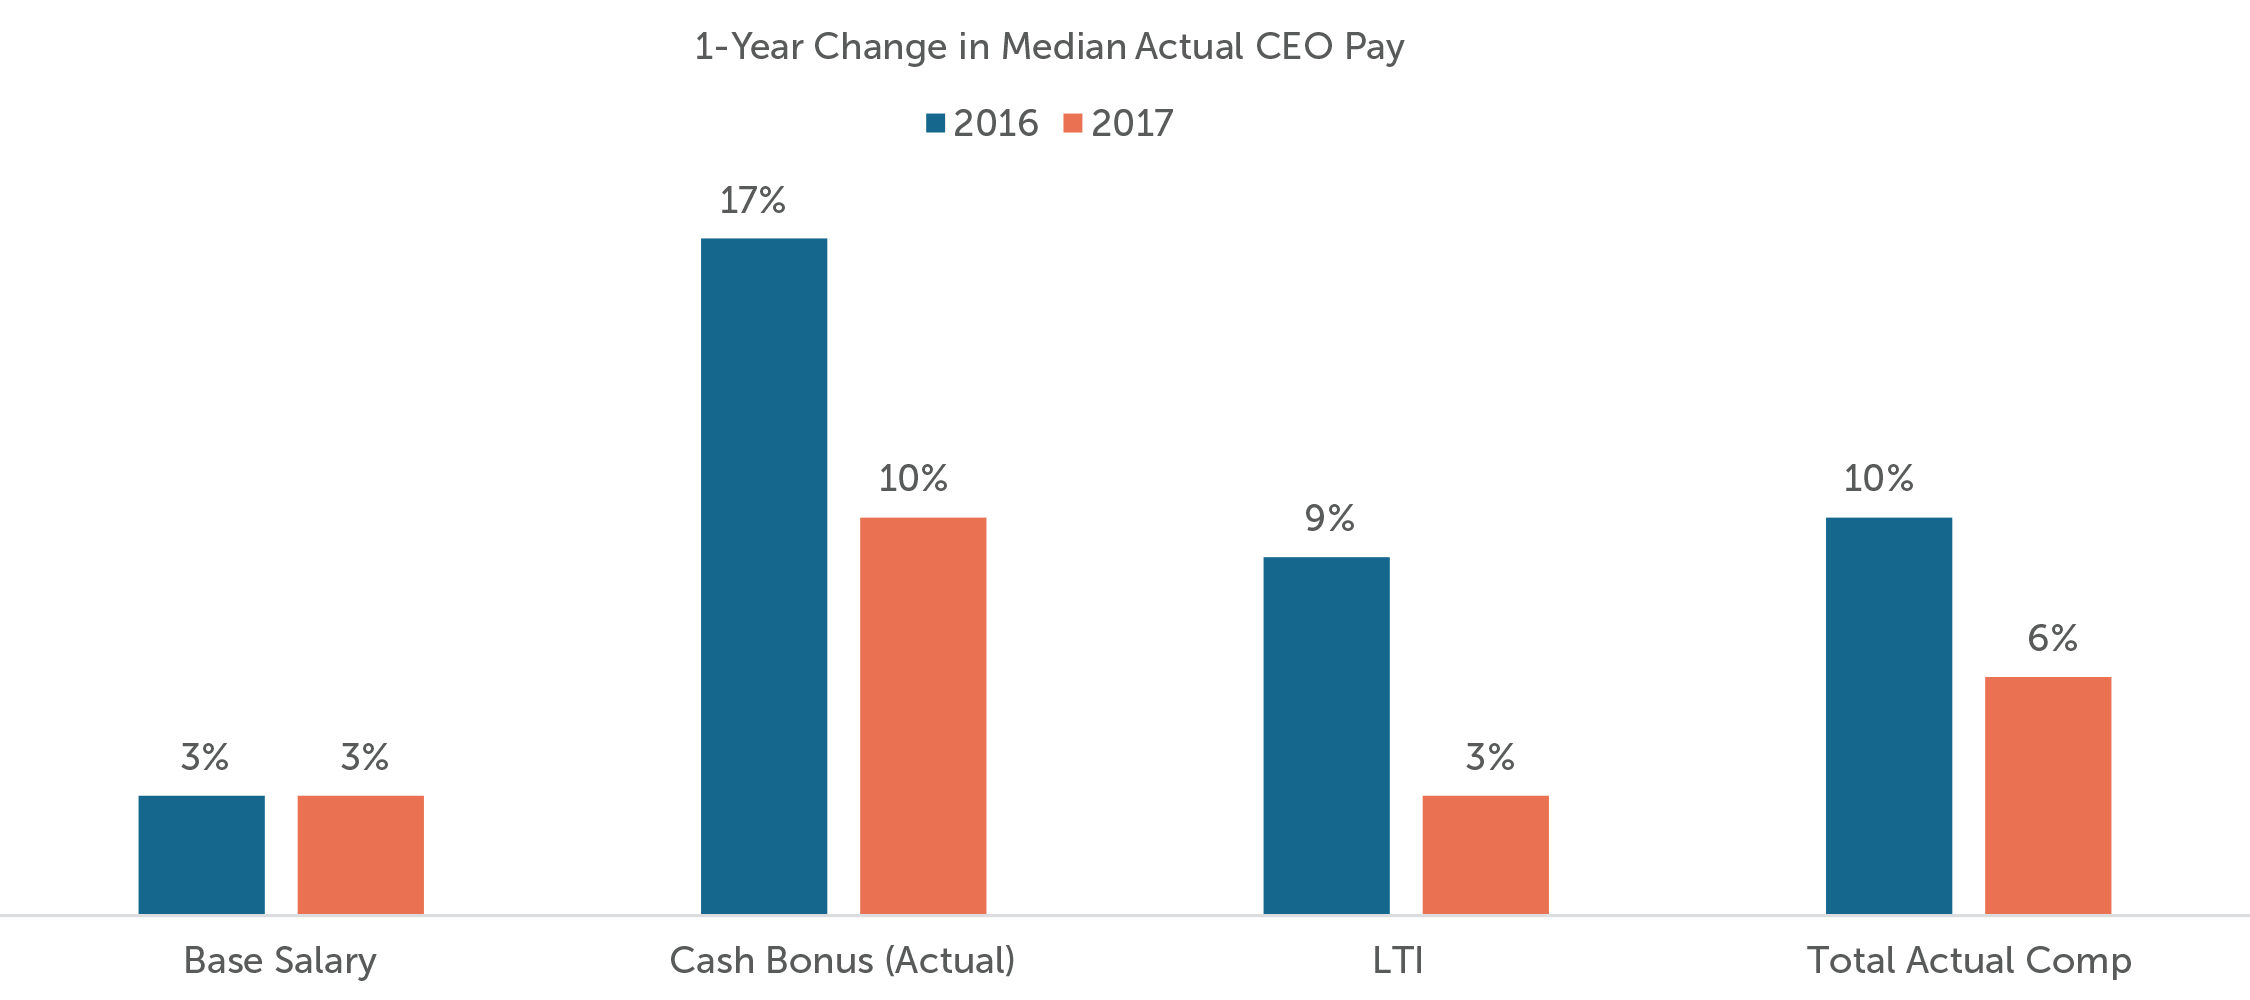
Our study examined the annual change in actual total compensation, which includes the sum of salary, 2017 bonus payments (paid Q1 2018) and the grant date value of 2017 long-term incentives (LTI) for CEOs who have been in their position for both 2016 and 2017. Total compensation increased by approximately 6%, driven primarily by an increase in cash bonuses. Last year, we saw larger increases in both LTI (+ 9%) and in cash bonuses (+ 17%) resulting in a 10% increase in total compensation.
*Reflects performance payout above target.
Utilities generally pay out annual incentives above target. In our sample, at least 75% of companies’ 5-year average payout was above target with a median 5-year average of 122%. CAP’s research suggests that in the broader market, companies and committees generally set goals with a degree of difficulty so that there is a 60-65% chance of achieving at least target performance. While it is not uncommon to continually pay out at or above target, utility companies do it at a higher rate than companies in other industries. This is partially due to a more predictable business model, so they rarely pay zero bonus, but also do not pay maximum very often.
Annual Incentive Plans – Adjustments
The most common metric among utilities continues to be earnings metrics (EPS, EBITDA, etc.) as it most directly correlates with the operations of the business. As is common in the broader market, nearly all companies use an adjusted metric. It is reasonable to adjust for variables outside of management’s control but adjusting for too many variables can lead to a disconnect between pay and performance and causing misalignment with shareholders. Further, ISS and Glass Lewis use GAAP metrics in their pay for performance models, so it is important to test their models using GAAP metrics to ensure there is no pay for performance misalignment.
Utilities generally adjust for mark-to-market fluctuations, closing of plants, merger/integration costs, cost saving initiatives, regulatory charges, operations and maintenance expenses, and nuclear decommissioning trust. These are the most common adjustments as management has limited ability to impact the way these variables affect metrics. CAP found that 90% of companies in our sample adjust for at least one of these variables.
Additionally, 80% of companies who made adjustments to incentive metrics also adjusted out the positive impact of Tax Reform as this was not anticipated at the time goals were set at the beginning of the year. Companies and committees felt they should not get the benefit of the positive impact.
Annual Incentive Plans – Goal Setting
While profitability measured on a GAAP basis was up +7%, on a reported basis, earnings increased +6%, which aligns with above target bonus payouts in 2017.
It continues to be a trend in goal-setting among utilities to set targets lower than prior year target or actual performance, given the variables of the industry that are beyond management control (i.e., declining prices, changes in demand, etc.). This particular issue of goal-setting continues to be an area of concern for proxy advisory groups. However, continual higher performance can be challenging in the industry and setting unattainable targets can negate the effectiveness of incentives. When setting targets, management may have a better sense of the more “predictable” adjustments, but actual performance reflects the volatility of the business and unpredictable outcomes that are not foreseen in the target-setting process. Among the companies in our sample, 24% of companies set 2017 targets below 2016 targets and 25% set 2017 targets below 2016 actual. This is compared to 40% and 44%, respectively, for 2016 targets.
Long-Term Incentives – Emphasis On Longer Term Performance Plans
Utilities companies long-term incentive plans place strong emphasis on performance-based compensation with 90% of companies placing at least 50% weight on a performance plan. Only one company in our sample does not use a performance plan in their long-term incentives. These companies also place more emphasis on time-based restricted stock and less emphasis on stock options as compared to the broader market (only 5 companies grant stock options in our sample).
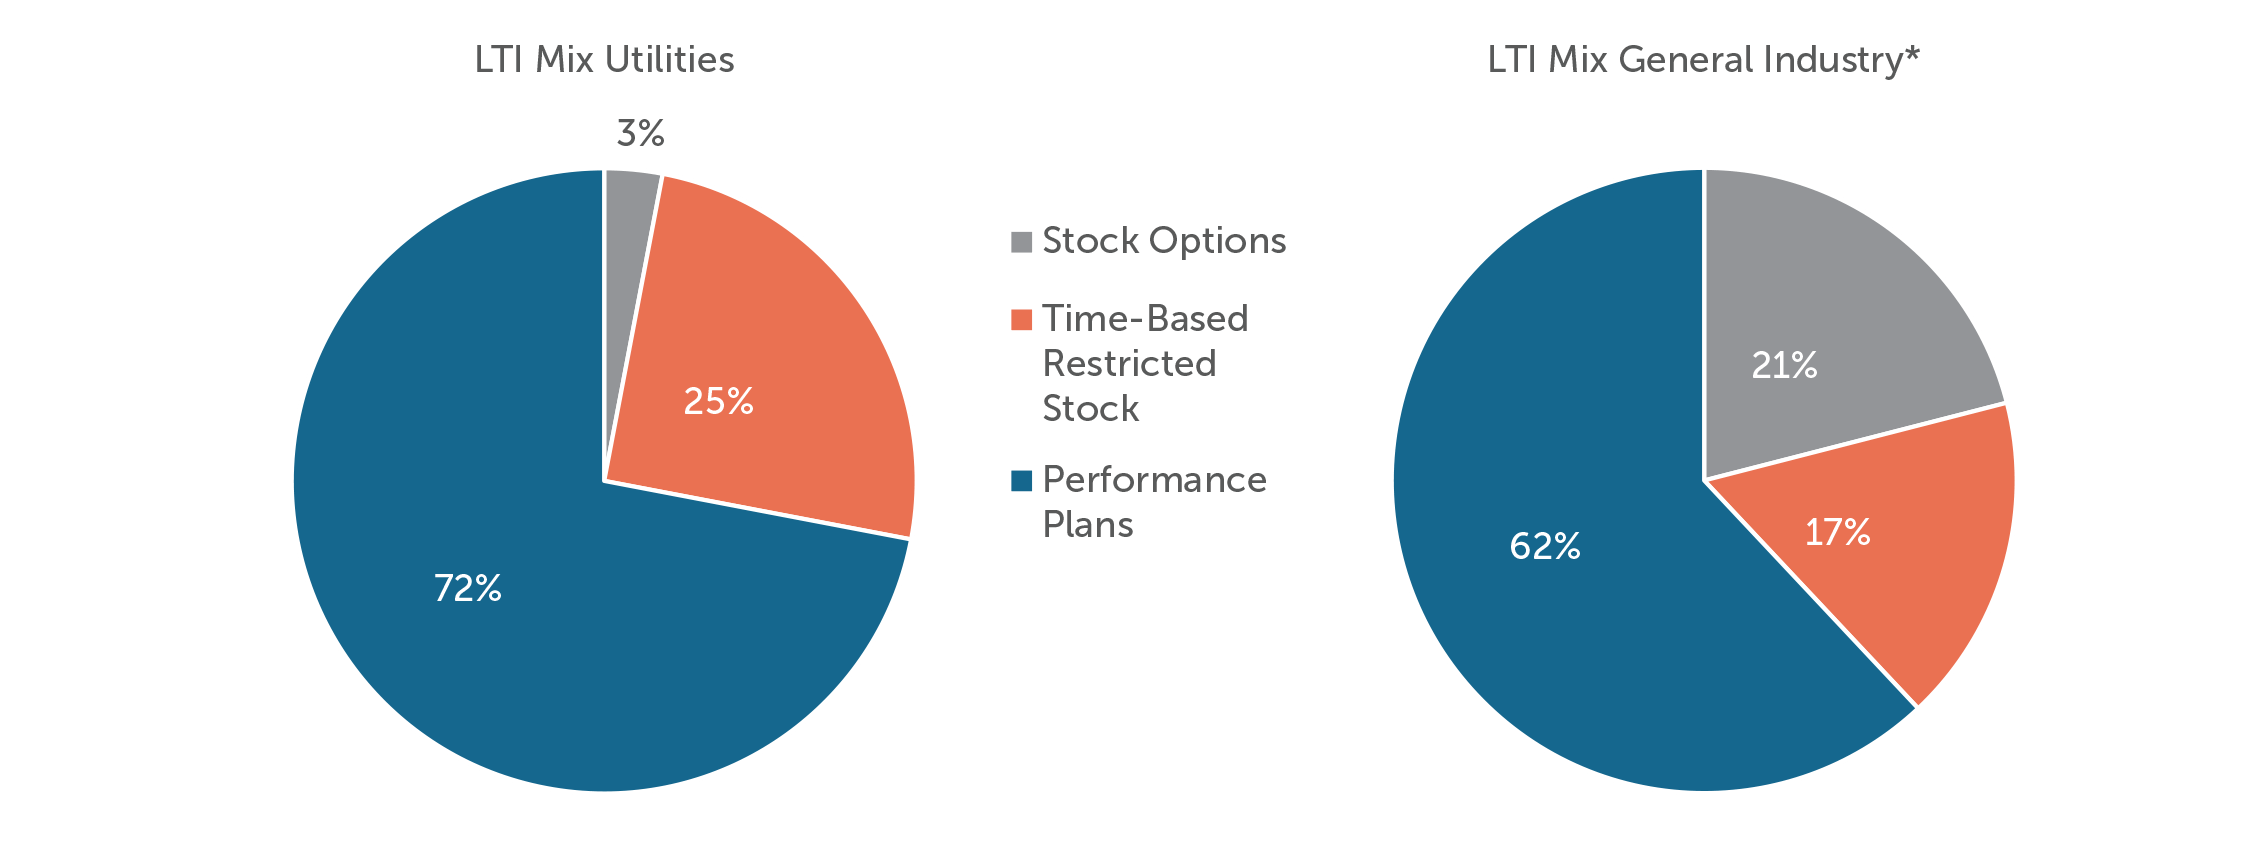
*Compensation Advisory Partners 100 Company Database
Most companies use a 3-year performance period. As a result, companies are linking executive pay with long term performance, measured most often by Relative TSR or EPS vs. plan; all but three companies use relative TSR in their long-term incentive plans. The most common comparator group is the compensation peer group; however, over half the companies measure against an index.
TSR Comparator Groups
| Comparator Group | Prevalence (% of companies) |
| Compensation Peer Group | 28% |
| Edison Electric Institute | 24% |
| S&P 500 / S&P 1500 / S&P 400 Mid-Cap Utilities | 18% |
| Performance Peer Group | 15% |
| Philadelphia Utility Index | 15% |
Of the 21 companies with EPS in their long-term incentive program, 67% also use it as a metric in their short-term incentive program. This double-use can be an area of concern for select shareholders and is often raised by proxy advisors, especially when pay and performance are misaligned. However, these companies typically use different targets for the metric when both annual operating targets and long-term strategy are key areas of focus and we believe this can often be effective in reinforcing priorities.
*Excludes relative TSR metrics
Conclusion
After experiencing a relatively slow period of growth over the last several years, the utility industry is expected to pick up over the next few years. The industry, as a whole, is expected to face several conflicting factors. Increased energy efficiency will slow consumption, but demand for power is expected to increase, particularly in connection with an increase in new housing construction. With an increase in demand and an anticipated increase in prices, utility companies can expect to see profit growth over the next few years. The utility industry increase is expected to track with the greater macroeconomic growth anticipated in this period. On the other hand, regulation is expected to increase, slowing profit growth.
The removal of the Clean Power Plan, in addition to the expiration of the Federal Investment Tax Credit and Production Tax credit will slow the high growth that renewable energy has seen over the last couple of years. Despite this, many states are expected to continue to implement renewable portfolio standards which will lead to more energy creation from renewable resources. With the Environmental Protection Agency’s (EPA) removal of the Clean Power Plan, electric power operators may be less likely to move away from coal production (compared to if it had stayed in place) but with natural gas prices expected to remain low, coal-power generation companies will continue to face challenges.
Management and Boards of companies in this industry must continue to monitor the changing environment and maintain a corporate strategy and goals that will allow success in the highly regulated environment. The continued use of non-GAAP metrics in incentive plans will aid proper incentivization for executives in the challenging market, but adjustments should only be made for factors outside management’s control or were unforeseen in the goal-setting process (i.e., tax reform). The biggest struggle companies will face with shareholders and proxy advisory firms is ensuring that appropriate financial goals are being set in both the business plan and incentive plans for executives.
Additional Information – New Ceo Pay Ratio Disclosure
All of the companies in our sample were required to disclose the ratio of their CEO pay to that of the median employee in 2018. The utility industry saw some of the lowest pay ratios across all companies. CEO pay in our sample ranged from 15x to 190x, with a median of 64x that of the median employees’ pay. The lower ratios compared to the broader market are due to primarily US workforces and high percentages of unionization among the employee population, resulting in much higher median employee pay as compared to other industries (median pay of $122k). Given the flexibility that companies have in the methodology and assumptions used to calculate the ratio, comparisons of ratios between companies are less meaningful. To date, institutional investors and proxy advisory firms have not used disclosed CEO pay ratios to inform their voting decisions. We may see some year-over-year comparisons in the second year of disclosure.
For questions or more information, please contact:
Dan Laddin Partner [email protected] 212-921-9353
Shaun Bisman Principal [email protected] 212-921-9365
Joanna Czyzewski Associate [email protected] 646-486-9746
Robert Martin and Diane Lee provided research assistance for this report.
Exhibit 1
- ALLETE, Inc.
- Alliant Energy Corporation
- Ameren Corporation
- American Electric Power Company, Inc.
- American Water Works Company, Inc.
- Avangrid, Inc.
- Avista Corporation
- Black Hills Corporation
- CenterPoint Energy, Inc.
- CMS Energy Corporation
- Consolidated Edison, Inc.
- Dominion Energy, Inc.
- DTE Energy Company
- Duke Energy Corporation
- Edison International
- El Paso Electric Company
- Entergy Corporation
- Eversource Energy
- Exelon Corporation
- FirstEnergy Corp.
- Hawaiian Electric Industries, Inc.
- IDACORP, Inc.
- MDU Resources Group, Inc.
- MGE Energy, Inc.
- NextEra Energy, Inc.
- NiSource Inc.
- NorthWestern Corporation
- OGE Energy Corp.
- Otter Tail Corporation
- PG&E Corporation
- Pinnacle West Capital Corporation
- PNM Resources, Inc.
- Portland General Electric Company
- PPL Corporation
- Public Service Enterprise Group Incorporated
- Sempra Energy
- The AES Corporation
- The Southern Company
- Unitil Corporation
- Vectren Corporation
- WEC Energy Group, Inc.
- Xcel Energy Inc.
1 See Exhibit 1 for list of companies included.


