


DOWNLOAD A PDF OF THIS REPORT pdf(0.1MB)
Contact
Shaun BismanPartner [email protected] 212-921-9365 Chris Callegari
Senior Associate [email protected] 646-486-9747 Kelly Malafis
Founding Partner [email protected] 212-921-9357
Compensation Advisory Partners (CAP) examined 2019 CEO compensation levels and pay and governance practices among 40 companies in the regional bank industry. The banks were stratified into three groups based on FY’19 asset size: $1B – $5B in assets (“small banks”; n=13), $5B – $10B in assets (“medium banks”; n=13) and $10B – $20B in assets (“large banks”; n=14). This report discusses both the similarities and differences in compensation levels, incentive plan design and governance practices between the three groups. We also highlight current issues facing the banking industry in 2020 and as we head into 2021.
Highlights
- Total Pay Mix: As banks increase in size, a higher percentage of CEO total pay shifts from fixed compensation to at-risk or variable compensation
- 2019 Financial Performance: Banks performed well in 2019 resulting in annual incentive payouts around target for all three groups; however, CEO annual incentives were lower than in 2018 as 2019 financial performance lagged 2018 growth levels
- Annual Incentive Plan Metrics: For all banks, the most prevalent metrics generally include Efficiency Ratio, Asset Quality, Return on Assets (ROA), Earnings Per Share (EPS), Return on Equity (ROE), and Net Income with smaller banks also factoring in Loan and Deposit levels more frequently
- Long-Term Incentive Plan Metrics: For all banks, relative Total Shareholder Return (TSR), EPS, ROA and ROE are frequently used together. Medium and large banks are more likely to measure performance on both an absolute and relative basis
- Stock Ownership Guidelines: All large banks have policies in place for executives compared to less than three-fourths of small and medium banks
- Clawback Policy: Across all banks in our study, over 80 percent have a policy that extends beyond Sarbanes-Oxley requirements. More of the large banks have a policy in place compared to the small and medium banks
- Looking Ahead: The impact of COVID-19 on incentive plans and the 2020 presidential election is creating a lot of uncertainty as banks close out 2020 and prepare for 2021. Additionally, diversity and inclusion will continue to gain attention and is a topic increasingly discussed at the Compensation Committee and Board level
Chief Executive Officer (CEO) Actual Pay Levels and Mix
Similar to our findings in prior year studies, CEOs at the larger banks have higher pay levels and more of their total pay delivered in at-risk or variable compensation, such as annual or long-term incentives. Conversely, executives at smaller banks are often paid more fixed compensation or base salary. For banks, asset size is a strong indicator of complexity as larger banks have more branches, products, and services offerings, corresponding to greater challenges and risks for management.

Specifically, 52 percent of compensation was fixed at the small banks compared to 43 and 32 percent at the medium and large banks, respectively. Larger banks also grant more compensation in the form of equity, which is tied to either multi-year vesting and/or performance criteria. These equity grants make up 32 percent of medium bank pay for CEOs and 40 percent at the large banks in the sample. By comparison, small banks only grant 21 percent of their compensation in these long-term equity vehicles.
2019 Performance and Pay Outcomes
Performance Results
Financial performance showed strong growth in 2019. Comparing 2018 to 2019, 2018 was a better year for the banks, which can be attributed, in part, to three interest rate cuts in 2019 (first rate cuts since 2008), creating pressure on net interest margins. Small banks had the strongest performance year among the three groups in 2019 with the majority performing in line with analyst expectations. Large banks had the weakest performance year among the three groups as more than half of the large banks underperformed against analyst expectations. ROE increased for only the small banks and one-year TSR was strong for all groups, significantly outpacing 1-year 2018 TSR. Strong 2019 TSR was consistent with the upward TSR trend seen in the overall market and super regional and Wall Street banks.
|
Metric |
Median Percent Change Year Ended December 31, 2019 |
||
|
Asset Size |
|||
|
$1B – $5B |
$5B – $10B |
$10B – $20B |
|
|
EPS |
+15.1% |
+7.8% |
+4.6% |
|
Net Income |
+16.6% |
+11.6% |
+5.9% |
|
Pre-tax Operating Income |
+16.9% |
+10.5% |
+10.0% |
|
Return on Equity |
+28 bps |
-3 bps |
-81 bps |
|
1-Year TSR at 12/31/19 |
+27.4% |
+24.9% |
+24.7% |
|
1-Year TSR at 12/31/18 |
-10.5% |
-16.4% |
-16.4% |
bps – Basis points
Source: S&P Capital IQ Financial Database
CEO Annual Incentive Payouts
Overall, the small banks had the strongest year of the three groups in 2019 based on the financials reviewed. This performance was ultimately rewarded by annual incentive plans, as seen in CEO annual incentive payouts. Small banks had the highest annual incentive payouts as a percentage of target, 109 percent, and only four banks in the small bank group paid annual incentives at or below target, compared to seven banks each in the medium and large bank sample. Annual incentive payouts across all groups declined from 2018 levels, where all three groups generally paid out above target.
|
CEO Payout as % of Target |
Asset Size |
||
|
Summary Statistics |
$1B – $5B |
$5B – $10B |
$10B – $20B |
|
75th percentile |
119% |
100% |
121% |
|
Median |
109% |
100% |
103% |
|
25th percentile |
92% |
95% |
95% |
Total Pay Changes
CEO actual total compensation (base salary, annual incentive payouts, and long-term incentives) increased in 2019. The largest increases were at the large and small banks (9.6% and 5.2%, respectively) which was driven by a combination of base salary increases and larger long-term equity grants. While annual incentives were paid at target for medium banks, 2019 bonus opportunity increases led to a 14.6% year over year increase in value. The increase in long-term incentives was likely due to strong performance in 2018, as long-term incentives are generally granted in the first quarter (early 2019) and based on prior year (2018) performance. Large banks performed stronger in 2018 compared to the small and medium banks, which may explain the larger year-over-year increase in long-term incentives.
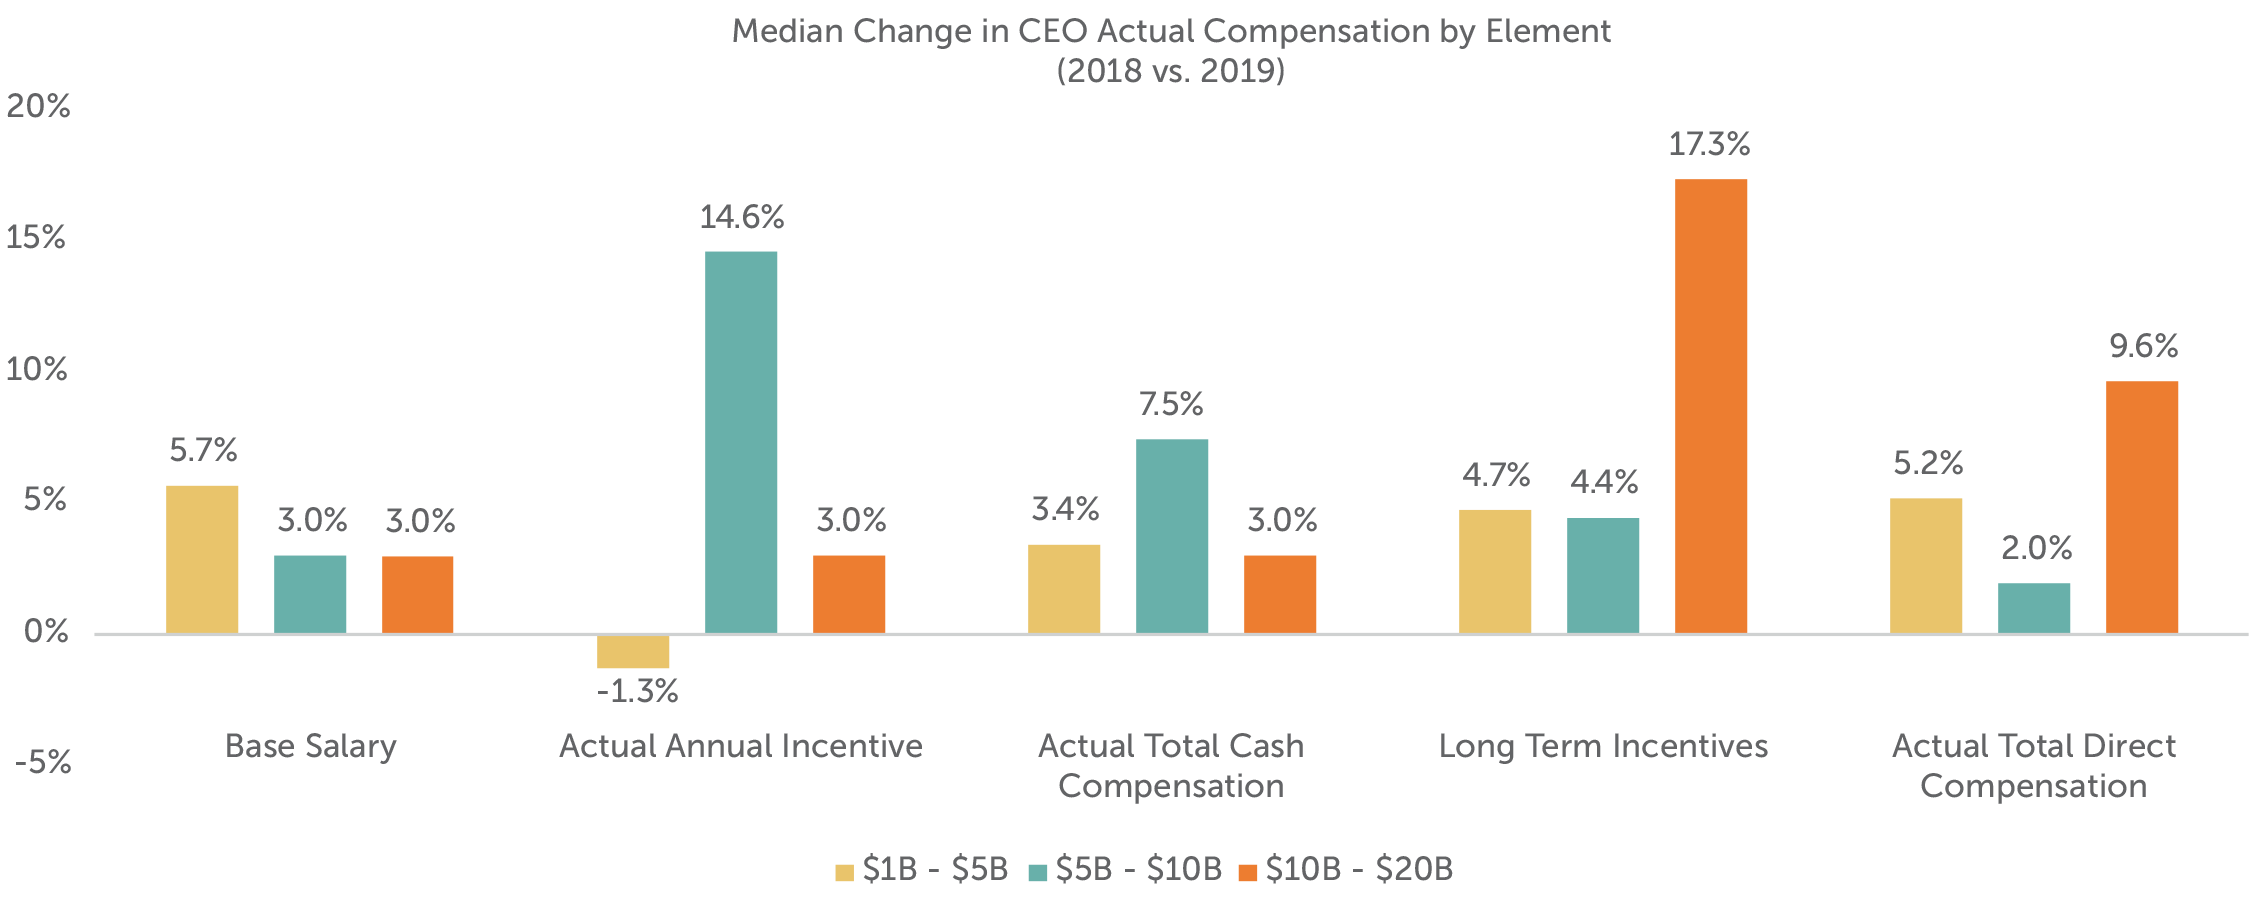
Note: Excludes companies where there was a change in CEO
Pay Practices
Annual Incentive Plans
The most common annual incentive plan approach is a “goal attainment” plan where actual financial achievement is compared to pre-established goals made at the beginning of the fiscal year. The banks in our sample typically utilize several corporate metrics when determining their annual incentive payout. Approximately 75 percent of the small, medium, and large banks use three or more weighted financial metrics. Efficiency Ratio, Asset Quality (i.e., non-performing assets, non-performing loan ratio), ROA, EPS, ROE and Net Income are the most prevalent metrics used at these banks. Returns (ROA or ROE), EPS and Net Income were typically weighted more (approximately 30-40 percent of the total plan) than Efficiency Ratio and Asset Quality metrics (approximately 15-20 percent of the total plan). The small banks differ from the medium and large banks in that they more frequently use Loan or Deposit measures in their plans, with these metrics accounting for no more than 20 percent of the total plan.

Smaller banks also tend to use and assign higher weightings to individual performance. In all cases they represent 20-50 percent of the total plan as a standalone weighted metric. These individual measures are prevalent at 46 percent of the small banks studied compared to 14-15 percent of the medium and large banks; however, the medium and large banks are more likely to incorporate strategic goals such as digital strategies, community presence or customer satisfaction.
Long-term Incentive (LTI) Plans
The most typical long-term incentives used across industries, including the banking industry, include stock options, time-vested stock (restricted stock (RS) or restricted stock units (RSUs)) and performance-vested stock. Most medium and large banks use a portfolio approach in their long-term incentive plan, with approximately two-thirds of these banks granting two or three LTI vehicles. The small bank sample more frequently either uses a single LTI vehicle (38%) or has no long-term incentive plan (15%). The LTI mix seen between the three groupings is fairly consistent, with stock options continuing to be the least utilized LTI vehicle, on average about 8 percent of the overall LTI mix. Time-vested restricted stock typically makes up about 30 percent to 40 percent of the LTI mix among these banks, with performance plans making up the bulk (about 50-65%) of LTIs in the total sample.

Performance plans are typically granted annually and have overlapping 3-year performance periods. Payouts can fluctuate based on achievement of performance measures, and the upside is normally limited to 150 percent to 200 percent of the target level. Over three-quarters of companies in each asset grouping (that utilize performance plans) measure performance against two or more metrics. The most prevalent metrics used are relative TSR, Returns, EPS, and Asset Quality for all three groupings, and it is common that two of these measures are paired together to determine all, or the majority of, the payout. Asset Quality is a fairly prevalent metric among medium sized banks (used by a third of the companies).
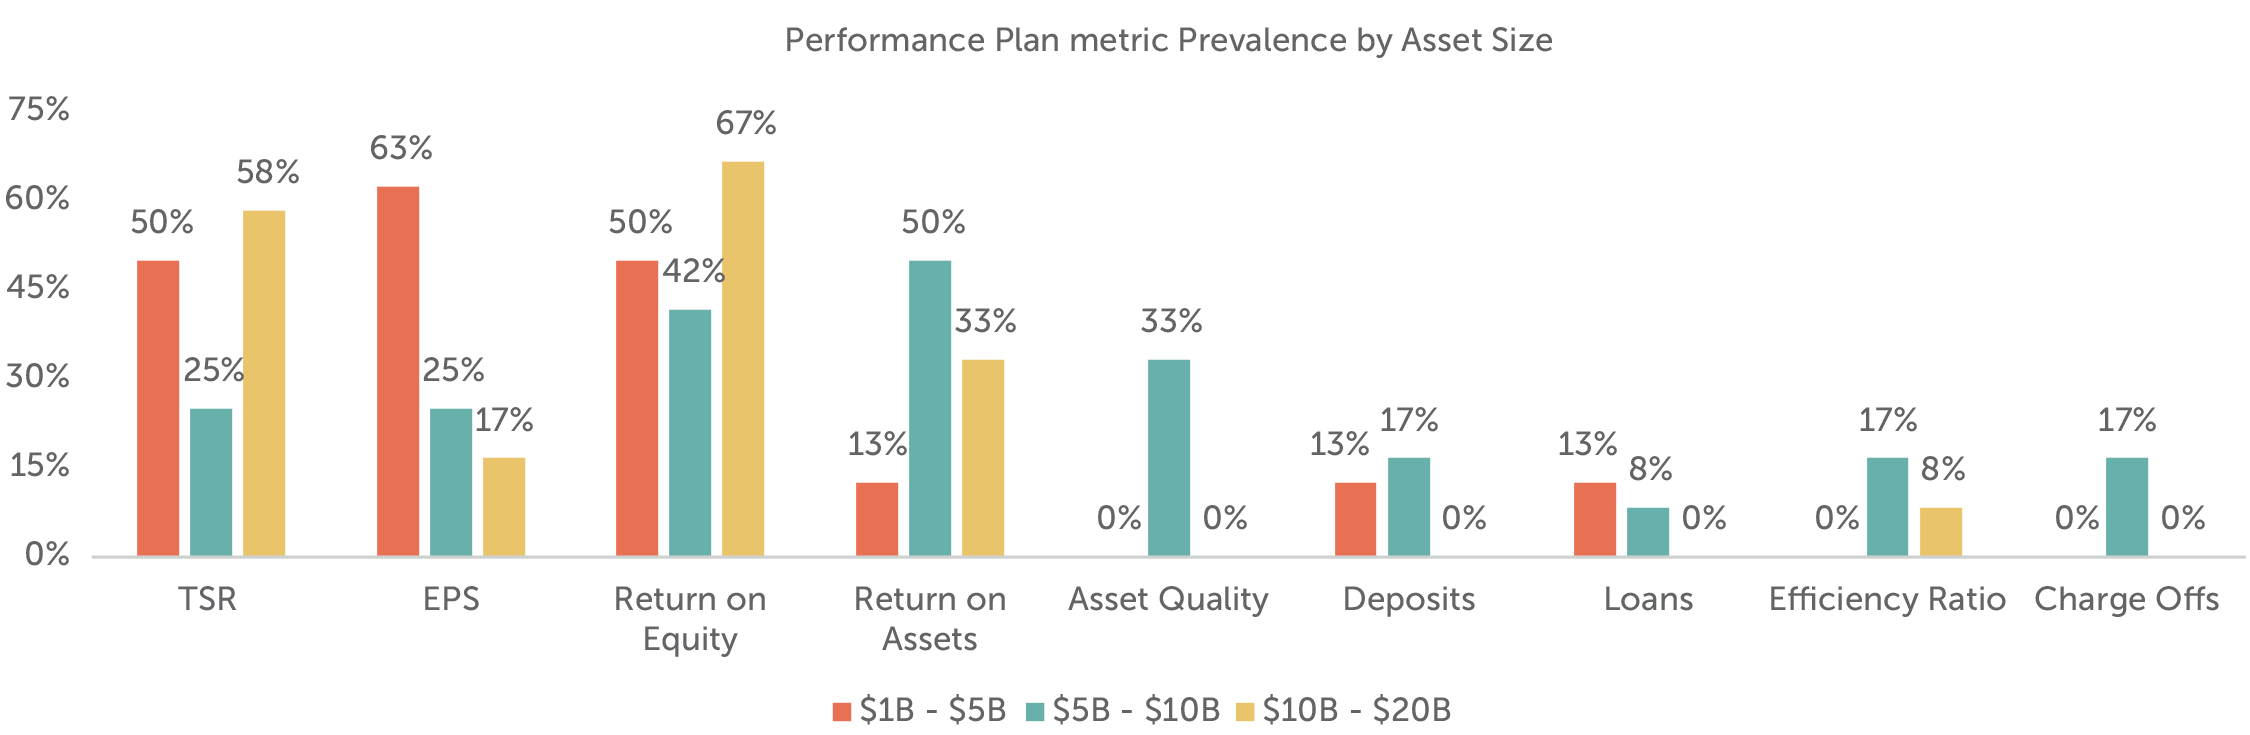
As banks increase in size, it becomes more likely that both absolute and relative comparisons are made when determining payouts; 42 percent of the large and medium banks look at performance on both an absolute and relative basis compared with 12 percent of small banks. These smaller banks may be challenged in setting 3-year goals, and, therefore, rely more heavily on relative performance.
|
Asset Size |
Performance Plan Measures |
||
|
Measurement Type(s) |
|||
|
Absolute |
Relative |
Both |
|
|
$1B – $5B |
25% |
63% |
12% |
|
$5B – $10B |
33% |
25% |
42% |
|
$10B – $20B |
16% |
42% |
42% |
TSR is almost exclusively measured on a relative basis, often measured against either the company-defined peer group or an industry index. In our sample of banks, relative TSR is more commonly installed as a weighted metric and only 5 percent of all banks use it as a modifier of the calculated payout. Other common relative metrics include Returns, EPS and Loan or Deposit growth.
Governance Practices
Stock Ownership Guidelines
The prevalence of stock ownership guidelines among the different asset groupings varies by group. All of the large banks have stock ownership guidelines in place for the named executive officers (NEOs) compared to 69 percent at the medium banks and 54 percent at the small banks. The larger banks grant a larger portion of long-term incentives in equity; therefore, it should not be surprising that executives must meet a required ownership guideline.
|
Asset Size |
Stock Ownership Guidelines |
|
|
CEO |
Other NEOs |
|
|
$1B – $5B |
62% |
54% |
|
$5B – $10B |
69% |
69% |
|
$10B – $20B |
100% |
100% |
Clawbacks
The proposed rules under the Dodd-Frank Act require companies to adopt policies that would claw back incentive compensation paid to current and former executives based on inaccurate financial results. Despite the rules being proposed in 2015 and not being finalized to date, many companies have adopted policies that are similar to the anticipated rules. Among our sample of banks, 83 percent of banks across all asset sizes have a clawback policy in place. The prevalence is greatest among the large banks.
|
Asset Size |
Clawback Policy |
|
Percent of Companies |
|
|
$1B – $5B |
77% |
|
$5B – $10B |
77% |
|
$10B – $20B |
93% |
Approximately 50 percent of the banks across all asset sizes have clawback triggers for financial restatement regardless of fraud or misconduct and 36 percent of banks can recoup incentive compensation due to fraud, misconduct, or material inaccurate financials beyond a financial restatement.
It is common for organizations to adopt stronger governance protocols such as stock ownership guidelines and clawback policies as they increase in size and may be more closely scrutinized by investors, regulators, and proxy advisory firms.
Looking Ahead
Impact of COVID-19 on Incentive Plans
Many banks set their 2020 incentive plan goals early in the year, before the onset of the COVID-19 pandemic in the U.S. As the second half of 2020 continues and the true economic impact of COVID-19 is felt globally, CAP expects some banks to use discretion to adjust 2020 annual incentive payouts, widen or change goals for outstanding performance-vested LTI goals and modify the 2021 annual incentive and LTI design. Most banks are waiting until year end to make specific decisions on any potential adjustments to incentives, as companies will try to quantify the COVID-19 related impact and address elements that were outside of management’s control (i.e., zero interest rate environment). Further, with stock prices down over 30 percent to date, equity worth less today compared to the grant date fair value, and annual and long-term performance plans projected to pay out well below target, Compensation Committees may feel the pressure to adjust incentive plan payouts or award retention bonuses in order to motivate and retain key talent.
Diversity and Inclusion Metrics in Incentive Plans
Diversity and inclusion is a topic that is increasingly being discussed among Board members and Compensation Committees specifically. With a growing focus on increasing diversity in the industry, the natural question is whether such initiatives should be included in compensation decision making. One large bank in our sample considers the achievement of certain diversity and inclusion targets as part of its individual assessment. While currently a minority practice to include diversity and inclusion measures in incentive plans, a discussion around each banks' diversity and inclusion statistics is increasingly becoming an agenda topic at Board meetings.
Given today’s climate, CAP expects an increase in the number of companies measuring the progress of diversity though the approach may vary between a quantitative metric or a more qualitative assessment. Compensation Committees have the flexibility to tailor goals that will impact payouts to the executives most responsible for this progress. The inclusion of diversity and inclusion progress in incentive compensation plans could highlight the importance of a company’s commitment to these objectives.
2020 Presidential Election
The banking industry has generally benefited from the policies of the current administration and reduced level of regulations. Two recent pieces of legislation have had a positive impact on the banking industry’s financial performance.
- 2017 Tax Cuts and Jobs Act: Meaningful benefit for corporations due to the reduced corporate tax rate
- 2020 Coronavirus Aid, Relief, and Economic Security Act: Benefited banks from fee income related to the Paycheck Protection Program loans
By contrast, the Democratic candidate Joe Biden plans to raise taxes and stiffen oversight of the banking industry. Given the uncertainty regarding taxes and regulation, banks financials may be impacted with an increase in taxes and heavier regulation in 2021 and beyond.
Conclusion
Compensation program practices have remained steady among our sample of banks. We expect to see changes in 2020 and beyond given the pandemic and focus on diversity and inclusion. As was the case after the 2008/2009 financial crisis, the ability to adjust and adapt to a changing environment is critical to the success of banks in attracting, motivating, and retaining key talent. While employee retention will be a key objective for management and Compensation Committees, banks must balance rewarding employees for their extraordinary efforts in response to the pandemic with pay for performance alignment and the shareholder experience. Further, given the heightened focus on diversity and inclusion and public commitments to diversity, companies are committing resources for initiatives aimed at promoting a diverse and inclusive workplace. We expect banks in our study to continue their efforts to make progress on the diversity and inclusion front.
For questions or more information, please contact:
Kelly Malafis Partner [email protected] 212-921-9357
Shaun Bisman Principal [email protected] 212-921-9365
Chris Callegari Senior Analyst [email protected] 646-486-9747
Stefanie Kushner and Felipe Cambeiro provided research assistance for this report.
Regional Banks in CAP’s Study (n=40)
Small Banks ($1B – $5B in assets)
- Bridge Bancorp, Inc.
- Capital City Bank Group, Inc.
- Central Valley Community Bancorp
- CNB Financial Corporation
- Evans Bancorp, Inc.
- Farmers National Banc Corp.
- First Business Financial Services, Inc.
- First Financial Northwest, Inc.
- German American Bancorp, Inc.
- Heritage Commerce Corp
- Independent Bank Corporation
- National Bankshares, Inc.
- Sierra Bancorp
Medium Banks ($5B – $10B in assets)
- 1st Source Corporation
- Amerant Bancorp Inc.
- Banc of California, Inc.
- Boston Private Financial Holdings, Inc.
- Brookline Bancorp, Inc.
- First Busey Corporation
- First Commonwealth Financial Corporation
- First Foundation Inc.
- Lakeland Bancorp, Inc.
- Park National Corporation
- Seacoast Banking Corporation of Florida
- Univest Financial Corporation
- Westamerica Bancorporation
Large Banks ($10B – $20B in assets)
- Ameris Bancorp
- Atlantic Union Bankshares Corporation
- BancorpSouth Bank
- Bank of Hawaii Corporation
- Berkshire Hills Bancorp, Inc.
- Cadence Bancorporation
- Community Bank System, Inc.
- First Merchants Corporation
- First Midwest Bancorp, Inc.
- Glacier Bancorp, Inc.
- Great Western Bancorp, Inc.
- Old National Bancorp
- Trustmark Corporation
- United Bankshares, Inc.


