Annually, Compensation Advisory Partners (CAP) evaluates pay levels for Chief Financial Officers (CFOs) and Chief Executive Officers (CEOs). This year’s analysis is based on a sample of 108 companies with median revenues of $12.4 billion. For more information on how we developed the sample of companies, please see below under Sample Screening Methodology.
Highlights
- Salary increases were provided much more frequently to CFOs, with approximately 70% receiving a salary increase, than to CEOs
- The median salary increase was only 0.3% for CEOs, while CFO salaries grew by 3.0%
- Similar to last year, the median increases in actual total direct compensation (i.e., cash plus equity) for both CEOs and CFOs, were in the low single-digits
- 2014 median increases in actual total direct compensation were 3.2% for CEOs and 5.2% for CFOs
- Slightly higher pay growth for CFOs was partially driven by higher annual bonus target opportunities in 2014
- On an absolute basis, CFO total compensation continues to approximate one-third of CEO total compensation
- Little or no changes observed in how long-term incentives are delivered to CEOs and CFOs; Long-term incentive mix continues to emphasize performance-based equity
Study Results
Salaries
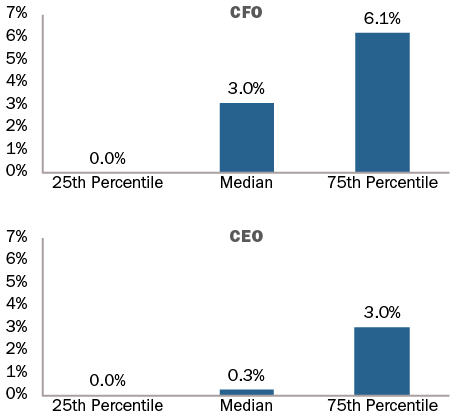
In the last 2 years, approximately 70% of CFOs received salary increases. The median salary increase for CFOs was 3.0% and the 75th percentile salary increase was 6.1%. In comparison, only about half of CEOs received salary increases. The median salary increase for CEOs was only 0.3% at median and the 75th percentile salary increase was 3.0%.
|
% of Executives Receiving Salary Increases |
||||
|
|
2012 – 2013 |
2013 – 2014 |
||
|
|
No Increase |
Receiving Increase |
No Increase |
Receiving Increase |
|
CEO |
52% |
48% |
49% |
51% |
|
CFO |
31% |
69% |
28% |
72% |
2014 Salary Increases
Actual Pay Levels
Our findings indicate a median rate of increase in actual total direct compensation levels for both CEOs and CFOs in the low-single digits. The median increases over the last two years ranged between 3% and 5%. During 2013-2014, actual total direct compensation (salary plus actual annual incentive plus the grant date value of long-term incentives) for CEOs and CFOs increased by 3.2% and 5.2%, respectively.
Industry Trends
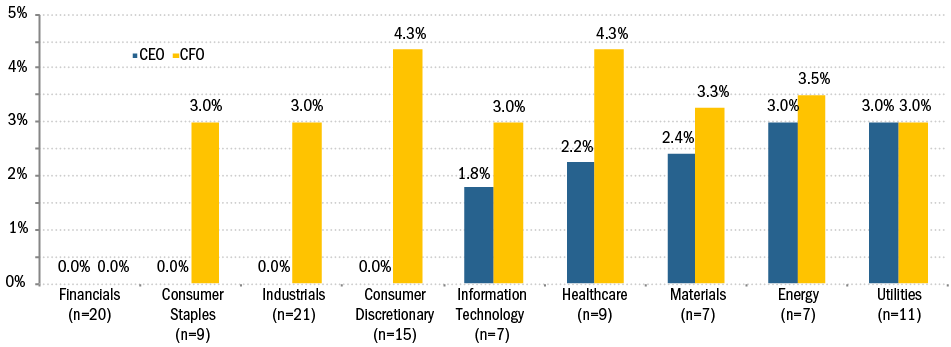
2014 Median Salary Increase by Industry
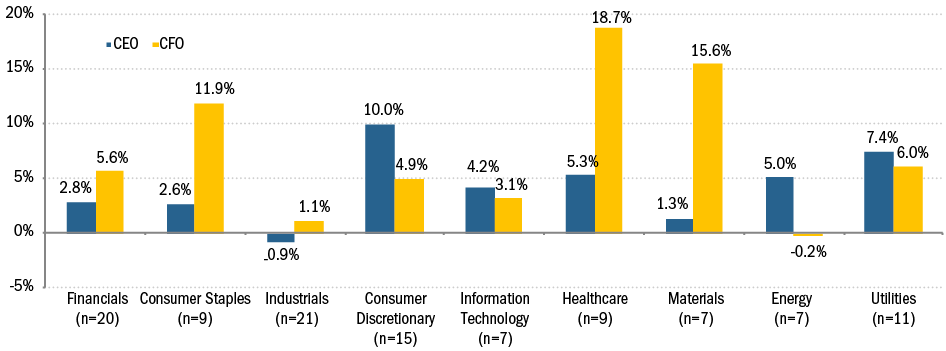
2014 Median Actual Total Compensation Increase by Industry
|
Median Percentage Change in Pay Components |
||||
|
|
2012 – 2013 |
2013 – 2014 |
||
|
Pay Components |
CEO |
CFO |
CEO |
CFO |
|
Salary |
0% |
3.0% |
0.3% |
3.0% |
|
Actual Bonus |
4.1% |
3.7% |
4.3% |
7.8% |
|
Long-Term Incentives |
2.3% |
3.1% |
3.7% |
4.2% |
|
Actual Total Direct Compensation |
3.7% |
3.6% |
3.2% |
5.2% |
As seen in the table above, the median 2014 increase in actual bonus for CFOs was double the median increase for CEOs. This large increase in annual bonus is partially driven by higher bonus target opportunities in 2014 for CFOs, with the median target bonus increasing from 90% to 100% of salary. In contrast, CEO target bonus opportunities remained relatively flat at approximately 150% of salary.
|
Target Bonus as % of Salary |
||||
|
|
2013 |
2014 |
||
|
Pay Components |
CEO |
CFO |
CEO |
CFO |
|
25th Percentile |
125% |
75% |
125% |
80% |
|
Median |
147% |
90% |
150% |
100% |
|
75th Percentile |
170% |
100% |
165% |
105% |
When analyzed by industry, median increases in salary for CEOs are generally less than 3%. Median salary increases to CFOs are much more robust, generally in the range of 3-4%. Median salary increases over 3% are seen for CFOs in the following industries: Consumer Discretionary, Energy, Healthcare, and Materials. The Financials industry is the only industry were the median change in salary was 0% for both CEOs and CFOs.
When we look at actual total direct compensation by industry, greater volatility is observed. The volatility in year-over-year changes is primarily driven by industry and company performance. Some of the largest increases in compensation levels are seen in Consumer Staples, Healthcare and Materials.
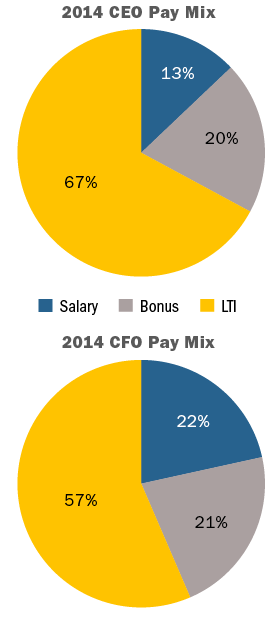
Target Pay Mix
The average total target compensation pay mix remained largely unchanged. At-risk pay continues to be more emphasized for CEOs than for CFOs.
Long-Term Incentive (LTI) Vehicle Prevalence and Mix
Equity mix and vehicles used for LTI awards remained fairly consistent for the past several years. The majority of companies continue to use two different vehicles to deliver long-term incentives to CEOs/CFOs and a quarter of companies studied use all three equity vehicles (time-based stock awards, awards under a performance plan, and stock options)
Performance plans account for roughly 50% of LTI awards, about 25% is delievered in stock options, and about 25% in time-vested restricted stock awards. The overall percentage of performance-based awards (performance plans and stock options) for both CEOs and CFOs continues to range between 75% – 80%.
|
LTI Mix |
||||
|
|
2013 |
2014 |
||
|
|
CEO |
CFO |
CEO |
CFO |
|
Stock Options |
27% |
27% |
26% |
25% |
|
Time Vested Restricted Stock |
17% |
22% |
21% |
26% |
|
Performance Plans |
56% |
51% |
53% |
49% |
Conclusion
In terms of performance, 2014 was a good year for our sample of companies with median total shareholder return of 15%, median revenue growth of 5% and median net income growth of 9%. We believe the 2014 pay changes were aligned with performance for the year. For CEOs, salary increases were modest, but increases in actual bonus and long-term incentives contributed to a median increase in actual total direct compensation of 3.2%. Pay progression opportunities for CFOs were even stronger, with a median increase of 7.8% in actual bonus and 4.2% in long-term incentives yielding a 5.2% median increase in actual total direct compensation.
In terms of compensation program design for senior executives, we saw relatively little change. The increase in annual target bonus opportunity for CFOs was noteworthy, but long-term incentives practices are similar to last year’s study. The increase in performance-based long-term incentives is significant and we expect this to remain the mainstream practice.
Sample Screening Methodology
Based on the screening criteria below, we arrived at a sample of 108 public companies with median 2014 revenue of $12.4B.
|
Revenue |
At least $5B in revenue for fiscal year 2014 |
|
Fiscal year-end |
Fiscal year-end between 9/1/2014 and 12/31/2014 |
|
Proxy Statement Filing Date |
Proxy statement filed before 3/31/2015 |
|
Tenure |
No change in CEO and CFO incumbents in the past three years |
|
Industry |
All industries have been considered for this analysis |