One of the major developments of the 2013 proxy season was an increase in the prevalence of voluntary realized and/or realizable pay disclosure. Many companies have become concerned that compensation values reported in the Summary Compensation Table (“SCT”) and the Grants of Plan Based Awards table (“GPBA”) may misguide readers on the levels of compensation that their executives actually receive and therefore, have the potential of leading to a perceived pay vs. performance disconnect.
To address the limitations of SCT and GPBA data, companies have begun to disclose realized and realizable pay (see table below for definitions of realized and realizable pay). In order to evaluate this growing trend, Compensation Advisory Partners (“CAP”) reviewed the 2013 proxy statements of public Fortune 500 companies and tallied the disclosure of realized and realizable pay. For companies that presented a discussion on this topic, we recorded the use of graphics (e.g., tables and charts), we considered what methods companies used to compare different definitions of pay (e.g., vs. SCT/target pay, relative to a peer group, etc.), and we also tracked companies that supplemented their disclosure with the use of performance metrics.
|
Pay Component |
Realized |
Realizable |
|
Time Period |
1 – 5 years |
|
|
Base Salary |
Base salary disclosed in Summary Compensation Table (“SCT”) |
|
|
Bonus |
Actual bonuses/non-equity incentive (annual variable cash incentive) disclosed in the SCT |
|
|
Time-based Equity Awards |
||
|
Stock Options |
Value gained upon exercise for all stock options exercised within measurement period |
Valued at end of performance/measurement period Two alternative approaches: Intrinsic (in-the-money) value of awards granted during measurement period Updated Black-Scholes valuation of awards granted within measurement period |
|
Restricted Stock/Units |
Value at vest for all shares/units that vest within measurement period |
Value at end of measurement period, of all shares/units granted during measured period |
|
Performance-Contingent Equity Awards |
||
|
Stock/Stock Units |
Value upon payout, for all awards that paid during measured period |
Two alternative approaches: Value upon payout, for all awards that paid during measured period Awards granted, vested, and paid out during measured period; if unvested, target value of shares awarded during measured period |
|
Long-term Cash |
Long-term cash incentive payouts during measurement period disclosed in SCT |
Two alternative approaches: Long-term cash incentive payouts during measurement period disclosed in SCT Awards granted, vested, and paid out during measured period; if unvested, target value of long-term cash awarded during measurement period |
Results
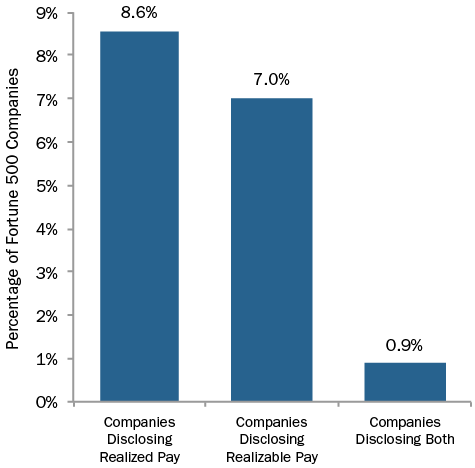
Among our sample of Fortune 500 companies, 15% supplemented the SCT and GPBA with realized and/or realizable pay disclosure. Approximately 9% of our sample disclosed realized pay, 7% disclosed realizable pay, and 1% disclosed both.
Realized Pay Disclosure
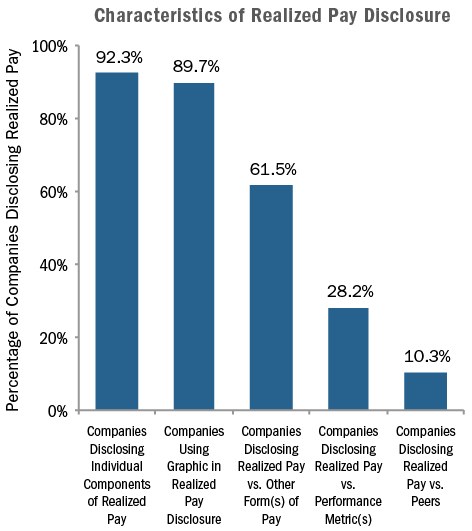
For companies disclosing realized pay, the most common methodology used was base salary actually paid, bonus actually paid, the value of restricted stock that vested during the period, and the value realized upon exercise of options during the period. In a lesser number of cases, companies also included all other compensation and the change in pension value. The majority of companies presented realized pay on an absolute basis (i.e., on an individual company basis, not against peers or some other index). CAP found that of the companies disclosing/discussing the concept of realized pay, most (90%) used some type of chart or table to discuss the concept, 62% compared their realized pay to some other definition of compensation (companies were equally divided between disclosing a comparison of realized pay to SCT pay or to the executive’s target compensation), and approximately 28% of companies compare a performance metric (most commonly TSR) to a graphic depiction of realized pay.
Companies disclosing realized pay had a median cumulative TSR of 7% and 5% on a 1- and 3-year basis, respectively—placing the majority of disclosing companies well below the median of the Fortune 500.
|
|
Cumulative TSR at 12/31/2012 |
|
|
Fortune 500 |
1-year |
3-year |
|
Median |
14.1% |
35.5% |
|
25th Percentile |
1.6% |
2.4% |
|
15th Percentile |
-3.9% |
-6.4% |
|
10th Percentile |
-10.8% |
-18.7% |
|
Companies Disclosing Realized Pay |
|
|
|
75th Percentile |
24.7% |
38.6% |
|
Median |
6.5% |
5.2% |
|
25th Percentile |
-7.8% |
-10.7% |
Realizable Pay Disclosure
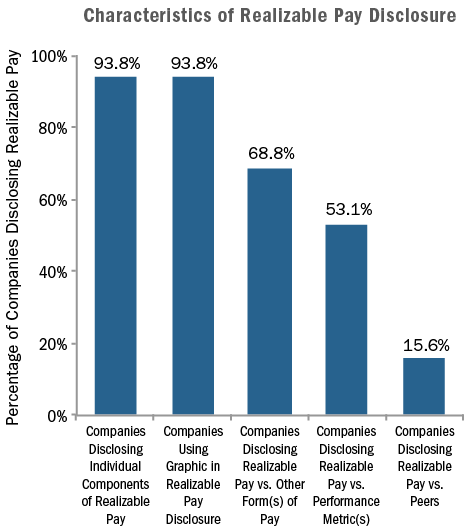
As stated above, among companies that disclosed a supplemental definition of pay, approximately half used some form of realizable pay. Typically, realizable pay is calculated as base salary, actual bonus paid, and long-term incentives granted and valued at the end of the period. For restricted stock, the value is calculated by multiplying the number of shares granted by the stock price at the end of the period. For stock options, the value is most often calculated as the intrinsic (in-the-money) value based on the stock price at the end of the period (Black-Scholes option values are also used, albeit less frequently). For performance shares, the calculation is generally based on the payout for shares granted within the period or the target number of shares granted for awards that have not vested, valued at the end of the period. Most of the companies disclosing used an accompanying table or graph to demonstrate the concept and the most commonly used graphics were: tables or charts showing the side-by-side difference between grant date/target pay vs. realizable pay, realizable pay vs. total shareholder return (TSR), or some combination of the two. Approximately 90% of companies disclosing realizable pay had SCT/GPBA pay data that was greater than realizable pay.
Like realized pay companies, a majority of Fortune 500 companies disclosing realizable pay had 1- and 3-year TSR at 12/31/2012 that trailed the median of the full Fortune 500 group. More specifically, the median TSR of realizable pay companies was slightly above the 25th percentile of the Fortune 500 on a 1-year basis, and between the 15th percentile and 25th percentile on a 3-year basis.
|
|
Cumulative TSR at 12/31/2012 |
|
|
Fortune 500 |
1-year |
3-year |
|
Median |
14.1% |
35.5% |
|
25th Percentile |
1.6% |
2.4% |
|
15th Percentile |
-3.9% |
-6.4% |
|
10th Percentile |
-10.8% |
-18.7% |
|
Companies Disclosing Realizable Pay |
|
|
|
75th Percentile |
19.2% |
37.1% |
|
Median |
1.7% |
-1.8% |
|
25th Percentile |
-15.0% |
-30.0% |
Conclusion
The 2013 proxy season was the first year where we saw a meaningful number of companies disclosing realized and/or realizable pay and with the 2014 proxy season fast approaching, we fully expect to see an increase in supplementary pay disclosure, particularly for those companies with below-average TSR.
Research assistance provided by: Kyle Eastman, Michael Biagi, Ryan Colucci.
Note: For detailed findings or specific company examples, please call or email Eric Hosken at Compensation Advisory Partners. We expect to publish a more comprehensive discussion of the topic in the Q2 2014 World at Work Journal.
Email: [email protected]
Phone: (212) 921-9363