DOWNLOAD A PDF OF THIS REPORT pdf(0.1MB)
Contact
Melissa BurekFounding Partner [email protected] 212-921-9354 Lauren Peek
Partner [email protected] 212-921-9374
KEY TAKEAWAYS
- The use of performance-based long-term incentives (“LTI”) continues to be the prevailing practice, constituting more than 50% of the typical LTI program for Named Executive Officers (“NEO”)
- Companies have been re-examining the mix of components in their LTI program and actively increasing performance-based awards, while de-emphasizing stock options and time-based restricted stock
- While used to a lesser extent, stock options and time-based restricted stock continue to be part of the LTI program for many NEOs
- The most prevalent metrics used in performance-based LTI plans are return measures, such as ROI, Total Shareholder Return (“TSR”) and Earnings Per Share (“EPS”)
- Many companies have decided that the use of a two-pronged approach of measuring performance results against both internal goals and relative to the external market is a best practice
Compensation Advisory Partners (“CAP”) reviewed 2014 proxy disclosures for a 100 company subset of the Fortune 500 representing a cross-section of nine industry groups. The industry groups included: Automotive, Consumer Goods, Financial Services, Health Care, Insurance, Manufacturing, Pharmaceutical, Retail, and Technology. Our research examined changes in executive compensation practices in 2013, or indicated for 2014, and observations on current trends and pay program design. This CAPflash focuses on long-term incentive plan design and notable trends including changes made in 2013 or planned for 2014.
The companies included in this study have a median revenue size and market capitalization of $32B and $52B, respectively. The median total shareholder return was 43% for 2013.
TRENDS IN LONG-TERM INCENTIVE PLAN DESIGN
51% of companies in our study made changes to the LTI plan design in 2013 or for 2014. Companies continue to reduce the emphasis on time-based restricted stock and stock options and deliver a greater portion of LTI compensation in the form of performance-based equity or cash awards. Among companies that changed their LTI mix, most companies reduced the emphasis on stock options (71%) and/or increased the emphasis on performance-based LTI (67%). 33% of companies that changed the LTI mix reduced the emphasis on time-based restricted stock.
This continued shift towards performance-based LTI compensation reflects an effort by companies to respond to shareholder feedback and align executives’ pay with performance. Target Corporation, for example, responded to a number of shareholder comments calling for a greater link between pay and performance. In 2013, Target eliminated the use of stock options (which represented 75% of total LTI in 2012) in favor of a 100% performance-based LTI program.
The overarching priority for many companies is to use LTI vehicles that best align with their business strategy and unique shareholder value proposition. For example, Aetna, Inc. replaced performance-based market share units (“MSUs”) with time-based stock appreciation rights (“SARs”) in 2014. Aetna disclosed that the longer term nature (10 years) of SARs “…supports the Company’s long-term strategic focus to drive change in the healthcare industry and to create long-term shareholder value.” Another example is Pfizer, Inc. which grants 5- and 7-year Total Shareholder Return Units (“TSRUs”). Pfizer discloses that the value executives realize from TSRUs “…is consistent with the value received by Pfizer’s shareholders.”
The table below outlines the reported changes among companies in our study:
|
Type of Change Reported in CD&A |
2013 No. of Cos. |
% of Cos. |
|
|
2013 (n = 51) |
2012 (n = 55) |
||
|
Change in mix of LTI award vehicles |
21 |
41% |
44% |
|
Change in performance plan metric |
17 |
33% |
27% |
|
Add or eliminate LTI vehicle |
10 |
20% |
36% |
|
Change in LTI award target opportunity level |
7 |
14% |
13% |
|
Change in performance plan comparison/peer group |
2 |
4% |
5% |
|
Other |
10 |
20% |
20% |
Note: Percentages add to greater than 100% due to multiple changes by certain companies.
PREVALENCE OF LONG-TERM INCENTIVE VEHICLES
Over the past three years, the prevalence of stock options has declined slightly and the use of time-based restricted stock has been relatively flat. Companies tend to grant these vehicles as a supplement to performance-based LTI.
Below is the breakdown of the percentage of companies granting each LTI vehicle to NEOs from 2011-2013:
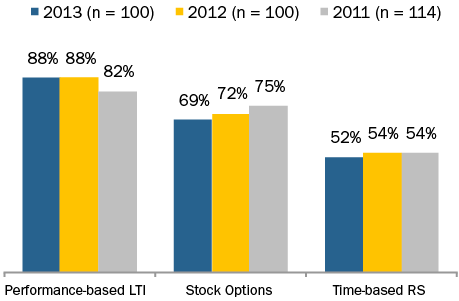
Note: Percentages add to greater than 100% because most companies grant a variety of vehicles.
Companies continue to use multiple vehicles to deliver LTI to executives. 51% of companies in our study deliver LTI in the form of two vehicles, 29% use three vehicles and 20% use only one vehicle. Among the companies that deliver LTI compensation through one vehicle, 60% grant only performance-based LTI.
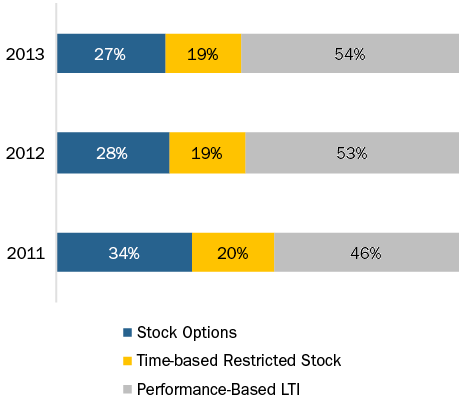
LONG-TERM AWARD MIX
The average LTI mix in 2013 is generally consistent with 2012. Performance-based LTI continues to represent more than half of the LTI mix (approximately 55% of total LTI) while stock options represent approximately 25% and time-based restricted stock represents 20%.
The chart below depicts the average LTI mix for NEOs as disclosed in the CD&A:
PERFORMANCE-BASED LTI METRICS
Companies routinely reassess their LTI plan design, including the performance metrics used, to ensure that the design reflects the company’s business strategy and objectives to attract, incentivize and retain executives. Among performance-based LTI plans, the use of a return measure increased to 49% in 2013 (up from 41% in 2011) indicating that companies are trying to encourage operational efficiency, along with profitability and growth. Among the companies that use return measures, 47% use ROI or ROIC, 37% use ROE and 16% use ROA. TSR and EPS are also prevalent long-term incentive metrics, used by 42% and 36% of companies, respectively. In our study, most companies with performance-based LTI plans use two metrics.
Companies are also more likely to use LTI metrics that reflect key measures of success in their industry. The Automotive industry frequently uses Cash Flow as a metric, focusing executives on liquidity to manage the significant cash requirements associated with the industry. In the Pharmaceutical and Technology industries, where the success of a company’s pipeline and current product offerings is reflected in their stock price, TSR is used more frequently as a metric.
Overall, 49% of companies in our study measure performance relative to the external market (typically using TSR) and 89% measure performance against pre-established goals (typically internal financial metrics). Although the use of relative TSR has increased slightly since 2011, the use of absolute internal financial metrics is most prevalent. Approximately 92% of companies that use TSR, measure performance relative to a defined comparator group (54% use a defined peer group, 40% use a broader industry index and 6% use both) while nearly 95% of companies measure financial performance against pre-established goals based on the business plan.
In recent years, companies have moved away from using only absolute or relative performance measures and instead frequently use a two-pronged approach. In 2013, 37% of companies used both absolute and relative performance measures compared with 24% in 2011. The use of both absolute and relative performance measures allows companies to evaluate performance from a balanced perspective, considering both internal and external results.
The chart below displays the prevalence of LTI metrics for performance-based awards in 2011-2013:
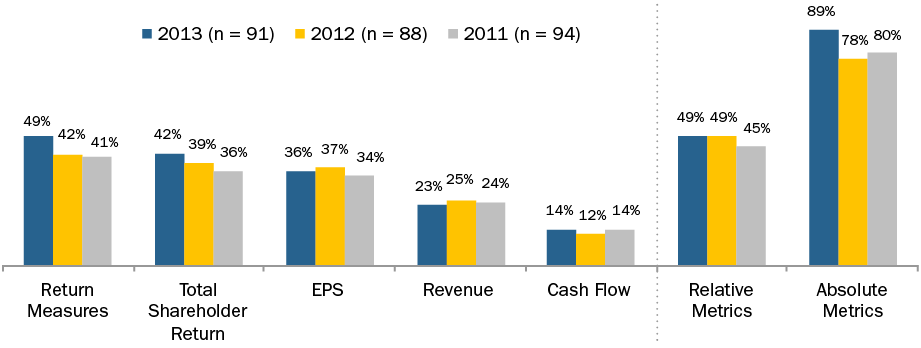
Note: Percentages add to greater than 100% due to multiple responses. Return measures reflect ROE, ROIC and ROA
CONCLUSIONS
The role played by performance-based LTI within LTI programs continues to grow. Performance-based LTI constitutes 54% of total LTI, on average, for NEOs. As performance-based LTI grows, the use of stock options and time-based restricted stock has been declining; however, these vehicles often have a role in a well-designed LTI program since stock option value depends on longer-term stock price appreciation and time-based restricted stock serves as an excellent retention vehicle.
The most commonly used metrics are return measures, such as ROI, as well as TSR and EPS. These metrics demonstrate that companies are attempting to use LTI to incentivize operational efficiency, profitability and growth. While most companies evaluate financial performance against internal goals, a growing number of companies have adopted a two-pronged approach to long-term performance measurement. These companies use internal financial goals and also incorporate a relative goal (typically TSR) to measure company performance in the context of the external market.
While most companies have already implemented changes that provide for a stronger link between executive pay and company performance, we expect to see companies continue to refine their performance-based LTI plans to support their business strategy. Additionally, we expect that setting meaningful long-term financial goals will continue to be a challenge for many companies leading some to incorporate relative performance metrics in the LTI program.