DOWNLOAD A PDF OF THIS REPORT pdf(0.1MB)
Contact
Margaret EngelFounding Partner [email protected] 212-921-9353 Lauren Peek
Partner [email protected] 212-921-9374
HIGHLIGHTS
- Companies rarely make wholesale changes to plans, but frequently revisit the performance metrics used
- Most companies use multiple measures to ensure the plan provides balance and aligns with overall business strategy
- Overall, 2013 annual incentive payouts were higher than in 2012 indicating stronger performance
Survey Sample
Compensation Advisory Partners (“CAP”) reviewed 2014 proxy disclosures at a sample of 100 companies among the Fortune 500 representing nine industry groups. Industry groups included: Automotive, Consumer Goods, Financial Services, Health Care, Insurance, Manufacturing, Pharmaceutical, Retail, and Technology. For the companies studied, the median revenue size and market capitalization was $32B and $52B, respectively. The median 2013 total shareholder return (TSR // change in stock price plus dividends) was 43%.
CHANGES IN ANNUAL INCENTIVE PLAN DESIGN
Overall, 34% of companies in CAP’s study changed their annual incentive plan design in 2013 or 2014. The most common changes were to the performance metrics used to fund awards (47% of the companies making a change) or to the weightings applicable to performance metrics (32%). Another frequent change was to increase the target award opportunities offered to Named Executive Officers; reductions in target awards were made much less frequently. These changes, as well as other modifications shown in the chart on the right, illustrate that companies continue to review and enhance the pay-for-performance relationship through changes to the annual incentive program.
|
Type of Change Reported in CD&A |
2013 No. of Cos. |
% of Cos. Reporting Changes |
||
|
2013 (n = 34) |
2012 (n = 37) |
2011 (n = 43) |
||
|
Change in performance metrics used to fund awards |
16 |
47% |
43% |
28% |
|
Change in performance metric weighting/mix |
11 |
32% |
35% |
42% |
|
Increased/Reduced target award opportunities (CEO and/or CFO) |
11 |
32% |
11% |
21% |
|
Other changes |
4 |
12% |
22% |
19% |
|
Change in maximum award payout |
3 |
9% |
8% |
12% |
Note: Due to multiple changes, does not add up to 100%.
Change in Performance Metrics
Among the companies that changed the annual incentive performance metrics, about one-half of companies modified plan metrics while maintaining the current number of metrics to better align pay with performance:
- Ten (10) companies kept the same number of metrics but replaced a metric in the incentive plan
- Four (4) companies reduced the number of metrics, and
- Two (2) companies added metrics to the current plan.
Several companies indicated that their rationale for changing annual incentive metrics was, in large part, to have a more holistic view of overall company performance and to better align incentives with their business strategy:
- AFLAC Inc: Added Operating Return On Equity (OROE) as a performance metric for senior vice presidents and above; this metric allows shareholders to evaluate AFLAC’s financial achievements relative to other organizations in terms of how effectively capital is used to generate earnings
- Danaher Corp: Added Return On Investment Capital (ROIC) in order to help validate the efficiency of earnings and complement the cash flow metric
- United Technologies Corp: Changed the earnings metric from EPS to Net Income since Net Income is not impacted by share repurchases
- Bristol-Myers Squibb: Replaced Adjusted Net Cash Flow from Operations with a metric for pipeline performance that consists of regulatory submissions and approvals and is a better indication of long-term growth potential.
Change in Target Bonus Opportunity
In 2013, median target bonus opportunities for CEOs increased (by 9 percentage points), while the opportunities for CFOs decreased (by 3 percentage points). Most notably, target bonus opportunity for CEOs in the Automotive, Insurance, and Retail industries increased by 10 percentage points year over year. However, the Technology industry experienced a significant decrease (21 percentage points) due to an increase in the base salary for Cisco’s CEO (from $375,000 to $1,100,000) and a decrease in the target opportunity for the new CEO at Intel (from 462.7% of base salary to 239.2%).
Median target bonus opportunity for CFOs in the Automotive industry experienced a decrease of 5 percentage points in 2013 largely due to the promotion of a new CFO at Goodyear (target opportunity decreased from 91% to 63% of base salary). Conversely, target bonus opportunity for CFOs in the Insurance industry increased (8 percentage points) in 2013; all other industries saw little movement to the target bonus opportunity.
|
Industry |
Median Target Bonus as a % of Salary |
|||||
|
CEO |
CFO |
|||||
|
2013 |
2012 |
2011 |
2013 |
2012 |
2011 |
|
|
Automotive |
135% |
125% |
130% |
85% |
90% |
88% |
|
Consumer Goods |
160% |
160% |
170% |
93% |
95% |
100% |
|
Financial Services |
n/m |
n/m |
n/m |
n/m |
n/m |
n/m |
|
Health Care |
150% |
145% |
145% |
100% |
101% |
100% |
|
Insurance |
210% |
200% |
200% |
133% |
125% |
120% |
|
Manufacturing |
157% |
154% |
156% |
100% |
97% |
95% |
|
Pharmaceutical |
150% |
150% |
150% |
98% |
97% |
91% |
|
Retail |
180% |
170% |
168% |
85% |
83% |
85% |
|
Technology |
210% |
231% |
200% |
130% |
131% |
121% |
|
Total Sample |
166% |
157% |
153% |
100% |
103% |
100% |
Note: Financial Services industry is excluded since most companies in our study do not disclose target bonus opportunities for the Named Executive Officers.
ANNUAL INCENTIVE PLAN DESIGN / PRACTICES
Award Leverage
Disclosure of the payout range (i.e., both threshold and maximum payout as a percentage of target) is a limited practice as most companies reviewed did not disclose a threshold level of performance required to receive a bonus payment. For the 37 companies that disclose a threshold bonus, 50% of target is the most common payout percentage. However, 20 companies disclose a minimum bonus payout of less than 50% of target; a majority of these companies provide a payout based on multiple plan metrics.
Approximately 75% of companies disclose the maximum bonus opportunity. A majority (60%) have a maximum bonus opportunity of 200% of target bonus. Ten (10) companies have a maximum bonus of 250% of target or higher. A majority of these companies are in the Consumer Goods, Pharmaceutical, and Technology industries.
|
Threshold as a % of Target (n=37) |
Maximum as a % of Target (n = 73) |
|||||
|
Range |
# of Cos. |
% of Cos. |
Range |
# of Cos. |
% of Cos. |
|
|
< 25% |
10 |
27% |
> 125% < 150% |
2 |
3% |
|
|
> 25% < 50% |
10 |
27% |
> 150% < 200% |
14 |
19% |
|
|
50% |
13 |
35% |
200% |
44 |
60% |
|
|
> 75% < 100% |
4 |
11% |
> 200% < 250% |
3 |
4% |
|
|
> 250% |
10 |
14% |
||||
Annual Incentive Plan Metrics
EPS, Revenue, Cash Flow and Operating Income are the most prevalent metrics used in annual incentive plans. Although EPS is the most common metric overall, it is the most common metric for only two industries (Financial Services and Healthcare). Revenue, the second most common metric, is the most prevalent in four industries (Consumer Goods, Pharmaceutical, Retail and Technology). Our findings suggest that EPS is used more broadly across industries while Revenue tends to be used in consumer-driven industries.
Most companies (approximately 70%) use more than one performance metric in the annual incentive plan. 25% of companies disclose using two (2) metrics in their annual incentive programs, 25% use three (3) metrics, and 21% of companies use four (4) or more metrics. Approximately 62% of these companies use a profit-based metric in combination with Revenue and/or Cash Flow.
The chart below shows the three (3) most metrics by industry in 2013:
|
Industry |
Metric #1 |
Metric #2 |
Metric #3 |
|
Automotive |
Cash Flow (45%) |
EBIT (45%) |
ROA (27%) |
|
Consumer Goods |
Revenue (67%) |
EPS (58%) |
Cash Flow (33%) |
|
Financial Services |
EPS (33%) |
ROE (17%) |
Op. Income (8%) |
|
Health Care |
EPS (40%) |
Op. Income (30%) |
EBIT (30%) |
|
Insurance |
Op. Income (46%) |
Op. ROE (23%) |
Op. EPS (15%) |
|
Manufacturing |
Cash Flow (30%) |
EPS (30%) |
Revenue (20%) |
|
Pharmaceutical |
Revenue (70%) |
EPS (70%) |
Pipeline/R&D (50%) |
|
Retail |
Revenue (40%) |
Op. Income (40%) |
EBIT (30%) |
|
Technology |
Revenue (58%) |
Cash Flow (50%) |
Op. Income (33%) |
Note: Percentages reflect the prevalence of companies disclosing the metric.
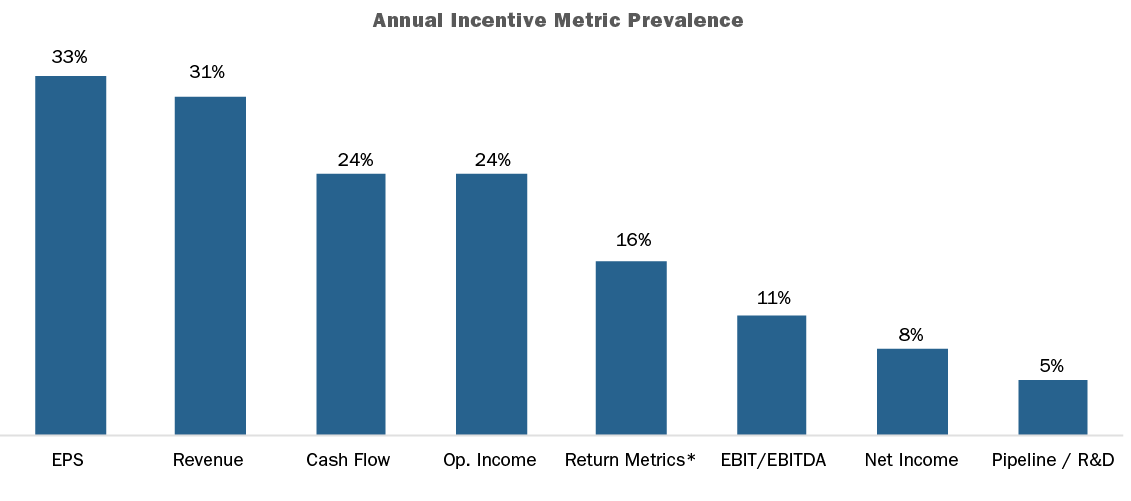
*Return metrics include: ROE, Op. ROE, ROA, and ROI/ROIC
2013 Actual Bonus Payout
Nearly all companies (98%) in our research awarded bonuses to their Named Executive Officers for 2013 performance. Overall, the median CEO bonus was 121% of target compared to 112% in 2012, indicating that 2013 performance was generally stronger than 2012. Most industries exceeded target bonus payouts by 11 – 65 percentage points. However, two industries (Retail and Technology) fell short of expectations by 22 and 12 percentage points, respectively.
Use of deferral mechanisms in the annual incentive plan is a limited practice and is more common in the Financial Services industry given regulations from the Federal Reserve. However, a few companies across industries also have a deferral policy in place. Companies typically defer annual incentive payment in the form of restricted stock/units.
|
Industry |
Actual Bonus as a % of Target Bonus – CEO |
||||||||
|
75th Percentile |
Median |
25th Percentile |
|||||||
|
2013 |
2012 |
2011 |
2013 |
2012 |
2011 |
2013 |
2012 |
2011 |
|
|
Automotive |
183% |
131% |
186% |
165% |
102% |
153% |
127% |
69% |
130% |
|
Consumer Goods |
133% |
137% |
149% |
112% |
103% |
132% |
70% |
94% |
78% |
|
Financial Services |
142% |
120% |
130% |
126% |
80% |
114% |
101% |
44% |
111% |
|
Health Care |
149% |
157% |
159% |
127% |
127% |
127% |
116% |
103% |
116% |
|
Insurance |
170% |
144% |
130% |
150% |
130% |
106% |
123% |
112% |
85% |
|
Manufacturing |
119% |
146% |
162% |
111% |
107% |
136% |
98% |
100% |
119% |
|
Pharmaceutical |
158% |
156% |
161% |
138% |
142% |
144% |
122% |
125% |
130% |
|
Retail |
119% |
136% |
147% |
78% |
117% |
129% |
68% |
79% |
112% |
|
Technology |
121% |
124% |
149% |
88% |
99% |
100% |
69% |
90% |
75% |
|
Total Sample |
151% |
144% |
156% |
121% |
112% |
133% |
96% |
93% |
105% |
Note: Most companies in the Financial Services industry does not disclose target bonus. Figures for the Financial Services industry reflects bonus as a percentage of 3-year average actual bonus.
Use of Discretion
Approximately 50% of companies in our research disclose the use of discretion in the annual incentive plan. Among these companies, approximately 40% allow only for downward adjustments of the final payout. Approximately 55% allow for both upward and downward adjustments by funding bonuses for Name Executive Officers at maximum based on a financial metric (this is unrelated to the final award allocation which may have additional performance requirements) to ensure compliance with Section162(m) of the Internal Revenue Code. This approach provides the Committee with the most flexibility in determining the bonus payout.
Conclusion
Given significant changes to the annual incentive plan design in recent years, companies rarely made wholesale changes to the overall plan design in 2013 or for 2014. Among the companies that made changes, most were focusing on refining the incentive metrics to ensure a more complete view of company performance and alignment with the overall business strategy. Despite these changes to the incentive metrics, EPS, Revenue, Cash Flow and Operating Income continue to be most common. While we would not expect to see extensive changes to the incentive plan design in the future, we anticipate that companies will continue to refine their metrics and the metric weightings as they continue to ensure executive pay is aligned with performance.