DOWNLOAD A PDF OF THIS REPORT pdf(0.1MB)
Contact
Melissa BurekFounding Partner [email protected] 212-921-9354 Kelly Malafis
Founding Partner [email protected] 212-921-9357
Key Takeaways
- Compensation Committees face intense scrutiny with respect to executive annual bonus payouts and their alignment with performance
- Over a multi-year period, executives tend to earn an annual incentive payout approximately 90% of the time
- As a general rule of thumb, based on analysis of the past 6 years, the degree of difficulty, or “stretch”, embedded in performance goals translates to:
- A 90% chance of achieving Threshold performance
- A 70% chance of achieving Target performance
- A 15% chance of achieving Maximum performance
- This pattern indicates that threshold and target performance goals are set at attainable levels, but maximum payouts commonly reflect rigorous goals and superior performance
- Annual incentive payouts have generally been aligned with financial performance over the past six years for the companies reviewed
Background
Goal setting is one of the most challenging aspects of the compensation process. Compensation Committees struggle with this critical activity and try to determine if they are “getting it right”. Goals tied to annual incentive compensation face scrutiny from both internal and external stakeholders, pressuring Committees to achieve a balance between the rigor and the attainability of their goals. Appropriate performance targets will motivate and retain executives while driving corporate performance and creating returns for shareholders.
Summary of Findings
Plan Design
Annual incentive plans can be categorized as either “Goal Attainment” plans or “Discretionary” plans. Goal attainment plans contain traditional performance and payout scales that consist of a pre-determined minimum, target and maximum level of performance and corresponding payouts. Discretionary annual incentive plans allow the Committee to determine payouts by using discretion and targets are not necessarily defined up front.
In this study, we found that 71% of the sample companies have goal attainments plans. Discretionary plans are most prevalent among Financial Services companies. Our analysis focuses on those companies with goal attainment plans.
|
Plan Type |
|||
|
Industry |
Sample Size |
Goal Attainment |
Discretionary |
|
Auto |
n= 7 |
100% |
0% |
|
Consumer Discretionary |
n= 10 |
90% |
10% |
|
Consumer Staples |
n= 11 |
91% |
9% |
|
Financial Services |
n= 12 |
17% |
83% |
|
Healthcare |
n= 10 |
100% |
0% |
|
Industrials |
n= 14 |
79% |
21% |
|
Insurance |
n= 11 |
45% |
55% |
|
IT |
n= 12 |
75% |
25% |
|
Pharma |
n= 10 |
60% |
40% |
|
Total |
n= 97 |
71% |
29% |
Performance Metrics
In most goal attainment plans, awards are earned based on corporate performance related to two or three metrics. While the metrics vary by industry, some of the most common metrics are revenue and profitability. These metrics are popular because they are indicators of financial health to the investment community. From an internal perspective, revenue and profitability are simple to understand and in the “line of sight” for most executives in that the correlation can be seen between actions/decisions and results. From an external perspective, most shareholders would support an above target payout for executives who are driving top-line growth while maintaining or expanding margins.
|
# of Metrics Used in Goal Attainment Plan |
||||
|
Industry |
1 Metric |
2 Metrics |
3 Metrics |
4+ Metrics |
|
Auto |
0% |
43% |
57% |
0% |
|
Consumer Discretionary |
33% |
22% |
45% |
0% |
|
Consumer Staples |
20% |
40% |
10% |
30% |
|
Financial Services |
0% |
50% |
50% |
0% |
|
Healthcare |
20% |
50% |
20% |
10% |
|
Industrials |
27% |
55% |
9% |
9% |
|
Insurance |
0% |
40% |
40% |
20% |
|
IT |
11% |
22% |
56% |
11% |
|
Pharma |
0% |
0% |
50% |
50% |
|
Total |
16% |
36% |
33% |
15% |
Pay and Performance Scales
At companies with goal attainment plans, Compensation Committees must annually approve minimum, target and maximum goals and corresponding payout levels, for each metric in the incentive plan. Among companies included in our research, the most prevalent payout scale awarded executives 50% of target for threshold performance and 200% of target for maximum performance. Companies most often structure payout scales so that executives will earn 100% of their target annual incentive award for target performance and the actual payout is interpolated between threshold and target and target and maximum.
Annual Incentive Plan Payouts Relative to Goals
All Companies
Based on CAP’s review of annual incentive payouts, companies achieve threshold performance goals 90% of time. Annual incentive payouts most often fall between target and maximum. Companies’ annual incentive plans pay at this level 48% of the time or approximately one out of every two years. Executives earn bonuses in the range of threshold to target about 20% of the time, roughly once in every five years. Approximately 10% of the time, companies do not achieve threshold and executives do not earn a bonus. Payouts for the total sample are distributed as indicated in the following charts:
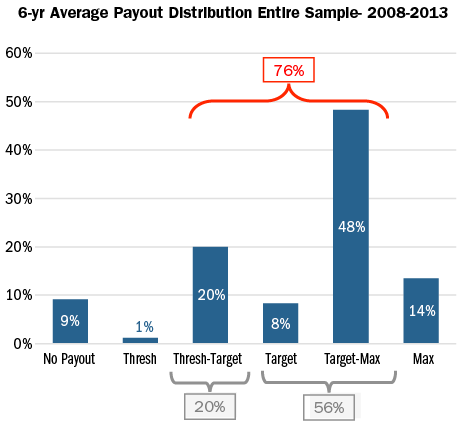
This analysis of the payout distribution is helpful in defining the degree of difficulty, or “stretch”, embedded in performance goals. Our analysis can be summarized with the following rule of thumb where Compensation Committees structure annual bonus performance goals with:
- A 90% chance of achieving Threshold performance
- A 70% chance of achieving Target performance
- A 15% chance of achieving Maximum performance
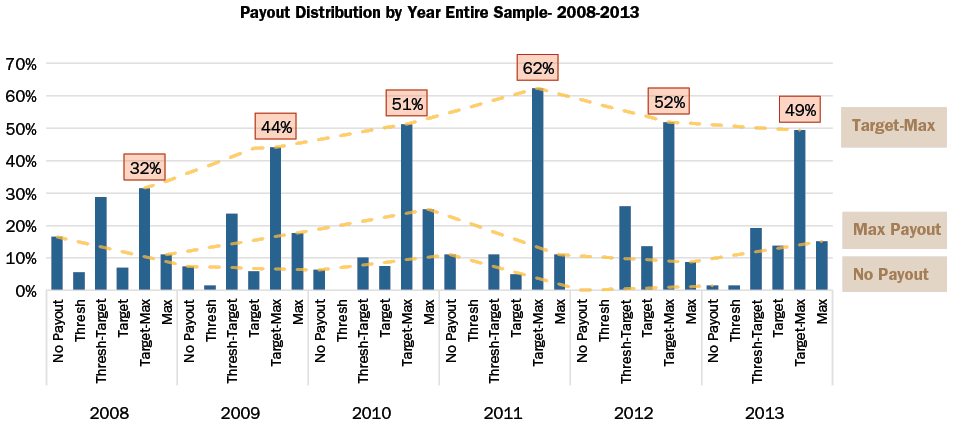
When the payout distributions are reviewed by year, the percentage of companies that paid target to maximum steadily increased from 2008-2011. This reflects an improvement in the overall economy since the financial crisis in 2008 as well as a greater ability to forecast performance in a more stable environment.
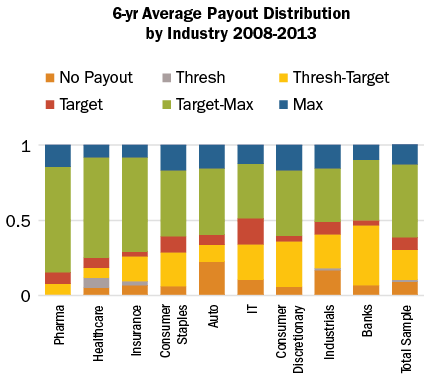
By Industry
While historical payout levels vary by industry, all industries, on average, have most frequently paid bonuses between target and maximum. The Auto and Industrials industries are notable outliers in that executives received zero payouts once in every four years and once in every five years, respectively, likely indicative of industry dynamics and macro-economic conditions more than overly rigorous goal setting. Most cases when Auto companies did not pay annual incentives occurred in 2008, the peak of the financial crisis. Average payouts for each industry are distributed as indicated in the following chart:
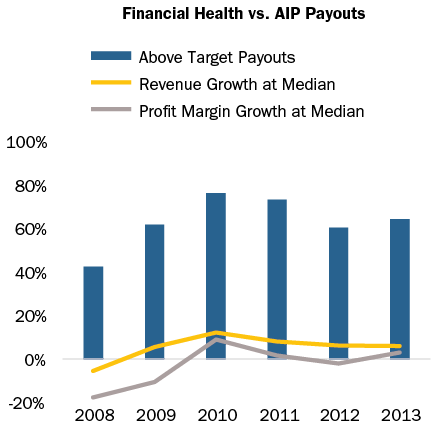
Relative to Performance
Over the past 6 years, the number of above target annual incentive payouts in a given year has generally tracked revenue growth and profit margin growth in the same year. In particular, payouts at Industrial and Pharmaceutical companies have aligned directionally with revenue and profit margin growth. This pay and performance relationship is key to aligning executives’ interests with those of shareholders. If the company exceeds anticipated performance, executives will earn above target payout levels without contest from internal or external stakeholders; however, if an executive is able to achieve extraordinary levels of pay without extraordinary performance, Committees risk facing opposition from shareholders and proxy advisory firms.
The chart below depicts the relationship between median revenue and profit margin growth and above target annual incentive payouts.
Conclusion
Threshold and target annual incentive performance goals are intended to be challenging but attainable. Maximum performance goals are meant to be attained only when executives achieve exceptional performance, exceeding internal/external expectations. Our study supports the formulation of a general rule of thumb, based on analysis of the past 6 years, where the degree of difficulty, or “stretch”, embedded in performance goals translates to:
- A 90% chance of achieving Threshold performance;
- A 70% chance of achieving Target performance; and
- A 15% chance of achieving Maximum performance.
This distribution indicates that Compensation Committees have built an appropriate degree of stretch into annual incentive plans overall.
We believe that when Committees set performance goals, they are influenced by prior year performance as well as economic and industry outlooks. Yet when measuring the directional trend over the past six years, we believe that Compensation Committees are adequately aligning internal performance goals with incentive payout objectives, and developing rational stretch above and below target — thus striking the right balance between the size and frequency of annual incentive payouts.
Methodology
Compensation Advisory Partners (“CAP”) reviewed the annual incentive plan designs of approximately 100 large companies representing a cross-section of industries. The companies included in this study have median revenues of $33 billion, a median market cap of $52 billion and a median 6-year total shareholder return of 9%, through year end 2013.
CAP analyzed the annual incentive plan payouts of the companies in the sample over the past 6 years to determine the distribution of incentive payments and the frequency with which executives typically achieve target payouts. In this analysis, CAP categorized actual bonus payments (as a percent of target) into one of six categories based on payout ranges as depicted in the following chart:
|
Payout Category |
Payout Range |
|
No Payout |
0% |
|
Threshold |
Up to 5% above Threshold |
|
Threshold – Target |
5% above Threshold to 5% below Target |
|
Target |
+/- 5% of Target |
|
Target – Max |
5% above Target to 5% below Max |
|
Max |
5% below Max to Max |