Annually, Compensation Advisory Partners (CAP) evaluates pay levels for Chief Financial Officers (CFOs) and Chief Executive Officers (CEOs). This year, the analysis is based on a sample of 100 companies with median revenues of $13 billion. For more information on criteria used to develop the sample of companies, please see Appendix.
Highlights
- Annual salary increases are increasing in prevalence for the third year in a row among CEOs and CFOs, with median increases of 2.5% and 3.9% respectively
- Similar to prior years, salary increases are provided much more frequently to CFOs than to CEOs, with over three quarters of CFOs studied receiving a salary increase in 2015
- The 2015 median increases in actual total direct compensation (i.e., cash plus equity) for both CEOs and CFOs were modest, 2.2% and 1.4% respectively
- At median, there was no growth in actual bonuses, partly reflective of a weaker performance year in 2015 vs 2014
- Median target bonus opportunities were flat for CEOs over the past 3 years; for CFOs median target bonuses were flat in 2015 after an increase from 2013 to 2014
- Growth in long-term incentive opportunities at median was in the mid-single digits for both positions
- CFO total compensation on an absolute basis approximates one-third of CEO total compensation, consistent with our findings in prior years
- Long-term incentive program structure has remained consistent over the past few years; performance-based equity continues to represent the largest component of LTI for CEOs and CFOs
Study Results
Salaries
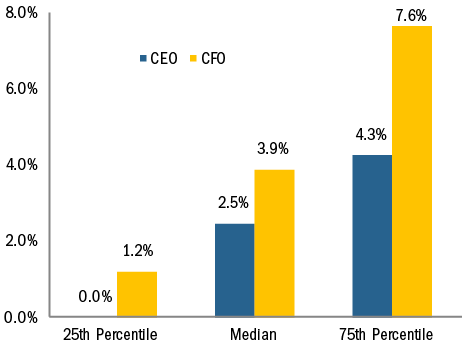
In the last three years, we have seen a steady growth in the number of CEOs and CFOs receiving salary increases in a given year. Only 48% and 69% of CEOs and CFOs, respectively, received increases for the 2012-2013 period compared with 58% of CEOs and 77% of CFOs for the 2014-2015 period. Median 2015 salary increases were 3.9% for CFOs and 2.5% for CEOs.
|
% of Executives Receiving Salary Increases |
||||
|
2013 – 2014 |
2014 – 2015 |
|||
|
No Increase |
Receiving Increase |
No Increase |
Receiving Increase |
|
|
CEO |
49% |
51% |
42% |
58% |
|
CFO |
28% |
72% |
23% |
77% |
2015 Salary Increases
Actual Pay Levels
Based on our findings, the median rate of increase in actual total direct compensation levels for both CEOs and CFOs was approximately 2% for 2015. The median increases over the last two years ranged between 3% and 5%. The lower increases in total compensation for 2014-2015 are partially a result of no increase in bonuses, at median, and only slightly higher single digit increase in long-term incentives.
|
Median Percentage Change in Pay Components |
||||
|
2013 – 2014 |
2014 – 2015 |
|||
|
Pay Components |
CEO |
CFO |
CEO |
CFO |
|
Salary |
0.3% |
3.0% |
2.5% |
3.9% |
|
Actual Bonus |
4.3% |
7.8% |
0.0% |
-0.1% |
|
Long-Term Incentives |
3.7% |
4.2% |
6.8% |
7.6% |
|
Actual Total Direct Compensation |
3.2% |
5.2% |
2.2% |
1.4% |
As seen in the table above, the median 2015 increases by pay component were similar for both CFOs and CEOs. Similar to actual bonuses, median target bonuses remained flat for both CFOs (100% of base salary) and CEOs (150% of base salary).
|
Target Bonus as % of Salary |
||||
|
2014 |
2015 |
|||
|
CEO |
CFO |
CEO |
CFO |
|
|
75th Percentile |
165% |
105% |
180% |
120% |
|
Median |
150% |
100% |
150% |
100% |
|
25th Percentile |
125% |
80% |
130% |
80% |
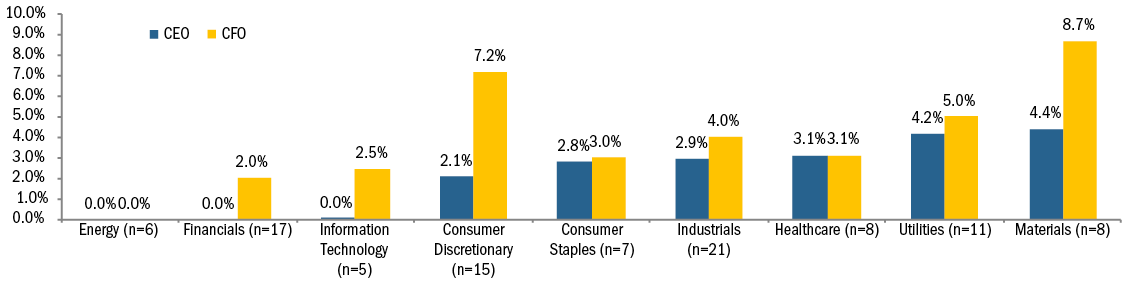
Median Salary Increase by Industry
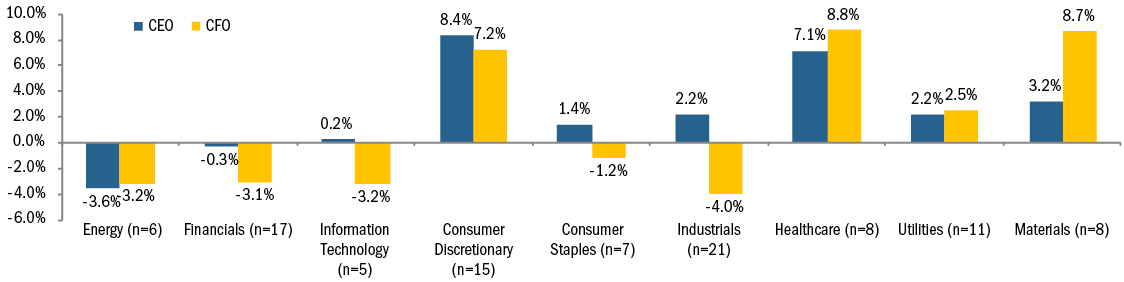
Median Actual Total Compensation Increase/Decrease by Industry
Median salary increases in salary are generally aligned for CEOs and CFOs within each specific industry, except for the Consumer Discretionary and Materials industries. Among the Consumer Discretionary industry, the median CEO increase was 2.1% compared to the CFO median increase of 7.2%. In the Materials industry, the median CEO increase was 4.4% compared to the CFO median increase of 8.7%. The Energy industry increases were 0% for both CFOs and CEOs. The salary freeze in the industry comes as no surprise given that some companies in the industry implemented salary freezes for 2015 after oil prices collapsed.
Differences by industry were more pronounced when looking at actual total direct compensation. There were more decreases in CEO or CFO total actual compensation in 2015 compared to 2014, primarily driven by weaker company performance and the annual incentive award paid as a result of performance. The Energy industry was the single industry where both CFOs and CEOs experienced similar declines in compensation, at median. Some of the largest increases in compensation levels were observed in Consumer Discretionary, Healthcare and Materials.
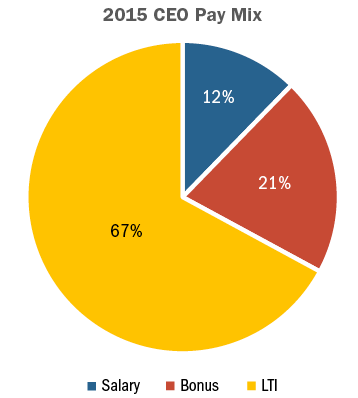
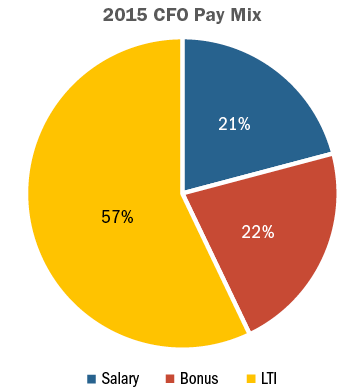
Target Pay Mix
The structure of the overall pay program (salary, bonus, LTI) has remained largely unchanged since 2011. CEOs continue to receive less in the form of salary and more in variable pay components, especially LTI, than CFOs.
Long-Term Incentive (LTI) Vehicle Prevalence and Mix
We have seen very little change in the type of vehicles used to deliver LTI awards. Overall LTI mix also remains similar to the past several years. The majority of companies continue to use two different vehicles to deliver long-term incentives to CEOs/CFOs with approximately a quarter of companies studied using all 3 equity vehicles (stock options, time-based stock awards, and awards under a performance plan)
Performance plans account for roughly 50% of LTI awards on average. The other half of LTI is delivered almost equally between stock options and time-vested restricted stock awards. The overall weighting of performance-based awards (performance plans and stock options) for both CEOs and CFOs continues to range between 75% – 80%.
|
LTI Mix |
||||
|
2014 |
2015 |
|||
|
CEO |
CFO |
CEO |
CFO |
|
|
Stock Options |
26% |
25% |
24% |
23% |
|
Time Vested Restricted Stock |
21% |
26% |
20% |
25% |
|
Performance Plans |
53% |
49% |
56% |
52% |
Conclusion
2015 was not as strong a performance year as 2014. Median revenue growth was -1% (vs 6% in 2014), net income growth was -1% (vs 9% in 2014) and total shareholder return was -2% (vs 16% in 2014). Overall total pay increases were also smaller than in 2014, which we believe were directionally aligned with performance. While salary and long-term incentive increases for CFOs were slightly higher in 2015, actual bonus amounts were flat. This pattern was similar for CEOs in the study.
We expect overall pay mix to continue to emphasize the variable, at-risk components of pay. We also expect the current approach to delivering long-term incentives, with an emphasis on performance-based LTI plans to continue. In this era of increased scrutiny and Say on Pay, we anticipate that aligning pay outcomes with company performance will continue to be an imperative for companies and Boards.
APPENDIX
Sample Screening Methodology
Based on the screening criteria below, we arrived at a sample of 100 public companies with median 2015 revenue of $13B.
|
Revenue |
At least $5B in revenue for fiscal year 2015 |
|
Fiscal year-end |
Fiscal year-end between 9/1/2015 and 1/1/2016 |
|
Proxy Statement Filing Date |
Proxy statement filed before 3/31/2016 |
|
Tenure |
No change in CEO and CFO incumbents in the past three years |