


DOWNLOAD A PDF OF THIS REPORT pdf(0.1MB)
Contact
Kelly MalafisFounding Partner [email protected] 212-921-9357 Shaun Bisman
Principal [email protected] 212-921-9365
Compensation Advisory Partners (CAP) annually analyzes the pay levels and pay mix of Chief Financial Officers (CFOs) and Chief Executive Officers (CEOs) to determine the trends in pay practices.
Last year, the study showed an increase in compensation for both CEOs and CFOs, but at much lower levels than the prior year. This leveling off of pay was partially driven by a stabilizing economy and increased confidence in goal setting, leading to less volatility in corporate performance results in incentive plans. To determine if this trend is continuing, we conducted a similar study in 2013 using a sample set of 62 US public companies. The study analyzes executive pay data disclosed by companies with revenues ranging from $1 to $145 billion, with median revenues of $9 billion. Only companies with the same CEO and CFO incumbents from 2010 to 2012 were included in order to focus on year-over-year changes for an individual incumbent. Similar to our methodology in prior years, financial services firms were excluded from the study, as this industry’s compensation practices continue to evolve in the years post the financial crisis.
Our findings, summarized below, indicate that overall, increases in total compensation levels for both CEOs and CFOs slowed in 2011-2012 compared to double-digit pay increases in the 2009-2010 period and mid-single-digit increases in the 2010-2011 period. This dramatic slowdown suggests that the halting economic recovery is having an impact. Percentage pay increases in all three years were higher for CFOs compared to CEOs, driven by slightly higher increases in long-term compensation and smaller decreases in annual bonus. The slower rate of growth in CEO compensation may be driven by the continued focus on CEO pay by shareholders and proxy advisory firms and the increased demand for pay and performance alignment. On an absolute basis, CFO pay continues to be approximately one-third of CEO pay.
Study Results
Salaries
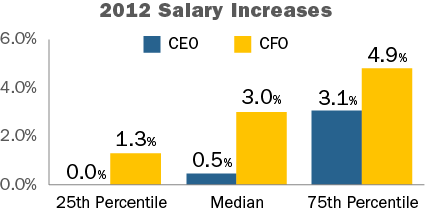
In 2012, approximately 85% of CFOs received salary increases. The median increase was 3.0% and the 75th percentile increase was 4.9%. In comparison, only 53% of CEOs received salary increases and the increases were smaller — 0.5% at median and 3.1% at the 75th percentile. The prevalence of salary increases for CFOs remained similar to last year with about 85% of incumbents receiving a salary increase. Among CEOs, approximately 55% received a salary increase, similar to 2010.
|
Salary Increase Prevalence |
||||||
|
|
2009 – 2010 |
2010 – 2011 |
2011 – 2012 |
|||
|
|
No Increase |
Increase |
No Increase |
Increase |
No Increase |
Increase |
|
CEO |
43.8% |
56.3% |
34.4% |
65.6% |
46.8% |
53.2% |
|
CFO |
25.0% |
75.0% |
12.5% |
87.5% |
14.5% |
85.5% |
Actual Pay Levels
Overall, actual total direct compensation (salary plus actual annual incentive plus the grant date value of long-term incentives) for CEOs and CFOs leveled off in 2011-2012. These lower, single-digit changes in pay levels are consistent with the increased focus on pay for performance we have seen over the last few years. They also likely reflect the slow pace of economic recovery. At the median, salary increases were higher for CFOs than CEOs in 2011-2012. Bonus levels decreased for both CEOs and CFOs and long-term incentives increased modestly (2%) for CFOs and remained flat (0%) for CEOs.
|
Median Percentage Change in Pay Components |
||||||
|
|
2009 – 2010 |
2010 – 2011 |
2011 – 2012 |
|||
|
Pay Components |
CEO |
CFO |
CEO |
CFO |
CEO |
CFO |
|
Salary |
1.0% |
3.7% |
1.8% |
3.5% |
0.5% |
3.0% |
|
Actual Bonus |
19.0% |
22.7% |
0.0% |
3.5% |
-2.8% |
-1.2% |
|
Long-Term Incentives |
10.1% |
14.8% |
10.0% |
10.3% |
0.0% |
2.0% |
|
Actual Total Direct Comp. |
14.4% |
20.0% |
3.6% |
7.5% |
-0.3% |
1.4% |
|
Financial Performance (Median Levels) |
|||
|
Year |
Total Shareholder Return (as of 12/31) |
1-Year Revenue Growth |
1-Year Net Income Growth |
|
2010 |
24% |
10% |
19% |
|
2011 |
5% |
9% |
13% |
|
2012 |
14% |
3% |
2% |
While movement in pay among CFOs and CEOs was directionally aligned, absolute CFO total direct compensation levels, on average, have been approximately 30% of CEO total direct compensation levels over the last three years.
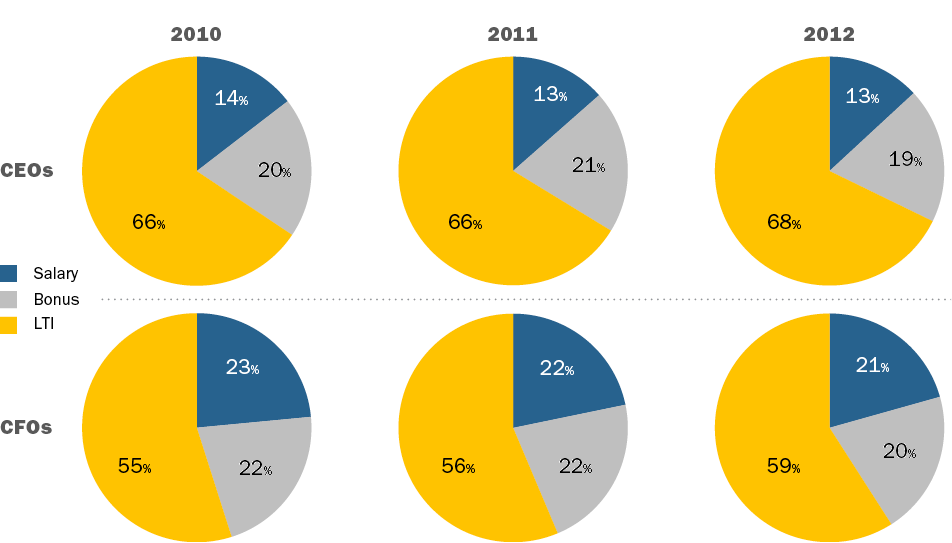
Target Pay Mix
In terms of target compensation levels, the overall pay mix remained largely unchanged from 2010 to 2012, with a greater emphasis on at-risk pay for CEOs than for CFOs.
Long-Term Incentive (LTI) Vehicle Prevalence and Mix
The use of at least two long-term incentive vehicles continues to be the majority practice when awarding LTI to CEOs and CFOs. The role of stock options has remained steady in the overall mix with companies delivering about 30% of LTI using this vehicle. On average, performance-based LTI continues to comprise approximately 50% of LTI for CEOs and CFOs. Data shows that 80% of CFOs and 85% of CEOs received some form of performance-based awards as part of their LTI program in 2012.
|
Number of LTI Vehicles Used in 2012 |
||
|
|
% in Total |
|
|
CEO |
CFO |
|
|
1 |
24% |
17% |
|
2 |
47% |
53% |
|
3 |
27% |
28% |
|
Average |
2 |
2 |
|
LTI Mix |
||||||
|
2010 |
2011 |
2012 |
||||
|
Vehicle |
CEO |
CFO |
CEO |
CFO |
CEO |
CFO |
|
Stock Options |
33% |
30% |
32% |
32% |
30% |
32% |
|
Time Vested Restricted Stock |
20% |
23% |
17% |
22% |
16% |
20% |
|
Perf. Based LTI |
48% |
47% |
51% |
46% |
53% |
48% |
Conclusion
As companies and Boards focus on the alignment between pay and performance, and the economic recovery continues at a slow pace, it is not surprising that pay increases have slowed over the last 3 years. The rates of increases continue to be for higher CFOs compared to CEOs; however, the increases for both have slowed dramatically in 2011-2012. We expect future changes in compensation for these positions to continue to be closely linked to overall company performance, as well stock price performance, since the majority of pay for CEOs and CFOs is delivered through long-term incentives.


