Research provided by Han Wen Zhang.
Effective November 9, 2020, the Securities Exchange Commission (SEC) issued final rules that modernized the requirements of Regulation S-K applicable to disclosure of the description of the business (Item 101), legal proceedings (Item 103) and risk factors (Item 105). The new rules require companies to greatly expand their human capital management disclosure using a principles-based approach. Relatively few aspects of the rules are prescriptive, giving companies wide latitude to tailor disclosure. Given this latitude, we anticipate that companies will struggle when deciding what human capital disclosure should be included in their 10-Ks. CAP has reviewed early disclosures to provide some guidance to calendar year end companies on the topics that early human capital disclosures address and how much detail companies have typically provided.
Compensation Advisory Partners (CAP) provides a summary of the amendments of Regulation S-K related to human capital disclosure below. We also reviewed a sample of human capital disclosures made by early filers with fiscal years ending before December 31, 2020. Insights gleaned from our review will be helpful to calendar year companies who will soon be crafting their own human capital disclosure for the first time early in 2021.
Summary of Revisions to Item 101(c)(2)(ii)
The final rules amend Item 101(c) (Description of Business) to include a description of a registrant’s human capital resources to the extent the disclosure is material to an understanding of the business as a whole, except that, if the information is material to a particular reportable segment, that segment should be identified. The SEC also describes its rationale for the principles-based approach it advocates which may be helpful to registrants as they expand their description of their businesses to cover the human capital disclosure. The final rules are designed to provide investors with information on material aspects of a business’ operations, financial condition and prospects that reflect how management and the board of directors manage the business and assess its performance.
Amended Text of Item 101(c)(2)(ii):
Provide “A description of the registrant’s human capital resources, including the number of persons employed by the registrant, and any human capital measures or objectives that the registrant focuses on in managing the business (such as, depending on the nature of the registrant’s business and workforce, measures or objectives that address the development, attraction and retention of personnel).
Prior to this amendment, required disclosure related to human capital was limited to the registrant’s number of employees. Clearly, a broad mandate to disclose material measures or objectives related to human capital and used to manage the business substantially raises the bar for corporate disclosure.
The new rules are also creating some concern and confusion for companies trying to comply with the amendments for the first time. For example, the SEC declined to define human capital management, instead taking the position that it was likely to evolve over time. In addition, input received during the public comment period prior to the release of the final rules makes it clear that companies are concerned that potential metrics are not standardized or defined in any way, making comparative assessments very difficult.
What We Are Seeing
To date, only a limited number of well-known companies have issued human capital disclosure. Nevertheless, certain trends are developing. To date, examples of more robust disclosure are running to 1,000 — 1,500 words. Wells Fargo is among the leaders with voluntary disclosure provided in its proxy statement prior to the implementation of final rules of almost 6,800 words. Less detailed disclosure is provided by other companies, usually in about 300 — 500 words.
One company offered limited information on the number of employees in only 63 words. We can only conclude that they believe that the human capital metrics and objectives used in their business are not material to their business results.
Most companies publish their human capital disclosure in the Description of the Business found at the beginning of 10-Ks. A few companies — QUALCOMM and Visa, for example — provide a few paragraphs on human capital in the 10-K and refer the reader to a much longer discussion in their proxy statement or documents posted to company websites
Popular topics commonly addressed include:
- Facts about the make-up of the work force, including total number of employees, number or percentage in each major geography, breakdowns by type of employee, including full-time, part-time and seasonal, as well as management, administrative, engineering, skilled trades and hourly workers whether union or non-union;
- A statement of company culture and identification of core values;
- Description of governance and oversight of human capital initiatives by the board of directors, senior management and, in some cases, various councils or advisory groups composed of employees;
- Initiatives and statistics relating to diversity and inclusion;
- An overview of total rewards, with greater emphasis on all-employee programs, such as retirement and welfare benefits or a commitment to living wages;
- Discussion of talent development and training;
- Recruiting and retention practices;
- Use of employee engagement surveys;
- Pay equity; and
- Health and safety initiatives and metrics.
Note that the companies that we reviewed generally do not address all of these topics. Instead, most companies chose the 3 to 6 topics from this menu that they see as most relevant to their industry and business strategy. Quite clearly, human capital management disclosure will be highly individualized and it will be difficult — if not impossible — to make comparisons between companies, even direct competitors operating in the same space.
CAP’s Assessment
As a review of the examples provided above makes clear, most disclosures to date depend heavily on a qualitative description of core values, programs and practices. Very few companies are disclosing actual objectives and/or metrics used to manage the business. Examples of specific metrics or objectives are limited to the following among the companies reviewed here:
- Tyson Foods discloses that increasing its employee retention rate is a goal but does not disclose numerical objectives. Actual results (i.e., a 1% increase) are disclosed. (See “Diversity and Inclusion”)
- Visa stands out by disclosing that it recently established goals to increase the number of employees from underrepresented groups at the vice president level and above in the U.S. by 50 percent in three years and to increase the number of employees from underrepresented groups in the U.S. by 50 percent in five years. (See “Diversity and Inclusion”)
- Wells Fargo discloses the adjusted pay gap between (1) women and men and (2) people of color and their white peers (both are more than 99 cents for every $1) and reports that the unadjusted pay gap is higher than the company would like them to be. (See “Annual Pay Equity Review”)
- Both Broadcom and QUALCOMM reported metrics on voluntary attrition that were lower than a technology industry benchmark survey published by Aon. (See “Talent Development”)
- Jacobs Engineering and Tyson Foods both reported their recordable incident rates, citing OSHA benchmarks. Tyson Foods further disclosed a goal of a 10% annual reduction in recordable incidents. (See “Health and Safety”)
- TE Connectivity lists key talent metrics but provides no data. (See “Other”)
Surprisingly, we did not see companies disclose productivity metrics — for example, revenue per employee, growth in sales relative to growth in compensation costs, or compensation costs as a percentage of revenue.
We think this indicates that human capital management will change over time. Consulting firms, data analytics shops and government will publish more information on benchmarks. Human capital metrics will become more standardized. This will allow for more robust disclosure as companies try to find better measurements of the ROI on human capital and link it to financial metrics important to shareholders and the investment community at large.
* * * * * *
Below we provide some examples of disclosure that we found particularly effective in communicating human capital priorities.
Employees
Example 1: QUALCOMM (10-K dated November 2020)
“At September 27, 2020, we had approximately 41,000 full-time, part-time and temporary employees, the overwhelming majority of which were full-time employees. During fiscal 2020, the number of employees increased by approximately 4,000, primarily due to increases in engineering resources. Our employees are represented by more than 100 self-identified nationalities working in over 150 locations in 32 different countries around the world. Collectively, we speak more than 60 different languages.”
Example 2: Rockwell Automation (10-K dated November 2020)

Example 3: Starbucks (10-K dated November 2020)
“As of September 27, 2020, Starbucks employed approximately 349,000 people worldwide. In the U.S., Starbucks employed approximately 228,000 people, with approximately 220,000 in company-operated stores and the remainder in corporate support, store development, roasting, manufacturing, warehousing and distribution operations. Approximately 121,000 employees were employed outside of the U.S., with approximately 118,000 in company-operated stores and the remainder in regional support operations. The number of Starbucks partners represented by unions is not significant. We believe our efforts in managing our workforce have been effective, evidenced by a strong Starbucks culture and a good relationship between the company and our partners.”
Example 4: Tyson Foods (10-K dated November 2020)
“As of October 3, 2020, we employed approximately 139,000 team members. Approximately 120,000 team members were employed in the United States, of which approximately 114,000 were employed at production facilities, and approximately 19,000 team members were employed in foreign countries, primarily in Thailand and China. Approximately 31,000 team members in the United States were subject to collective bargaining agreements with various labor unions, with approximately 37% of those team members at locations either under negotiation for contract renewal or included under agreements expiring in fiscal 2021. The remaining agreements expire over the next several years. Approximately 5,000 team members in foreign countries were subject to collective bargaining agreements. We believe our overall relations with our workforce are good.”
Company Culture and Core Values
Example 5: Applied Materials (10-K dated December 2020)
“Applied’s commitment to innovation begins with the commitment to creating an environment in which Applied’s employees can do their best work…To achieve this level of value creation, Applied believes it must find, develop and keep a world-class global workforce. The Company invests in its employees by providing quality training and learning opportunities; promoting inclusion and diversity; and upholding a high standard of ethics and respect for human rights.”
Example 6: Jacobs Engineering (10-K dated November 2020)
“At Jacobs, our people are the heart of our business. With our culture of caring and inclusion as our foundation, we celebrate the differences that drive our collective strength and encourage our employees that there is no limit to who they can be and what we can achieve. Together we deliver extraordinary solutions for a better tomorrow and live by our employee value statement: Jacobs. A world where you can.”
Example 7: TE Connectivity (10-K dated November 2020)
“Our employees are responsible for upholding our purpose—to create a safer, sustainable, productive, and connected future; our values—integrity, accountability, teamwork, and innovation; and our strategy, execution, and talent (“SET”) leadership expectations…We embrace diversity and inclusion. A truly innovative workforce needs to be diverse and leverage the skills and perspectives of a wealth of backgrounds and experiences. To attract a global workforce, we strive to embed a culture where employees can bring their whole selves to work.”
Governance and Oversight
Example 8: Starbucks (10-K dated November 2020)
“We recognize the diversity of customers, partners and communities, and believe in creating an inclusive and equitable environment that represents a broad spectrum of backgrounds and cultures. Working under these principles, our Partner Resources Organization is tasked with managing employment-related matters, including recruiting and hiring, onboarding and training, compensation planning, performance management and professional development. Our Board of Directors and Board committees provide oversight on certain human capital matters, including our Inclusion and Diversity programs and initiatives. As noted in its charter, our Compensation and Management Development Committee is responsible for periodically reviewing Starbucks partner resource programs and initiatives, including healthcare and other benefits, as well as our management development and succession planning practices and strategies. Our Audit and Compliance Committee works closely with the Risk Management Committee, led by Starbucks cfo and general counsel, to monitor current and emerging labor and human capital management risks and to mitigate exposure to those risks. Furthermore, our Nominating and Corporate Governance Committee annually evaluates the effectiveness of our social responsibility policies, goals and programs, which also include partner-related issues. These reports and recommendations to the Board and its committees are part of the broader framework that guides how Starbucks should attract, retain and develop a workforce that aligns with our values and strategies.”
Diversity and Inclusion
Example 9: QUALCOMM (10-K dated November 2020)
“We believe that a diverse workforce is critical to our success, and we continue to focus on the hiring, retention and advancement of women and underrepresented populations. Our recent efforts have been focused in three areas: inspiring innovation through an inclusive and diverse culture; expanding our efforts to recruit and hire world-class diverse talent; and identifying strategic partners to accelerate our inclusion and diversity programs.
We have a number of employee networks that enhance our inclusive and diverse culture, including those supporting Women, Africans and African Americans, Latinos, Veterans, the LGBTQ+ community and employees with disabilities.
We continue to recruit technical talent in diverse communities, including by engaging as a high-level sponsor of professional conferences, such as the Grace Hopper Celebration, the Society of Hispanic Professional Engineers National Convention and the National Society of Black Engineers National Convention. We also continue to recruit from a variety of colleges including Hispanic-Serving Institutions, Historically Black Colleges and Universities and Women’s Colleges.
Our continued engagement with organizations that work with diverse communities has been vital to our efforts to increase women and minority representation in our workforce. For example, we partner with AnitaB.org to benchmark our progress and identify promising practices for recruiting, retaining and advancing women technologists and support its research initiatives related to attracting and retaining women and underrepresented minority students in computing majors. We, alongside other top technology companies, helped form the Reboot Representation Tech Coalition, which aims to double the number of Black, Latinx and Native American women receiving computing degrees by 2025. In collaboration with the National Foundation for Autism Research, we started an internship program to welcome those with autism into our Company. Through our collaboration with Disability:IN’s Inclusion Works program, we have increased our ability to address the needs of individuals with disabilities.
In an effort to provide additional transparency into our efforts to increase underrepresented populations in our workforce, we intend to disclose our 2020 Consolidated EEO-1 Report after our submission of the report to the U.S. Equal Employment Opportunity Commission.”
Example 10: Rockwell Automation (10-K dated November 2020)
Example 11: TE Connectivity (10-K dated November 2020)
“Our employee resource groups (“ERGs”) are company-sponsored groups of employees that support and promote certain mutual objectives of both the employees and the company, including inclusion and diversity and the professional development of employees. The ERGs provide a space where employees can foster connections and develop in a supportive environment. As of fiscal year end 2020, we had six ERGs—ALIGN (LGBTQ), Women in Networking, TE Young Professionals, African Heritage, TE Veterans, and Asian Heritage. We are focused on recruitment of diverse candidates and on internal talent development of our diverse leaders so that they can advance their careers and move into leadership positions within the company.”
Example 12: Tyson Foods (10-K dated November 2020)
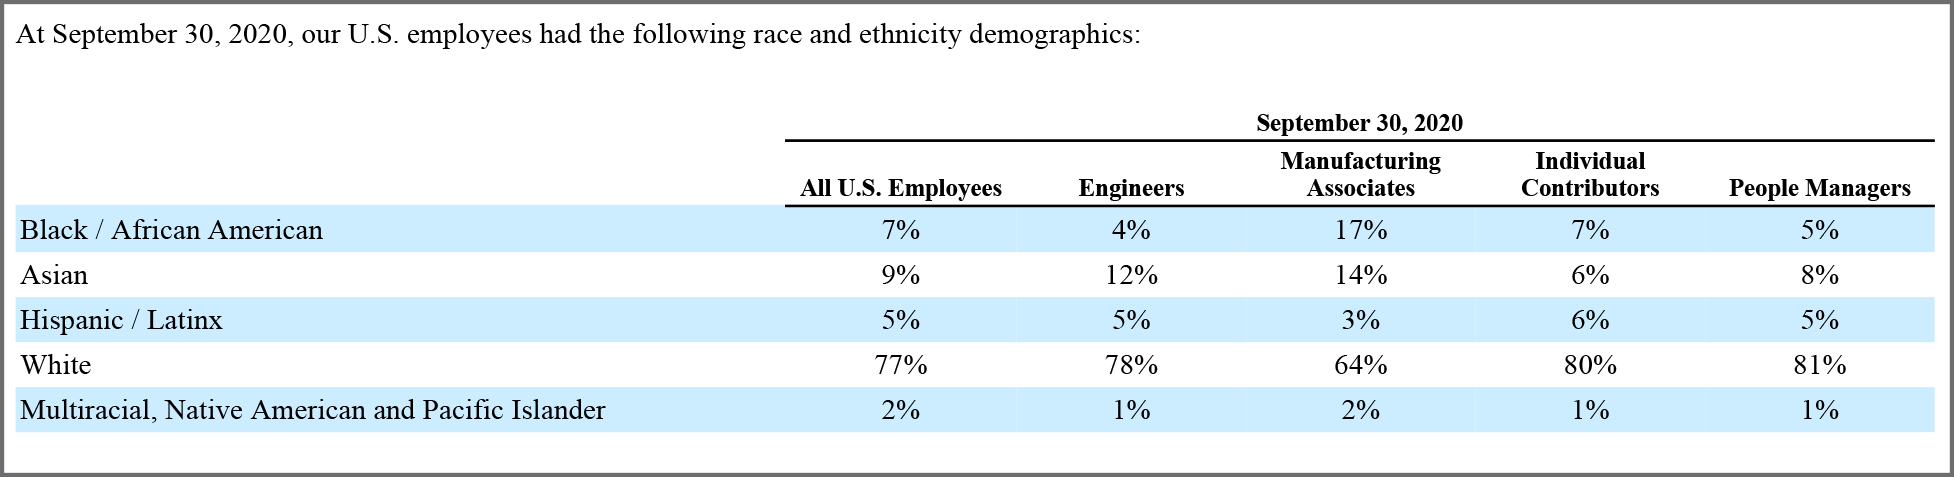
“We have a goal to build a highly engaged team by increasing retention year over year. For fiscal 2020, our domestic workforce realized a 1% increase in retention rate from fiscal 2019. As of October 3, 2020, our domestic workforce was approximately 40% gender diverse, and of our domestic team members, our workforce was approximately 33% white, approximately 27% Hispanic or Latino, approximately 25% Black or African American, and approximately 11% Asian American.”
Example 13: Visa (10-K dated November 2020)
“Our culture is underpinned by our core values, including an unwavering commitment to inclusion and diversity. In 2020, we established goals to increase the number of employees from underrepresented groups at the vice president level and above in the U.S. by 50 percent in three years and to increase the number of employees from underrepresented groups in the U.S. by 50 percent in five years. Visa’s commitment to diversity recruiting includes partnering with a number of non-profit and community organizations to support and develop a diverse talent pipeline. For example, Visa established the Black Scholars and Job program, a $10 million fund to create a dedicated Visa scholarship assistance program over the next five years, specifically for college-bound Black students. Upon graduation, all recipients who have met their commitments will be guaranteed a full-time job with Visa. Visa is committed to pay equity, regardless of gender or race/ethnicity, and conducts pay equity analyses on an annual basis.”
Example 14: Wells Fargo (Proxy dated March 2020)

* Data based on Wells Fargo’s 4Q 2019 Diversity & Inclusion Scorecard
Employee Engagement
Example 15: Applied Materials (10-K dated December 2020)
“Applied manages and measures organizational health with a view to gaining insight into employees’ experiences, levels of workplace satisfaction, and feelings of engagement and inclusion with the company. The Company uses McKinsey & Company’s Organizational Health Index (OHI) and employee engagement pulse surveys to measure its organizational health and employee experiences. In fiscal 2019, Applied achieved an overall “healthy” rating on the OHI and continued to rank in the top quartile for overall health in the McKinsey database. Insights from the Company’s OHI survey are used to develop both company-wide and business unit level organizational and talent development plans.”
Total Rewards
Example 16: Agilent Technologies (10-K dated December 2020)
“We believe that our future success largely depends upon our continued ability to attract and retain highly skilled employees. We provide our employees with competitive salaries and bonuses, opportunities for equity ownership, development programs that enable continued learning and growth and a robust employment package that promotes well-being across all aspects of their lives, including health care, retirement planning and paid time off.”
Example 17: QUALCOMM (10-K dated November 2020)
“We provide robust compensation and benefits programs to help meet the needs of our employees. In addition to salaries, these programs (which vary by country/region) include annual bonuses, stock awards, an Employee Stock Purchase Plan, a 401(k) Plan, healthcare and insurance benefits, health savings and flexible spending accounts, paid time off, family leave, family care resources, flexible work schedules, adoption and surrogacy assistance, employee assistance programs, tuition assistance and on-site services, such as health centers and fitness centers, among many others. In addition to our broadbased equity award programs, we have used targeted equity-based grants with vesting conditions to facilitate retention of personnel, particularly those with critical engineering skills and experience.”
Example 18: Starbucks (10-K dated November 2020)
“We have demonstrated a history of investing in our workforce by offering competitive salaries and wages. To foster a stronger sense of ownership and align the interests of partners with shareholders, restricted stock units are provided to eligible non-executive partners under our broad-based stock incentive programs. Furthermore, we offer comprehensive, locally relevant and innovative benefits to all eligible partners. In the U.S., our largest and most mature market, these include, among other benefits:
- Comprehensive health insurance coverage is offered to partners working an average of 20 hours or more each week.
- 100% tuition coverage is provided to partners who earn a bachelor’s degree online at Arizona State University through the Starbucks College Achievement Program.
- Parental leaves are provided to all new parents for birth, adoption or foster placement.
- A Partner and Family Sick Time program is provided and allows partners to accrue paid sick time based on hours worked and use that time for themselves or family members in need of care.
- Care@Work benefit provides partners with subsidized child, adult or senior care planning services. This benefit includes up to 20 days of subsidized backup care services through the end of fiscal 2021,…
Outside of the U.S., we have provided other innovative benefits to help address market-specific needs, such as providing interest-free loans to our U.K. partners to help cover rental deposits, mental health services in Canada, and in China, a monthly housing subsidy for full-time Starbucks baristas and shift supervisors , as well as comprehensive health insurance coverage for parents of partners.”
Talent Development
Example 19: Agilent Technologies (10-K dated December 2020)
“As part of our promotion and retention efforts, we also invest in ongoing leadership development through programs such as our Emerging Leader Program, our Managing at Agilent programs and our experienced managers’ Accelerate program.”
Example 20: Applied Materials (10-K dated December 2020)
“Applied believes continuous learning by its people feeds the Company’s pipeline of innovation and pays off in employee retention. Applied’s business units maintain an independent strategy for skill-building, using content that is owned, supervised, developed, and managed by each unit’s learning team. At the same time, these skill-building programs are aligned around a common set of objectives and framework focused on compliance, technical, professional and management development. There is an expectation that every employee has a development goal as a part of individual performance objectives. Historically more than 85% of employees have had development objectives.”
Example 21: Broadcom (10-K dated December 2020)
“As the source of our technological and product innovations, our engineering and technical personnel are a significant asset. Competition for these employees is significant in many areas of the world in which we operate, particularly in Silicon Valley and Southeast Asia where qualified engineers are in high demand. We track and report internally on key talent metrics including the portion of our workforce in research and development and the voluntary attrition rate. During fiscal year 2020, our voluntary attrition rate was 7%, below the technology industry benchmark (AON, 2020 Salary Increase and Turnover Study — Second Edition, September 2020).”
Example 22: QUALCOMM (10-K dated November 2020)
“Our global workforce is highly educated, with the substantial majority of our employees working in engineering or technical roles (many of whom help develop foundational technologies for both our QCT semiconductor business and our QTL licensing business). During fiscal 2020, our voluntary turnover rate was less than 5%, below the technology industry benchmark, which is comprised of certain of our key competitors (Aon, 2020 Salary Increase and Turnover Study — Second Edition, September 2020).”
Health and Safety
Example 23: Jacobs Engineering (10-K dated November 2020)
“BeyondZero® is our approach to the health, safety and security of our people, the protection of the environment and the resilience of Jacobs. In fiscal 2020, we continued to demonstrate safety excellence with another year of zero employee fatalities at work, a 25% reduction in employee recordable incidents from fiscal 2019, and a total recordable incident rate of 0.17 (recorded in accordance with OSHA record keeping requirements) as of October 2, 2020 — compared to the North American Industry Classification System’s most recently reported aggregate rate of 0.60.
While our BeyondZero journey started with safety, as we continued to drive our injury rates down, we also expanded our thinking to our broader culture of caring and particularly mental health. It was this strong foundation that helped us act swiftly at the start of the COVID-19 pandemic. The foundation elements of our existing “Mental Health Matters” program enabled us to respond quickly to launch our “Mental Health Matters Resiliency” program and to promote our suicide awareness campaign in fiscal 2020.
In fiscal 2020, almost 2,000 Positive Mental Health Champions (an 11% increase from fiscal 2019) trained to support the mental wellbeing of our employees and one in every 29 employees trained as a Positive Mental Health Champion. In addition, 100% of Jacobs’ Executive Leadership Team participated in Positive Mental Health training.”
Example 24: QUALCOMM (10-K dated November 2020)
“The success of our business is fundamentally connected to the well-being of our people. Accordingly, we are committed to the health, safety and wellness of our employees. We provide our employees and their families with access to a variety of innovative, flexible and convenient health and wellness programs, including benefits that provide protection and security so they can have peace of mind concerning events that may require time away from work or that impact their financial well-being; that support their physical and mental health by providing tools and resources to help them improve or maintain their health status and encourage engagement in healthy behaviors; and that offer choice where possible so they can customize their benefits to meet their needs and the needs of their families. In response to the COVID-19 pandemic, we implemented significant changes that we determined were in the best interest of our employees, as well as the communities in which we operate, and which comply with government regulations. This includes having the vast majority of our employees work from home, while implementing additional safety measures for employees continuing critical on-site work.”
Example 25: Starbucks (10-K dated November 2020)
“We view mental health as a fundamental part of our humanity and implemented a comprehensive suite of related” programs and benefits in fiscal 2020. These include Headspace, an online application that enables guided mediation, Lyra, which provides mental health coaching, and Starbucks Mental Health Fundamental Training, created in partnership with National Council for Behavioral Health, which offers ongoing training to help partners recognize and respond to signs of mental health and substance use issues.”
Example 26: Tyson Foods (10-K dated November 2020)
“We maintain a safety culture grounded on the premise of eliminating workplace incidents, risks and hazards. We have created and implemented processes to help eliminate safety events by reducing their frequency and severity. We also review and monitor our performance closely. Our goal is to reduce Occupational Safety and Health Administration (“OSHA”) recordable incidents by 10% year over year. During fiscal 2020, our recordable incident rate declined 17% compared to fiscal 2019. In response to the global novel coronavirus pandemic (“COVID-19” or “pandemic”), we have implemented and continue to implement safety measures in all our facilities. As an expansion of our We Care workplace safety program and continued efforts to boost the overall health and wellness of our workforce, we are piloting health clinics near our production facilities, giving team members and their families easier access to high-quality healthcare.”
Other
Example 27: QUALCOMM (10-K dated November 2020)
“We encourage you to review the “Our People” section of our March 2020 Corporate Responsibility Report (located on our website) for more detailed information regarding our Human Capital programs and initiatives. Nothing on our website, including our Corporate Responsibility Report or sections thereof, shall be deemed incorporated by reference into this Annual Report.”
Example 28: TE Connectivity (10-K dated November 2020)
“We track and report internally on key talent metrics including workforce demographics, critical role pipeline data, diversity data, and engagement and inclusion indices.”
2020 was a particularly robust year for initial public offerings (IPOs) and special purpose acquisition companies (SPACs). Many companies took advantage of favorable capital markets, and we saw much-anticipated IPOs such as Snowflake, DoorDash and Airbnb hit the public markets in 2020. Founders, employees, and investors unlocked significant value in these IPO events.
CAP’s review of technology company equity practices around IPO reveals several emerging compensation trends: a shift in equity award vehicles from stock options to restricted stock units (RSUs), increased use of double-trigger vesting for restricted stock, and large, company-friendly equity authorizations. Additionally, some companies implemented noteworthy founder compensation practices.
Pre-IPO Equity Grant Practices
CAP reviewed a sample of 20 high-profile, technology companies with IPOs in recent years to understand their equity practices leading up to the IPO.
List of companies:
| Airbnb | Fitbit | Palantir | Slack | Square |
| Asana | GoPro | Peloton | Snap | Uber |
| DoorDash | Grubhub | Snowflake | Unity Software | |
| Dropbox | Lyft | Roku | Sonos | Zoom Video |
Options are still predominant. For companies anticipating growth, options continue to be the favored equity award for a variety of reasons. For employees, there is no tax burden at vest, and the employee has control over the settlement of the award and associated taxation. If incentive stock options (“ISOs”) are used, the employee receives capital gains treatment upon disposition of shares, assuming the required holding period is met. Options are also favorable from the shareholder (often financial sponsors) perspective. Options align the interests of employees with their shareholders, as no award value is realized unless the company value appreciates. Typically, stock options are granted at-hire and allow employees to share in the value of the company as it grows and matures.
Increased use of RSUs with unique features. Some companies (such as Lyft, Uber, and Dropbox) shifted to granting more RSUs in the years leading up to IPO. In these cases, RSUs have double-trigger vesting, which requires both time-based service (typically four years) and event-based requirements (typically a qualifying capital event such as an IPO) be satisfied in order for the RSUs to vest.
Companies naturally shift from granting options to RSUs as they grow and mature. Reasons for this include changes in a company’s growth expectations post-IPO, the need to conserve shares, and a desire for differentiated equity grant programs as companies grow in size and complexity. However, as seen with recent IPOs, favoring RSUs could be attributed to the fact that award values are easier to understand and are somewhat protected, even if company valuations fluctuate between funding rounds. Companies also benefit, from an accounting perspective, with vesting being dependent on a qualifying capital event as no accounting charge is incurred until such event takes place.
Adopting double-trigger RSUs has potential downsides, though. These include mounting pressure to go public (as evidenced by media coverage of the long-delayed IPO of Airbnb), and a significant tax burden for employees whose equity vests upon IPO. Employees are exposed to the financial risk of being taxed on stock compensation that has since declined in value since IPO. Also, when employees leave the company before the IPO event, their unvested shares are forfeited. This may pose an issue for recruitment unless the IPO timeline is clear. For the company, event-based vesting triggers a major accounting expense, and the large number of shares being sold may temporarily impact the company’s share price.
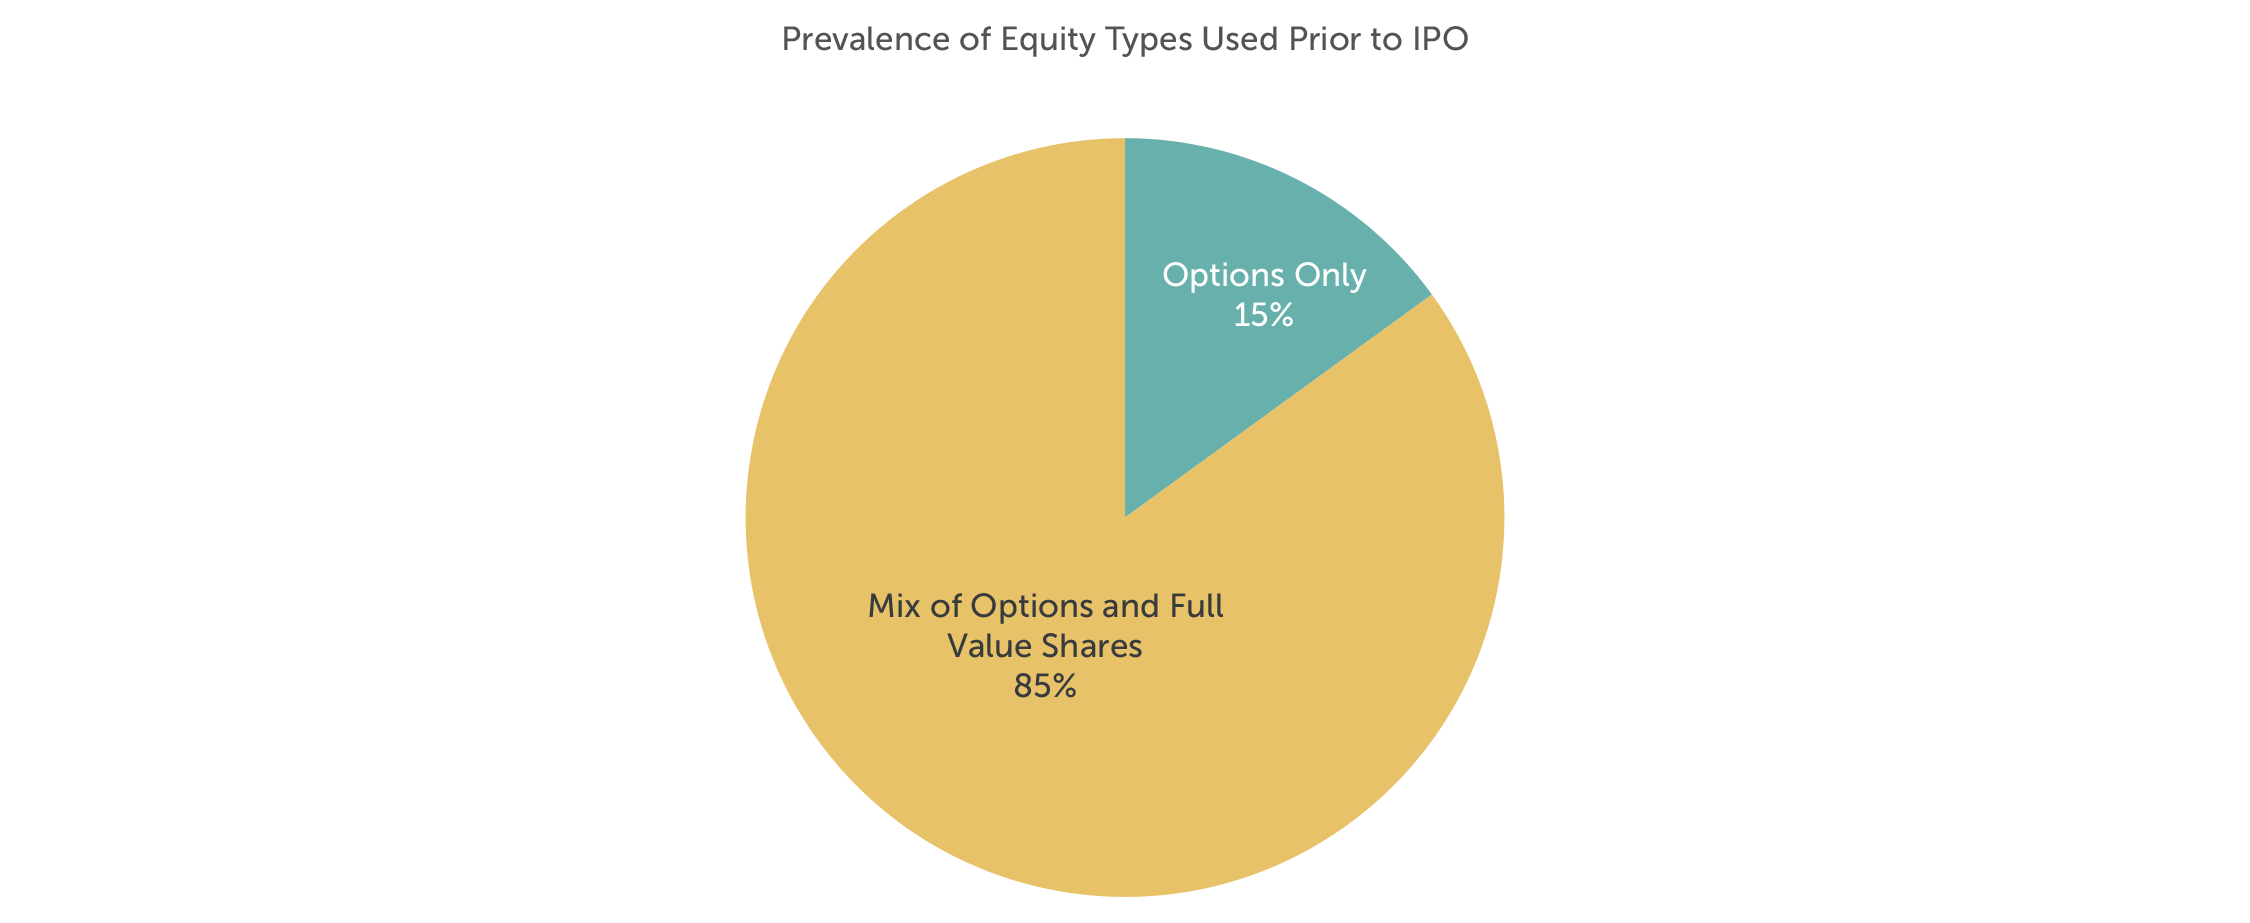
Note: No companies in the sample granted only full value shares prior to IPO.
Equity Authorization Pre- and At-IPO Practices
Before going public, companies often need to adopt multiple equity plans for incentive purposes. Not surprisingly, long time horizons and numerous funding rounds before IPO require companies to authorize additional equity share pools for compensation purposes. Private company investors are asked to approve incentives so that the company has enough “dry powder” to scale the executive team and grow its employee base. At median, equity overhang1 pre-IPO is 21.5% among the sample group.
In conjunction with the IPO, most companies (95% of companies in the sample), asked for an additional equity authorization. Median at-IPO overhang is 27.7% of common shares outstanding (CSO). In addition to the share request, companies often seek annual evergreen provisions (typically 5% of CSO per year) and liberal share recycling provisions.

Note: Pre-IPO and At-IPO equity overhang reflects the sample of 20 companies. Equity overhang for mature companies2 reflects sample (n=195) of S&P 1500 companies in the Information Technology sector, excluding companies that have gone public in the past three years.
Employee Stock Purchase Plans (ESPPs)
Many of the technology companies that went public implemented ESPPs in conjunction with their IPOs. ESPPs enable employees to purchase company stock, often at a discount, through payroll deductions. Most ESPPs are designed to be qualified plans under Internal Revenue Code Section 423, and from the standpoint of proxy advisory firms, such as ISS and Glass Lewis, are considered non-controversial. ESPPs are an appealing way for all employees to voluntarily acquire company shares after the IPO event. This is especially important as companies shift from granting equity to all employees to granting equity on a more selective basis (e.g., senior manager and up). An ESPP is an employee benefit that can be structured in ways (such as rollover provisions or extended offering periods) that make it an attractive recruiting and retention tool.
Founder Compensation
Every company has a different growth trajectory in its early years after formation. Founders typically must dilute personal ownership of the company in order to raise necessary capital. Companies in our study typically had multiple founders; however, not all founders contribute in the same way as the company evolves. Founders are often uniquely positioned and are key assets to their companies, which makes their retention crucial especially since finding a suitable replacement may be both difficult and expensive.
Founders who remain in executive roles after IPO have varied compensation packages depending on the specific circumstances. In some cases (Snap and Airbnb) founders reduced their base salaries to $1 post-IPO in exchange for significant equity grants in conjunction with the IPO. This is not typical as most founders maintain cash compensation (base salary and target bonuses) at market competitive levels.
With respect to equity compensation, some companies (including Airbnb and DoorDash) provided significant equity grants at or just prior to IPO. These grants often vest based on the achievement of performance criteria (e.g., stock price or market capitalization goals) and have long vesting periods that correspond with the magnitude of the award. Companies view these additional, often significant, equity grants to founders as necessary to incent continued service and focus, to maintain alignment with stockholder interests, and to mitigate the dilutive effects of public offerings on founder equity stakes.
Conclusion
Despite no “one-size-fits-all” approach to compensation, it is important to understand the various equity compensation tools available for companies preparing for an initial public offering. CAP’s review of recent technology IPOs highlights the latest trends in equity compensation needed to attract and retain skilled talent. Equally important is proactively and frequently communicating the value and mechanics of equity to participants for these awards to have maximum impact. Aligning pay philosophy with company culture and shareholder interests are important guiding principles to consider as companies design their equity incentive practices around IPO.
1 Overhang for IPO companies: Numerator = [Outstanding full value shares & options + shares available for grant + additional share requests] / Denominator = [Numerator + common shares outstanding as per the record date of the S-1 filing]
2 Overhang for Mature Companies: Numerator = [Outstanding full value shares & options + shares available for grant + additional share requests] / Denominator = [Diluted weighted average shares outstanding]
Compensation Advisory Partners (CAP) assessed human capital actions taken by companies in the Information Technology sector in response to the COVID-19 pandemic. Key findings include:
- The Information Technology (IT) sector and its Software & Services, Technology Hardware & Equipment, and Semiconductors and Semiconductor Equipment industries were nominally impacted by the COVID-19 pandemic.
- 28% of the Information Technology companies in the S&P Composite 1500 Index reported human capital actions in response to the pandemic. In contrast, 41 percent of companies in the S&P 1500 reported actions.
- Of the industries in the Information Technology sector, Software and Services (33%) and Technology Hardware and Equipment (32%) were impacted similarly, with about a third of companies reporting actions. In the Semiconductors and Semiconductor Equipment industry, only 15% of companies reported actions.
- Pay reductions for executives and board members are the most prevalent human capital actions in the Information Technology sector.
- Median salary reductions were 30 percent for chief executive officers (CEOs), while median salary reductions for other executives were 20 percent.
- For boards of directors, pay was cut by a median of 28 percent. The range of board pay cuts approximates the range for CEO pay cuts.
- In addition to pay reductions for executives and boards, the most prevalent human capital actions in the Information Technology sector were furloughs, employee pay cuts, and workforce reductions.
The PDF of the report provides additional data for the Information Technology sector.
The human capital actions that CAP is tracking include pay cuts; changes to annual and long-term incentives; furloughs; workforce reductions; suspended 401K matches; enhanced health and welfare benefits; additional pay for frontline workers; pay continuity; and workforce expansions. CAP will continue to monitor corporate public announcements of COVID-19 actions.
Partner Eric Hosken discusses the challenges companies are facing in attracting niche talent in the current tight labor market
CAP reviews and publishes an annual update on pay levels for Chief Financial Officers (CFOs) and Chief Executive Officers (CEOs). This year’s update is based on a sample of 119 companies with median revenue of $13 billion. Additional information on criteria used to develop the sample of companies is included in the Appendix.
Highlights 2017 vs 2016
| Component | Highlight |
| Base Salary |
|
| Bonuses |
|
| LTI |
|
| Performance Results |
|
| Total Compensation |
|
| Pay Mix |
|
Study Results
Salaries
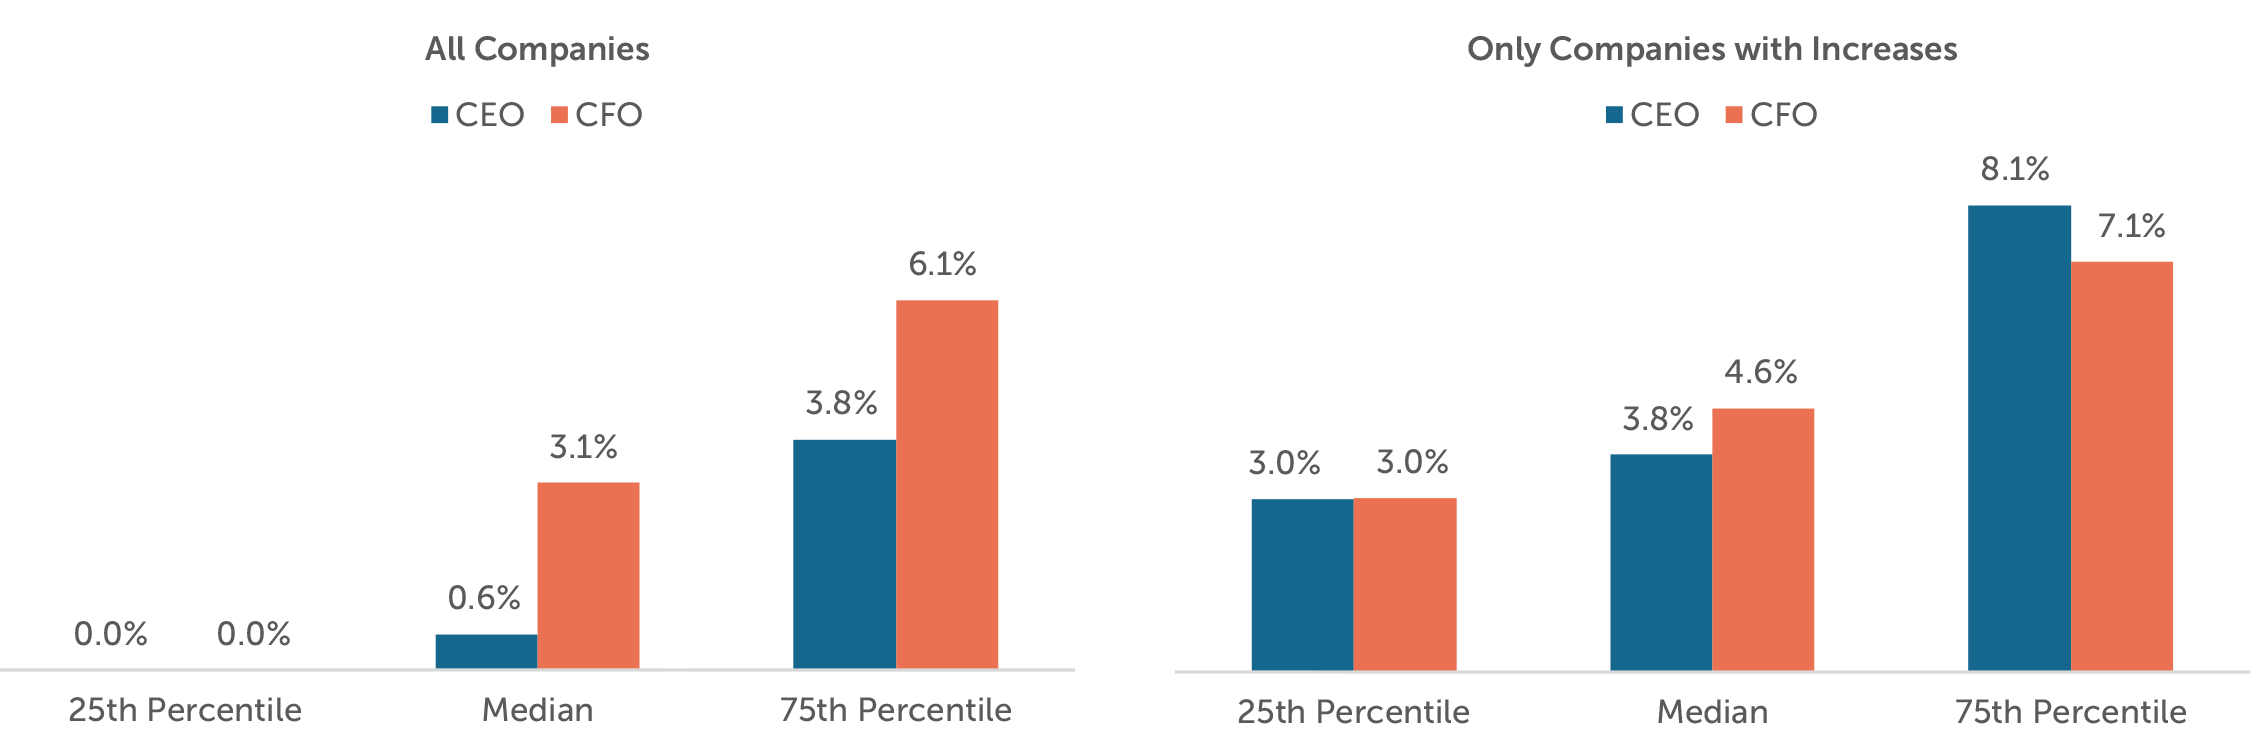
In the past, we have seen a steady growth in the number of CEOs and CFOs receiving salary increases in each year. However, for the 2016-2017 period the salary increase prevalence of 51% for CEOs and 70% for CFOs was very comparable to the increases for 2015-2016. The median 2017 salary increases were 3.1% for CFOs and 0.6% for CEOs.
2017 Salary Increases
Actual Pay Levels
Salary increases were higher for CFOs since only about one-half of CEOs received an increase. Yet, the median increases in actual bonus and long-term incentives were at similar levels for both CFOs and CEOs.
The median rate of increase in actual total direct compensation levels for CEOs and CFOs was 10.9% and 9.9% in 2017, respectively. We found that in 58% of the companies, the CEO received a higher percentage total compensation increase than the CFO.
| Median Percentage Change in Pay Components | ||||
|
Pay Components |
2015 – 2016 | 2016 – 2017 | ||
| CEO | CFO | CEO | CFO | |
| Salary | 0.0% | 3.0% | 0.6% | 3.1% |
| Actual Bonus | 1.5% | 1.1% | 12.0% | 12.7% |
| Long-Term Incentives | 3.8% | 4.1% | 8.1% | 10.3% |
| Actual Total Direct Compensation | 5.4% | 3.9% | 10.9% | 9.9% |
While target bonuses remained relatively the same, actual bonuses had significant increases indicating a strong performance year among the sampled companies. Year-over-year revenue and operating income growth was 7% for both measures which was much higher than 2016 performance of 1% and 4% growth, respectively.
Median Pay Increase by Industry1
Actual Total Direct Compensation2
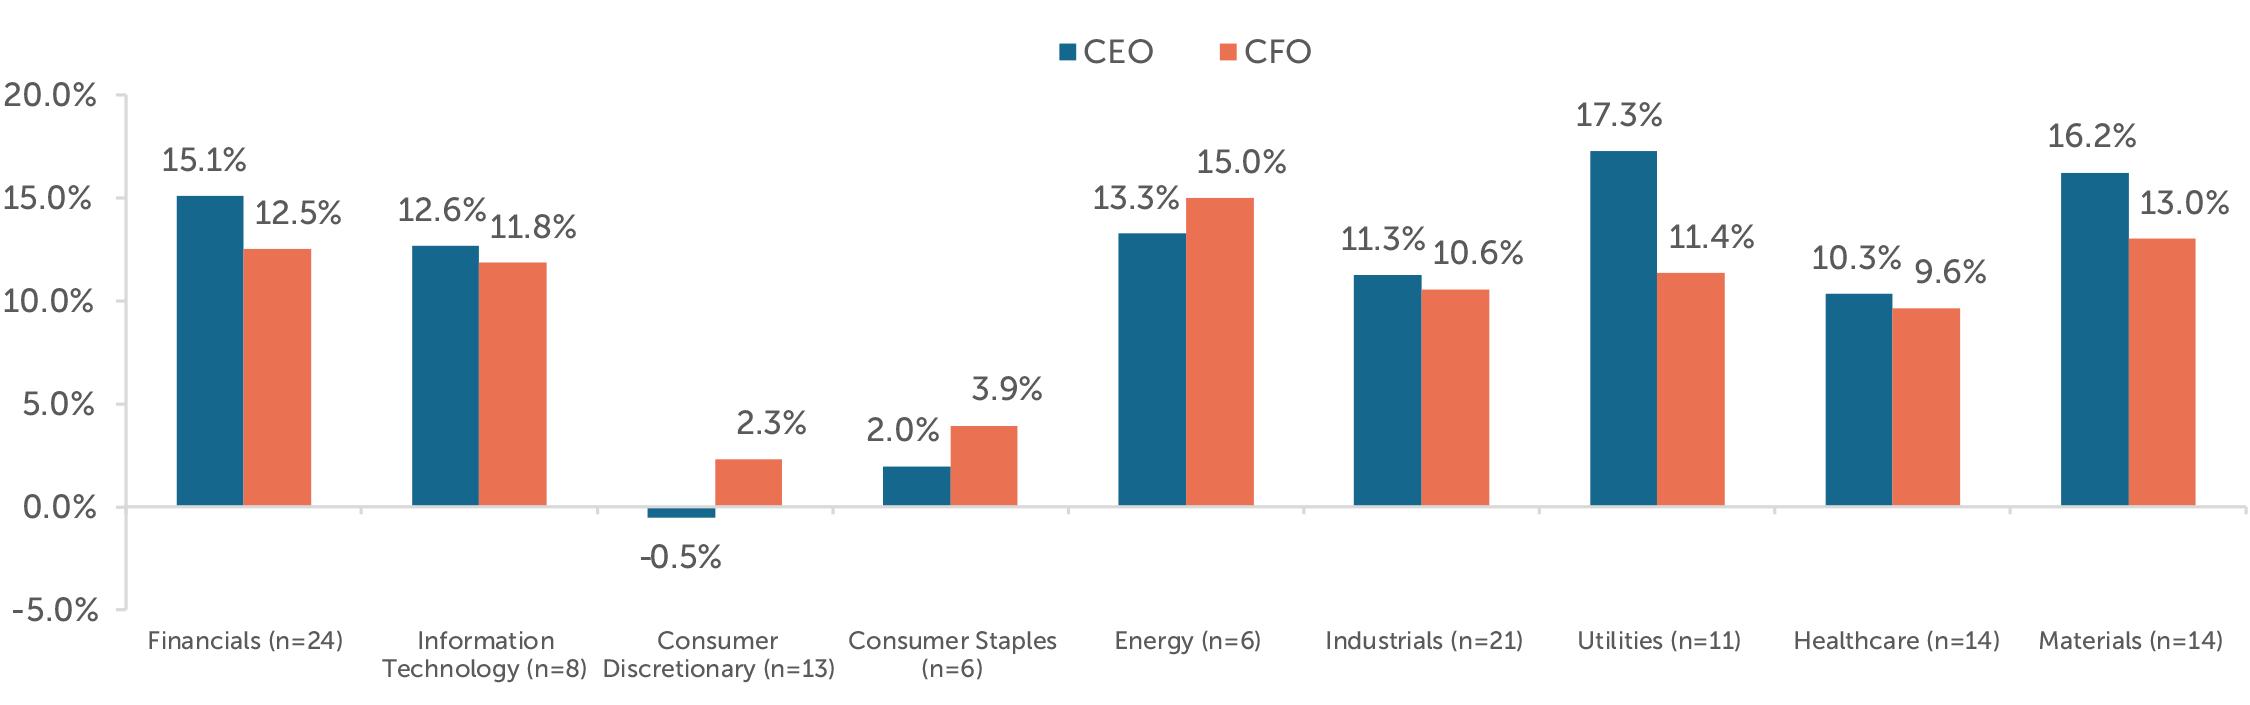
Median TDC increases by industry were generally aligned with the year-over-year revenue and operating income improvements.
Total compensation increases lagged the total sample for the Consumer Discretionary and Consumer Staples industries. While the companies in Consumer Staples improved total shareholder returns, revenue growth, and operating income growth in 2017, the overall industry performance still lagged the total sample. On the other hand, the companies in Consumer Discretionary generally saw a decrease in operating performance and an improved total shareholder return in 2017, but total compensation was generally flat.
The underperformance of the Consumer Staples companies is partially attributed to the pressure on sales volume as a result of taxes on soda, competition from store brands / smaller upstarts, battle for shelf space, and health conscious consumers.
For Consumer Discretionary companies, the trend is less clear as this industry is more diverse and covers a lot more sub-sectors (for example: media and entertainment, distributors, retail, hotels, automobiles, etc.). When we look at the companies in this industry individually, the compensation changes year-over-year were most often aligned with improved or deteriorated performance.
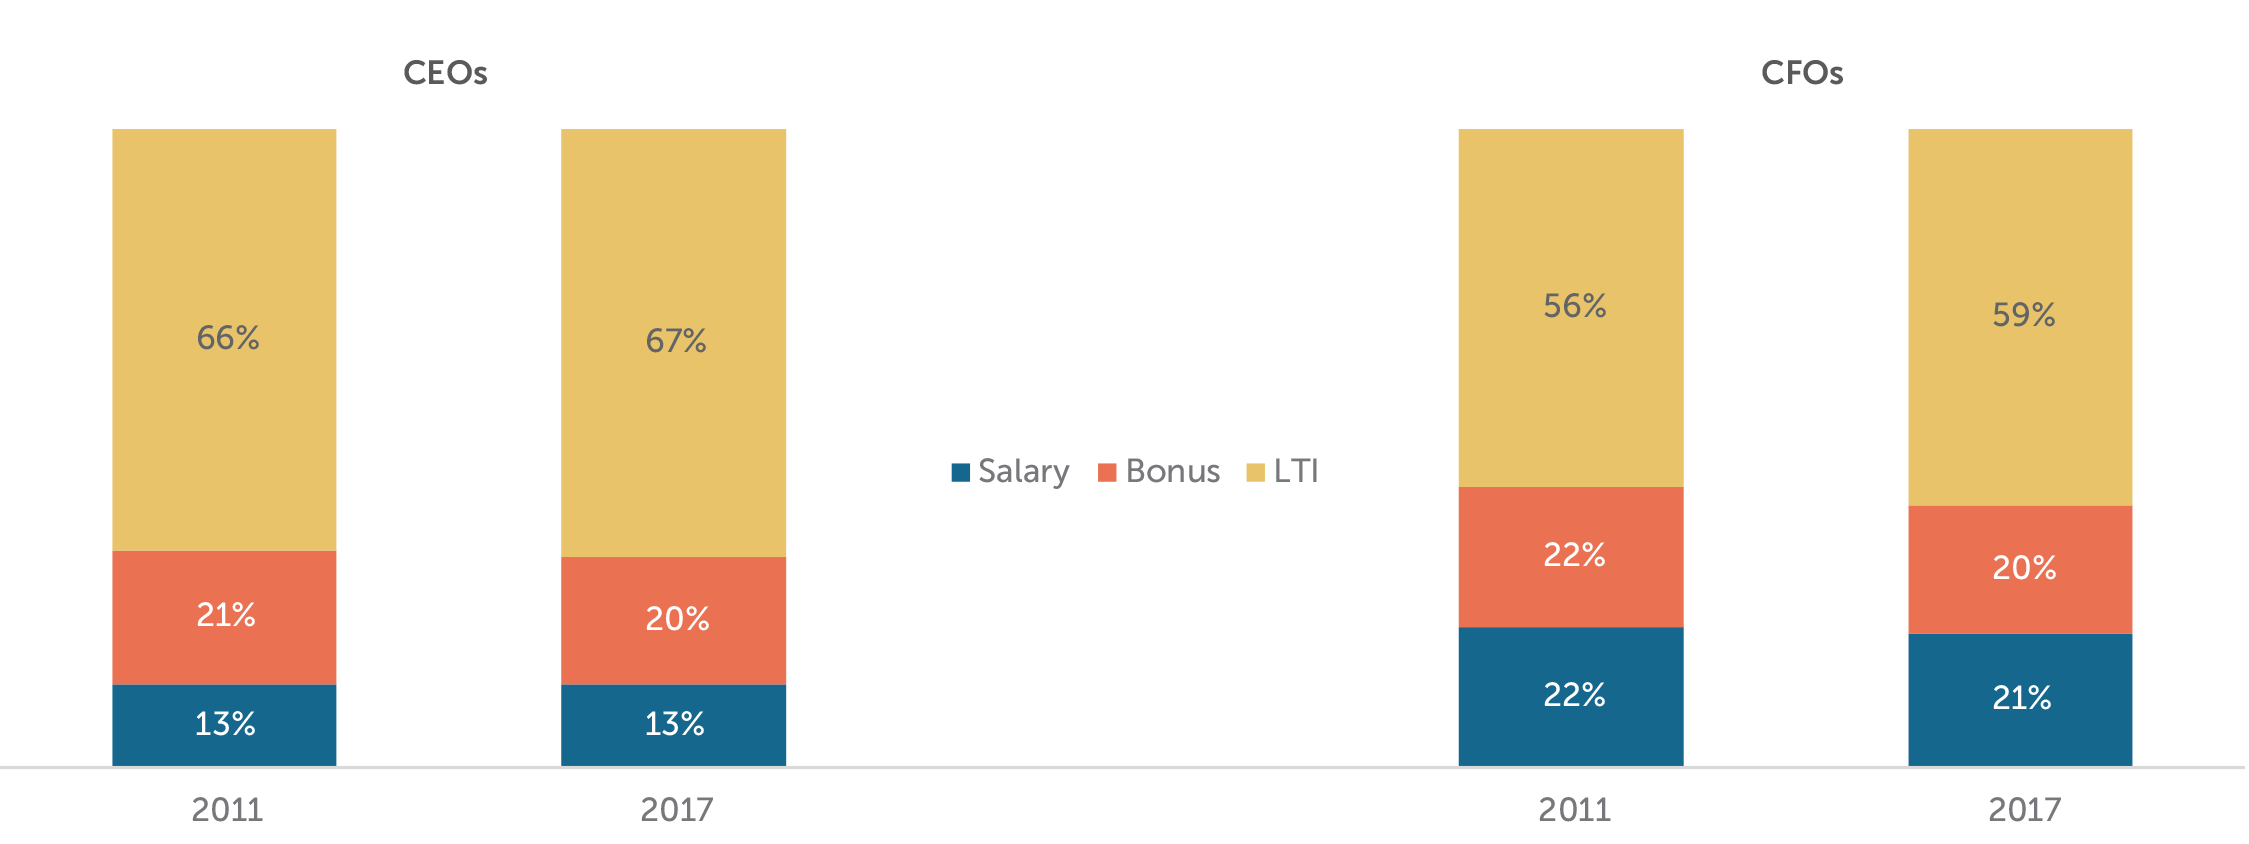
Target Pay Mix
The structure of the overall pay program (salary, bonus, LTI) has remained largely unchanged since 2011. CEOs continue to receive less in the form of salary and more in variable pay opportunities, especially LTI, than CFOs.
Target Bonuses
Target bonuses as a percentage of salary remained unchanged at median and only changed slightly at 25th and 75th percentiles. We do not foresee any major changes in target bonus percentages in the near future.
| Target Bonus as % of Salary | ||||
|
Summary Statistics |
CEO | CFO | ||
| 2016 | 2017 | 2016 | 2017 | |
| 25th Percentile | 138% | 135% | 85% | 85% |
| Median | 150% | 150% | 100% | 100% |
| 75th Percentile | 190% | 200% | 120% | 125% |
Long-Term Incentive (LTI) Vehicle Prevalence and Mix
Prevalence of performance plans continued to increase in 2017. The use of two different vehicles to deliver LTI remains the most prevalent approach and approximately 25% of companies studied use all 3 equity vehicles (stock options, time-based stock awards, and performance plan awards).
Performance plans account for around 60% of LTI awards on average among companies studied. The other portion of LTI is delivered through an almost equal mix of stock options and time-vested restricted stock awards.
| LTI Mix | ||||||
|
LTI Vehicles |
2011 | 2016 | 2017 | |||
| CEO | CFO | CEO | CFO | CEO | CFO | |
| Stock Options | 32% | 32% | 23% | 22% | 19% | 17% |
| Time Vested Restricted Stock | 17% | 22% | 20% | 24% | 18% | 24% |
| Performance Plans | 51% | 46% | 57% | 54% | 63% | 59% |
Conclusion
2017 performance overall, was higher compared to last year. Median revenue growth was 7% (vs 1% in 2016) and operating income growth was 7% (vs 4% in 2016). Total shareholder return in 2017 was comparable to 2016; the full year return was 20% (vs 16% in 2016). Total pay increases were much higher than in 2017, which we believe were directionally aligned with the performance improvements. A strong year of financial performance led to high annual incentive payouts in 2017 and after multiple years of sustained TSR growth companies are increasing LTI opportunities among their top executives.
The pay mix has been relatively consistent since 2011, but where we are seeing the most change is within LTI delivery vehicles. Since 2011 performance-based LTI plans have increased about 13% for both CEOs and CFOs with a similar drop in the prevalence of stock options, and time vested stock being relatively the same. With the focus on aligning pay outcomes with company performance by Boards and investors, we are not surprised to see large increases in total compensation after multiple years of sustained strong performance across industries.
APPENDIX
Sample Screening Methodology
Based on the screening criteria below, we arrived at a sample of 119 public companies with median 2017 revenue of $13B.
| Revenue | At least $5B in revenue for fiscal year 2017 |
| Fiscal year-end | Fiscal year-end between 9/1/2017 and 1/1/2018 |
| Proxy Statement Filing Date | Proxy statement filed before 3/31/2018 |
| Tenure | No change in CEO and CFO incumbents in the past three years |
| Industry | All industries have been considered for this analysis |
Companies use annual bonuses as a tool to reward executives for achieving short-term financial and strategic goals. Setting appropriate annual performance goals is essential to establishing a link between pay and performance. Goals should achieve a balance between rigor and attainability to motivate and reward executives for driving company performance and creating returns for shareholders.
Key Takeaways:
- Based on our analysis of actual incentive payouts over the past 6 years, the degree of difficulty, or “stretch”, embedded in annual performance goals translates to:
- A 95% chance of achieving at least Threshold performance
- A 75% chance of achieving at least Target performance
- A 15% chance of achieving Maximum performance
- This pattern indicates that target performance goals are challenging, but attainable, and maximum goals are achievable through highly superior performance
- The majority of companies use two or more metrics when assessing annual performance
- Annual incentive payouts have been directionally linked with earnings growth over the past 6 years
Summary of Findings
Plan Design
For the purposes of this study, we categorized annual incentive plans as either goal attainment or discretionary. Companies with goal attainment plans define and disclose threshold, target and maximum performance goals and corresponding payout opportunities. Alternatively, companies with discretionary plans do not define the relationship between a particular level of performance and the corresponding payout. Discretionary programs provide committees with the opportunity to determine payouts based on a retrospective review of performance results.
| Annual Incentive Plan Type | |||
| Industry | Sample Size | Goal Attainment | Discretionary |
| Auto | n= 8 | 100% | 0% |
| Consumer Discretionary | n= 10 | 90% | 10% |
| Consumer Staples | n= 12 | 67% | 33% |
| Financial Services | n= 12 | 17% | 83% |
| Healthcare | n= 9 | 89% | 11% |
| Industrials | n= 14 | 71% | 29% |
| Insurance | n= 12 | 67% | 33% |
| IT | n= 12 | 83% | 17% |
| Pharma | n= 10 | 80% | 20% |
| Total | 72% | 28% | |
Consistent with the findings from our study conducted in 2014, 72% of sample companies have goal attainment plans. Our study focuses on these companies.
Performance Metrics
Most companies (61%) use 3 or more metrics to determine bonus payouts. This reflects a shift from 2014, where 48% of companies used 3 or more metrics. Companies annually review metrics to ensure that they align with the business strategy.
Many companies use financial metrics such as revenue and profitability, which are indicators of market share growth and stock price performance. Some bonus plans also include strategic metrics, which incentivize executives to achieve goals that may contribute to long-term success, but may not be captured by short-term financial performance. Companies in the pharmaceutical industry often use strategic goals, such as pipeline development. Similarly, companies with large manufacturing operations often use quality control metrics.
| # of Metrics Used in Goal Attainment Plan | ||||
| Industry | 1 Metric | 2 Metrics | 3 Metrics | 4+ Metrics |
| Auto | 13% | 13% | 25% | 50% |
| Consumer Discretionary | 11% | 44% | 45% | 0% |
| Consumer Staples | 0% | 37% | 38% | 25% |
| Financial Services | 0% | 50% | 50% | 0% |
| Healthcare | 0% | 38% | 12% | 50% |
| Industrials | 20% | 40% | 20% | 20% |
| Insurance | 37% | 13% | 25% | 25% |
| IT | 10% | 30% | 40% | 20% |
| Pharma | 0% | 0% | 63% | 37% |
| Total | 11% | 28% | 34% | 27% |
Pay and Performance Scales
Compensation committees annually approve threshold, target, and maximum performance goals, and corresponding payout opportunities, for each metric in the incentive plan. Target performance goals are typically set in line with the company’s internal business plan. Executives most often earn 50% of their target bonus opportunity for achieving threshold performance and 200% for achieving maximum performance. Actual payouts are often interpolated between threshold and target and target and maximum.
Annual Incentive Plan Payouts Relative to Goals
All Companies
Based on CAP’s analysis, companies paid annual bonuses 95% of the time. Payouts for the total sample are distributed as indicated in the following charts:
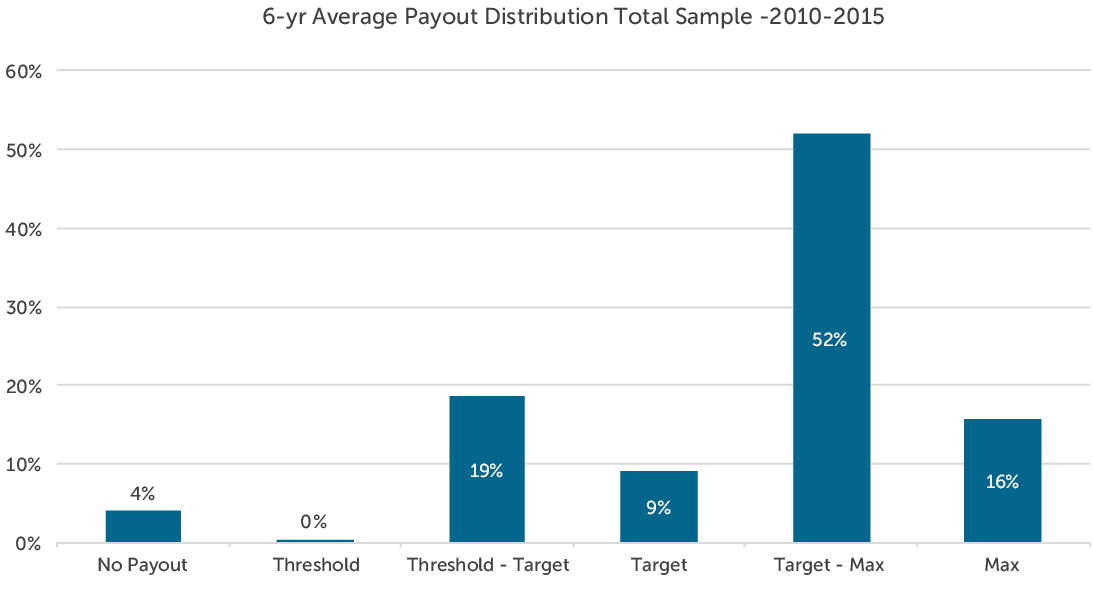
This payout distribution indicates that committees set annual performance goals with a degree of difficulty or “stretch” such that executives have:
- A 95% chance of achieving at least Threshold performance
- A 75% chance of achieving at least Target performance
- A 15% chance of achieving Maximum performance
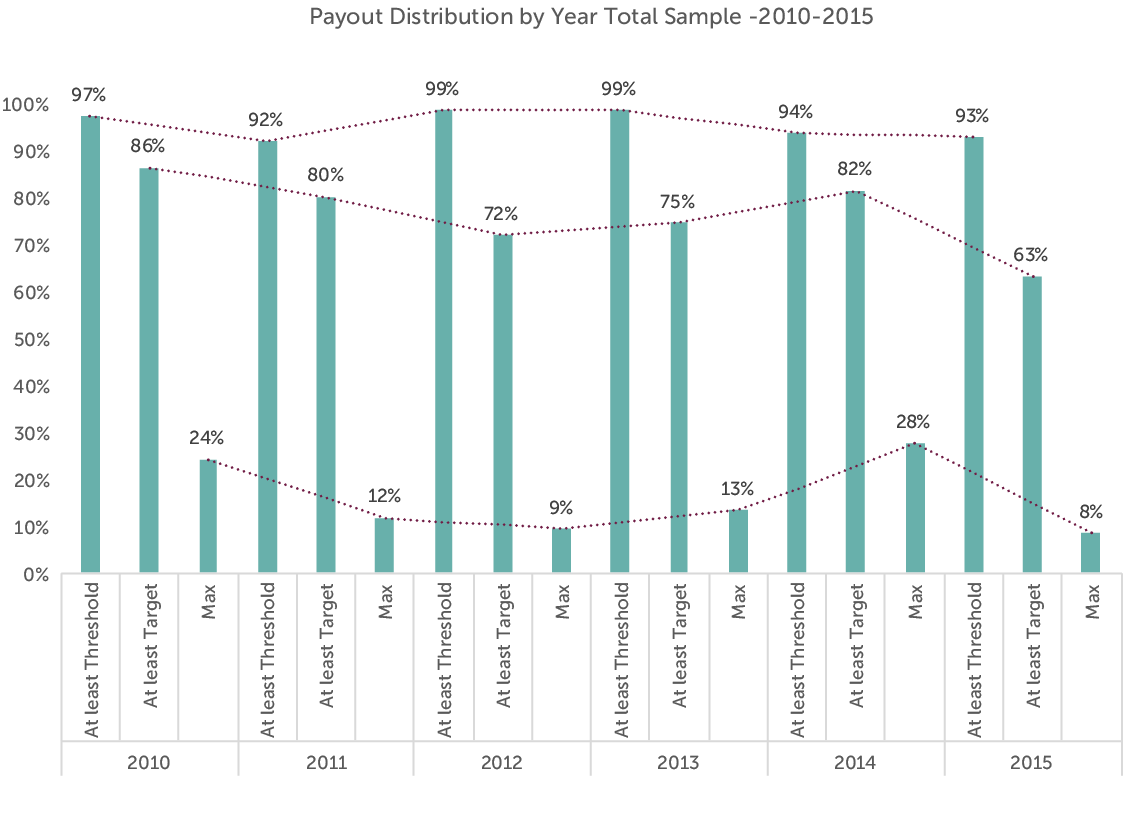
From 2010-2015, no more than 10% of companies failed to reach threshold performance in any given year. By comparison, in both 2008 and 2009, which were challenging years, approximately 15% of companies failed to reach threshold performance goals.
When looking back over 8 years (2008-2015), companies achieved at least threshold and target performance with slightly less frequency. Based on CAP’s analysis of this 8-year period, executives have:
- A 90% chance of achieving at least Threshold performance
- A 70% chance of achieving at least Target performance
- A 15% chance of achieving Maximum performance
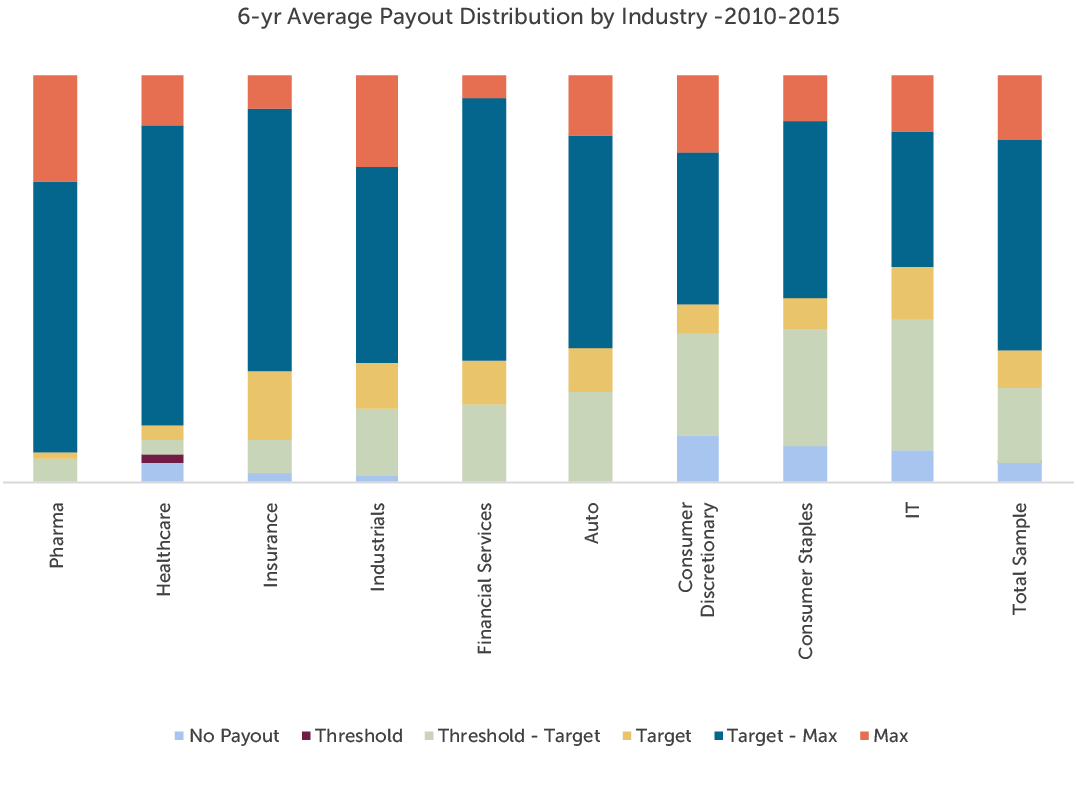
By Industry
Pharmaceutical and healthcare companies have paid at or above target more frequently than companies in any other industry over the past 6 years. Both industries have experienced significant growth over the period in part due to consolidation. The companies in the IT, Consumer Discretionary and Consumer Staples industries tend to pay below target at a higher rate. Average payouts for each industry are distributed as indicated in the following chart:
Relative to Performance
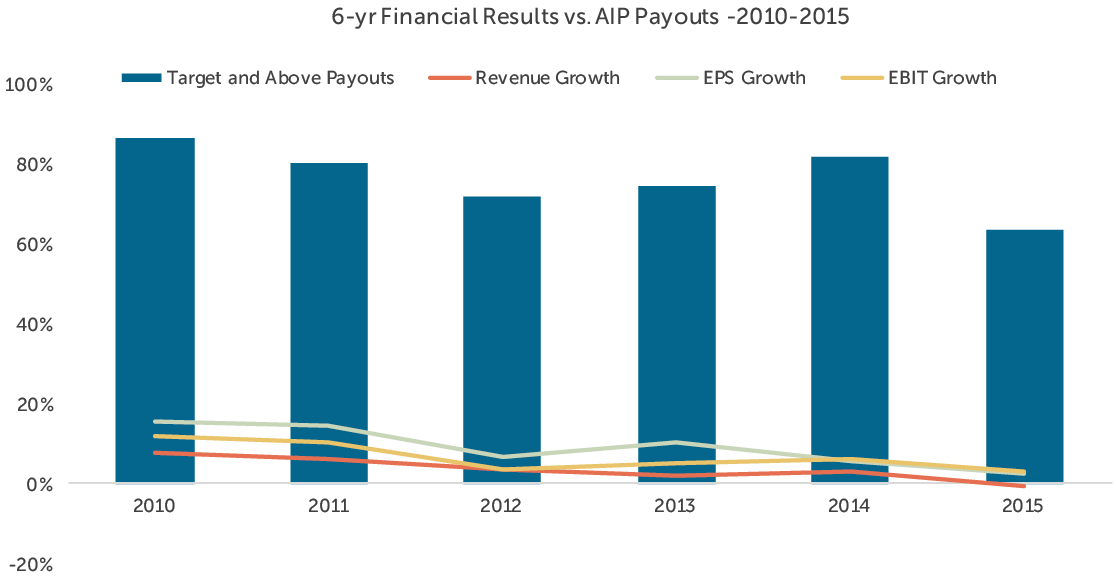
CAP reviewed the relationship between annual incentive payouts and company performance with respect to three metrics: revenue growth, earnings per share (EPS) growth and earnings before interest and taxes (EBIT) growth. While payouts were generally aligned with revenue and EPS growth, they most closely tracked with EBIT growth over the period studied (2010-2015). Companies may seek to align bonus payouts with operating measures, such as EBIT, as they capture an executive’s ability to control costs and improve operational efficiency.
The chart below depicts the relationship between median revenue, EPS, and EBIT growth and target and above annual incentive payouts among the companies studied.
Conclusion
In the first quarter of 2017, committees will certify the results and payouts for the fiscal 2016 bonus cycle and approve performance targets for fiscal 2017. Given the uncertain economic outlook following the 2016 presidential election, establishing performance targets for 2017 may be more challenging than usual. Companies may choose to use a range of performance from threshold to maximum to build flexibility into their plans given the unpredictable environment. Our study of annual bonus payouts over the past 6-8 years supports setting goals such that the degree of difficulty, or “stretch”, embedded in performance goals translates to:
- A 90-95% chance of achieving at least Threshold performance
- A 70-75% chance of achieving at least Target performance
- A 15% chance of achieving Maximum performance.
Companies should continue to set target performance goals that are challenging, but attainable and maximum goals that are achievable through outperformance of internal and external expectations – therefore, establishing a bonus plan that is attractive to executives and responsible to shareholders.
Methodology
CAP’s study consisted of 100 companies from 9 industries, selected to provide a broad representation of market practice across large U.S. public companies. The revenue size of the companies in our sample ranges from $18 billion at the 25th percentile to $70 billion at the 75th percentile.
CAP analyzed the annual incentive plan payouts of the companies in the sample over the past 6-8 years to determine the distribution of incentive payments and the frequency with which executives typically achieve target payouts. In this analysis, CAP categorized actual bonus payments (as a percent of target) into one of six categories based on the following payout ranges:
| Payout Category | Payout Range |
| No Payout | 0% |
| Threshold | Up to 5% above Threshold |
| Threshold – Target | 5% above Threshold to 5% below Target |
| Target | +/- 5% of Target |
| Target – Max | 5% above Target to 5% below Max |
| Max | 5% below Max to Max |


