CAP shares findings from proprietary board of director compensation survey for private companies.
Four-Part Survey on Short-Term and Long-Term Incentive Pay Practices at Public, Private, Nonprofit and Government Organizations.
Changes to short-term incentives (STIs) prompted by the global pandemic/economy are largely temporary, and some organizations cite the pandemic as the reason for modifying long-term incentives (LTIs). These findings are captured in the “2021 Incentive Pay Practices Study” of publicly traded, privately held, nonprofit, and government organizations conducted by Compensation Advisory Partners (CAP) in partnership with WorldatWork. The four-part survey provides a sweeping overview of approaches to incentive pay, including types of STI plans; annual incentive plan (AIP) measures, eligibility, targets, and payout frequency; long-term incentive (LTI) prevalence; incentive plan budgets (actual and estimated); and more.
Sample Findings
Publicly Traded Companies
- 34% of public companies added or modified their STI plans for 2021 with 26% of the changes due to the global pandemic/economy, and of those changes, 83% are temporary.
- 92% of public companies grant LTIs on an annual basis, and 66% vest LTI awards over three years.
- 13% of public companies identify diversity, equity and inclusion (DEI) initiatives as one of their STI performance measures to determine AIP payouts, in addition to financial, individual, and operational measures.
Privately Held Companies
- 37% of privately held companies added or modified their STI plans for 2021 with 29% of the changes due to the global pandemic/economy, and of those changes, 82% are temporary.
- Use of LTIs is down at private companies: 51% in 2021, down from norms in the low 60% range since 2013.
Nonprofits
- Short-term incentive prevalence at nonprofits increased in 2021 to 82%, the highest level reported in this survey’s history.
- Nonprofits, including large institutions, place less emphasis on profitability performance measures than for-profits, 46% compared to 72% (publicly traded companies) and 74% (private companies).
- About one-fifth (18%) of nonprofits have LTIs, compared to 94% of publicly traded companies and 51% of private companies.
Government Organizations
- STI use at government organizations reached 58% in 2021, up from 44% in 2019.
- Government organizations that offer LTIs (10%) do so through nonqualified deferred compensation programs.
“We’ve done this survey since 2007, and with each iteration we’ve seen incentives become more prevalent and offered to a broader range of employees,” said Bonnie Schindler, CECP and a principal at CAP. “Organizations are spending more on this component of compensation, and we expect to see incentives continue to be emphasized into the foreseeable future to align pay with performance.”
“It’s a white-hot labor market, and employers are struggling to find, engage and retain top-performing employees,” said Sue Holloway CCP, CECP, Director, Executive Compensation Strategy, WorldatWork. “It behooves every employer—public, private, nonprofit, and government alike—to get up to speed quickly and benchmark their incentive plans against all sectors because job candidates are gauging them to help determine their next career move.”
Methodology
WorldatWork collected survey data for the four-part survey during an 18-day period starting 3/4/21. The survey report is based on 1,226 responses across the four sectors: publicly traded; privately held; nonprofit; and government organizations. The demographics of the survey sample and the respondents are similar to the WorldatWork membership as a whole. The typical WorldatWork member works at the managerial level or higher in the headquarters of a large company in North America.
The full results of the Incentive Pay Practices surveys are available to WorldatWork members at Incentive Pay Practices (worldatwork.org)
For questions or more information, please contact:
Bertha Masuda
Partner
[email protected]
310-541-6233
Bonnie Schindler
Principal
[email protected]
847-636-8919
Susan Schroeder
Partner
[email protected]
310-426-2340
In this video, Bertha Masuda and Sue Schroeder provide a step-by-step guide on how to design a board pay program for privately held companies. Unlike their publicly traded peers, privately held companies do not have liquid stock. However, privately held companies need to have an attractive and competitive pay program in order to recruit and retain experienced board members. Bertha and Sue discuss the different board pay models and how to overcome private company challenges.
This report is a summary analysis of a joint study by Compensation Advisory Partners, Family Business and Private Company Director magazines.
Summary Report
Compensation Advisory Partners (CAP) and MLR Media launched the first-ever Family Business Executive Compensation Survey in 2020. CAP, an independent executive compensation consulting firm, and MLR Media, the publisher of Family Business Magazine, launched the survey to collect data on the executive compensation levels at family companies and to understand the pay practices unique to these businesses. The survey drew responses from more than 300 family-owned businesses representing a broad range of revenue sizes and industries.
Key survey findings include:
- The top executive positions of Chief Executive Officer (CEO) and President are held predominately by family members. In contrast, specialized functional roles, such as Chief Financial Officer and Chief Legal Officer, tend to be held by non-family members.
- Among the survey respondents, the CEO position is most often held by a family member across all company revenue ranges – even at companies with greater than $500 million in revenue.
- Compensation programs do not vary between family and non-family members at most survey respondents. The majority of companies offer participation in short- and long-term incentive programs to both family and non-family executives. Greater differentiation occurs for long-term incentives because family executives often hold equity ownership in the business, which provides profit-based distributions and dividends.
- Family-owned businesses spend a median of 10 percent of operating income on short-term incentives, which is higher than the spend at other privately held companies. Short-term incentive payments are most often based on company profitability. Beyond profitability, the performance measures used by family companies vary widely. The second most common performance measure is individual performance, indicating that subjectivity plays a role in short-term incentives at many family businesses.
- Long-term incentives are offered by approximately half of the family-owned companies surveyed. The most common long-term incentive vehicles are cash-based performance plans and phantom stock plans.
- The survey asked about dividends to shareholders to understand potential income to family executives who hold equity ownership. Dividends are paid to shareholders at 70 percent of survey respondents. Dividends paid in 2019 were 14.4 percent of net income at median. Given the impact of COVID-19, dividends were estimated to be lower in 2020, at 10 percent of net income at median.
- About one-third of the family businesses surveyed took executive compensation actions in response to COVID-19. The most common action was to suspend salary increases and bonus payouts. Another common human capital action was to reduce the workforce either permanently or through temporary furloughs.
About The Survey Participants
More than 300 companies responded to the survey, representing a broad range of industries and revenue sizes. Manufacturing is the most prevalent industry in the survey (one-third of respondents), followed by real estate and rental and leasing; agriculture, forestry, fishing, and hunting; construction; wholesale trade; and retail trade.
Participating companies span all different sizes. Exhibit 1 shows the distribution of responses across different revenue ranges.
Exhibit 1

The survey drew participation from companies with one to more than six generations of active family ownership. Exhibit 2 shows the distribution of revenue across generations. (Generations 4, 5 and 6+ are aggregated in the exhibit.) Not surprisingly, mature family businesses that have been in operation for many generations tend to have higher revenue, as Exhibit 2 illustrates.
Exhibit 2

Approximately 75 percent of participating companies are S or C corporations. Ninety-five percent of participating companies are based in the United States and Canada. All survey results are denominated in U.S. dollars.
Compensation Practices
The survey asked participants to provide compensation data (salary, short-term incentives, and long-term incentives) for 10 executive positions. Median compensation data for the total sample are shown in Exhibit 3. (The detailed report for survey participants includes data for each component of compensation, and also shows compensation data by revenue range).
Exhibit 3
|
Median Compensation Data for All Companies |
|
|
Position |
Total Direct Compensation |
|
Chief Executive Officer |
$425,000 |
|
President |
$350,000 |
|
Chief Legal Officer |
$300,000 |
|
Chief Operating Officer |
$270,000 |
|
Chief Financial Officer |
$250,000 |
|
Chief Sales Officer |
$239,572 |
|
Business Unit (or Sector) Head |
$170,000 |
|
Chief Human Resource Officer |
$169,842 |
|
Chief Information Technology Officer |
$156,506 |
Note: Insufficient data were available to report Chief Investment Officer compensation levels.
Company size is correlated with the level of executive pay at family businesses, as shown in Exhibit 4. As a company’s revenue increases, the complexity of operations and the responsibilities of the executives also increase, necessitating higher pay to attract and retain executive talent.
Exhibit 4

Family and Non-Family Executives
The survey asked respondents to indicate whether a position was held by a family member or not when providing compensation information. As shown in Exhibit 5, the two executive positions of CEO and President tend to be held by family members. In contrast, specialized functional roles tend to be held by non-family members. In addition, as shown in Exhibit 5, smaller companies have greater family representation in the executive ranks than larger companies. The results are not surprising: Smaller companies tend to rely on family member “sweat equity.” As companies grow, they hire talent from outside the family, particularly to gain specialized functional expertise. One surprising result is that the CEO position is held by a family member across all revenue ranges – even at companies with greater than $500 million in revenue.
Exhibit 5
|
Percent of Positions Held by Family Members by Revenue |
||||
|
Position |
Less than $50M |
$51M to $250M |
$251M to $500M |
Greater than $500M |
|
Chief Executive Officer or President |
86% |
76% |
69% |
62% |
|
Functional Heads |
29% |
12% |
4% |
5% |
|
Average of All Positions |
57% |
33% |
23% |
20% |
Note: Functional Heads reflect the following positions: Chief Financial Officer, Chief Sales Officer, Chief Legal Officer, Chief Information Technology Officer, and Chief Human Resources Officer.
Given the predominance of either family or non-family members holding a specific role, differences in total compensation for family and non-family executives cannot be meaningfully measured, except for select positions.
The President position and Chief Operating Officer (COO) position have more even distributions of family and non-family incumbents in the roles than other survey positions. To help control for company size, the two positions were analyzed by looking at pay for the President and COO roles as a percentage of CEO compensation in the same company.
- President: Base salaries for both family and non-family Presidents are about 95 percent of the CEO’s salary at median. The family President earns up to 15% less in total compensation than the non-family President. In fact, a non-family President’s total compensation exceeds that of the CEO at several family-owned companies responding to the survey. These findings indicate that family businesses that hire non-family Presidents view these incumbents as similar in value to the CEO. One explanation is that family businesses hire Presidents for succession-planning purposes to prepare a non-family member to eventually take over the top position.
- Chief Operating Officer: In contrast to the President position, family members in the COO role typically earn up to 15% more in base salary and total compensation than non-family members in the same role. A potential explanation is that families strive for greater pay equity between family members on the executive team.
The survey asked respondents whether family and non-family members were treated the same when receiving short- and long-term incentives. The majority of companies offer participation in short- and long-term incentive programs to both family and non-family executives.
There is more differentiation in participation for long-term incentives for family member executives, which is not surprising since family members are more likely to be shareholders and, therefore, be eligible for dividends or profit distributions. Long-term incentives are more likely used for non-family members to attract and retain talent, and to align the executives with company and shareholder objectives.
Short-Term Incentives
Short-term incentives are an important tool for rewarding performance and focusing executives on the near-term objectives of the business. The respondents provided their companies’ approximate budgets for short-term incentives as a percentage of operating income. At median, short-term incentive spending was 10 percent of operating income.
CAP has assessed short-term incentive spending as a percentage of operating income at privately held companies over the past decade. Privately held companies have historically spent 6 percent to 6.5 percent of operating income on short-term incentives at median. With a higher spend relative to other private companies, family companies emphasize short-term incentives as an important way to motivate and reward executives and employees.
The survey respondents report using a broad array of performance measures to determine payouts. More than half of the respondents use a profitability measure in determining short-term incentive payouts. Beyond profitability, no other performance measure stands out as a prevalent practice. Exhibit 6 below shows the top five most prevalent performance metrics at family businesses.
Exhibit 6
|
Most Common Short-Term Incentive Performance Metrics |
|
Ranked by prevalence |
|
1. Profitability Measure (net income, operating income, etc.) |
|
2. Individual performance |
|
3. Operational objective(s) |
|
4. Revenue |
|
5. Strategic objectives(s) |
After profitability, individual performance is the next most common performance factor, which indicates that subjectivity plays a role in short-term incentive decisions. Other common metrics are operational objectives, revenue, and strategic objectives. The broad array of performance measures favored by family businesses indicate that they assess their performance more holistically than privately held and publicly traded peers, which strongly emphasize profitability and financial performance in their short-term incentive programs.
Long-Term Incentives
Long-term incentives are granted to attract and retain executives and focus them on sustainable value creation and maintenance of the long-term health of the business. Long-term incentives, such as restricted stock, stock options and long-term cash incentive plans, are widely known because of their use at public companies and the significant values they can deliver.
At publicly traded companies, long-term incentives are almost universally offered to top executives. In contrast, privately held companies do not have liquid stock with daily valuations that they can use as executive incentives. Given this limitation, the prevalence of long-term incentives is approximately 60 percent in privately held companies. In addition to the long-term incentives mentioned above, privately held companies offer phantom equity, stock appreciation rights (i.e., phantom stock options), profit interests and deferred compensation.
The prevalence of long-term incentives at family-owned companies is less than that of other privately held companies. Only half of the family businesses surveyed offer long-term incentives to executives (see Exhibit 7). The prevalence is lower than at other privately held companies because family businesses are often reluctant to share real ownership or economic value with executives outside the family.
Exhibit 7

Exhibit 8 below shows the top 3 most prevalent long-term incentive vehicles at family-owned companies. These companies predominately favor cash-based vehicles.
Exhibit 8
|
Top 3 Long-Term Incentive Vehicles |
|
|
Vehicle |
Prevalence |
|
Performance cash plan |
41% |
|
Phantom stock (long-term performance cash tied to company value) |
25% |
|
Restricted stock or restricted stock unit (actual ownership) |
16% |
In the family businesses that have long-term incentive programs, the most common practices are to grant awards annually, and to have vesting or performance periods spanning three or five years.
Without a public market to provide liquidity or a valuation for equity, private companies must decide on how to provide these features in their plans. To value equity, family businesses typically use an established formula or an outside, independent appraisal. These companies typically provide liquidity upon an executive’s termination or upon vesting of the award.
The companies surveyed report modest pools for the sharing of value creation relative to publicly traded peers. More than half of the respondents with equity-based long-term incentive plans report pools of 10 percent or less of total shares outstanding.
Dividend Practices
The survey asked family businesses about their dividend payment practices to understand the income potential for executive shareholders. Of the survey respondents, 70 percent pay dividends to shareholders (see Exhibit 9).
Exhibit 9

In 2019, companies paid out 14.4 percent of net income at median to shareholders. Given the impact of the COVID-19 pandemic, companies anticipate paying smaller dividends in 2020.
Larger Family Businesses (Greater than $500 Million in Revenue)
Competing with publicly traded companies for executive talent is a particular concern for large family businesses. In reviewing the survey responses of companies with greater than $500 million in revenue, a few distinctive compensation practices emerge:
- Higher pay positioning – Larger businesses tend to have an above-median pay positioning for base salary and total compensation compared to smaller counterparts. This higher positioning for total compensation is achieved, in part, by short-term and long-term incentives.
- Short-term incentives – Larger businesses provide higher maximum short-term incentive opportunities (150 percent to 200 percent of target) and budget a higher percentage of operating income for short-term incentives.
- Long-term incentives – Over three-quarters of larger family businesses offer long-term incentives to their executives. Long-term incentives are typically granted annually, and the grants are limited to the senior executive group.
- Budgeted salary increases – While smaller organizations tend to have a wider range of annual budgeted salary increases, larger companies’ budgeted increases center around three percent.
The Impact of COVID-19
Participants were asked to provide information about any actions taken in response to COVID-19. Approximately one-third of the respondents indicated that they took executive compensation actions because of the pandemic. Of the respondents that reported broader COVID-related actions, the most common were:
- Suspended pay raises or bonus payouts (46%)
- Reduction in workforce (40%)
- Furlough of employees (32%)
- Reduced base salary (30%)
- Suspended or reduced dividend payments (24%)
The most common durations of the COVID-related actions are indefinite/to be determined (31% of companies), the duration of the pandemic (22%) and through the end of 2020 (21%).
Looking Ahead
COVID-19 made 2020 a challenging and unprecedented year. As a result of the pandemic, companies had to modify their business strategies to meet an array of challenges: ensuring employee safety or managing a remote workforce, managing disrupted supply chains, and responding to the ongoing economic uncertainty. In turn, compensation strategies were also modified.
Given COVID-19, 2020 was not an ideal year to launch a new compensation survey. The compensation data presented in this report may have been impacted by these challenges. As a result, CAP and MLR Media plan to conduct the second iteration of the Family Business Executive Compensation Survey in summer and fall of 2021. In this next iteration, we will be able to evaluate trends in compensation practices and continue to provide executive compensation benchmarking data to family businesses as they transition to normalcy.
Survey Contacts
For information on participating in the next survey, please contact:
- David Shaw, survey director, [email protected]
For information on the survey analysis or for any executive compensation-related questions, please contact:
- Bonnie Schindler, survey author, [email protected]
- Joshua Hovden, survey author, [email protected]
- Bertha Masuda, contributing author, [email protected]
- Susan Schroeder, contributing author, [email protected]
- Han Wen Zhang, contributing author, [email protected]
2020 was a particularly robust year for initial public offerings (IPOs) and special purpose acquisition companies (SPACs). Many companies took advantage of favorable capital markets, and we saw much-anticipated IPOs such as Snowflake, DoorDash and Airbnb hit the public markets in 2020. Founders, employees, and investors unlocked significant value in these IPO events.
CAP’s review of technology company equity practices around IPO reveals several emerging compensation trends: a shift in equity award vehicles from stock options to restricted stock units (RSUs), increased use of double-trigger vesting for restricted stock, and large, company-friendly equity authorizations. Additionally, some companies implemented noteworthy founder compensation practices.
Pre-IPO Equity Grant Practices
CAP reviewed a sample of 20 high-profile, technology companies with IPOs in recent years to understand their equity practices leading up to the IPO.
List of companies:
| Airbnb | Fitbit | Palantir | Slack | Square |
| Asana | GoPro | Peloton | Snap | Uber |
| DoorDash | Grubhub | Snowflake | Unity Software | |
| Dropbox | Lyft | Roku | Sonos | Zoom Video |
Options are still predominant. For companies anticipating growth, options continue to be the favored equity award for a variety of reasons. For employees, there is no tax burden at vest, and the employee has control over the settlement of the award and associated taxation. If incentive stock options (“ISOs”) are used, the employee receives capital gains treatment upon disposition of shares, assuming the required holding period is met. Options are also favorable from the shareholder (often financial sponsors) perspective. Options align the interests of employees with their shareholders, as no award value is realized unless the company value appreciates. Typically, stock options are granted at-hire and allow employees to share in the value of the company as it grows and matures.
Increased use of RSUs with unique features. Some companies (such as Lyft, Uber, and Dropbox) shifted to granting more RSUs in the years leading up to IPO. In these cases, RSUs have double-trigger vesting, which requires both time-based service (typically four years) and event-based requirements (typically a qualifying capital event such as an IPO) be satisfied in order for the RSUs to vest.
Companies naturally shift from granting options to RSUs as they grow and mature. Reasons for this include changes in a company’s growth expectations post-IPO, the need to conserve shares, and a desire for differentiated equity grant programs as companies grow in size and complexity. However, as seen with recent IPOs, favoring RSUs could be attributed to the fact that award values are easier to understand and are somewhat protected, even if company valuations fluctuate between funding rounds. Companies also benefit, from an accounting perspective, with vesting being dependent on a qualifying capital event as no accounting charge is incurred until such event takes place.
Adopting double-trigger RSUs has potential downsides, though. These include mounting pressure to go public (as evidenced by media coverage of the long-delayed IPO of Airbnb), and a significant tax burden for employees whose equity vests upon IPO. Employees are exposed to the financial risk of being taxed on stock compensation that has since declined in value since IPO. Also, when employees leave the company before the IPO event, their unvested shares are forfeited. This may pose an issue for recruitment unless the IPO timeline is clear. For the company, event-based vesting triggers a major accounting expense, and the large number of shares being sold may temporarily impact the company’s share price.
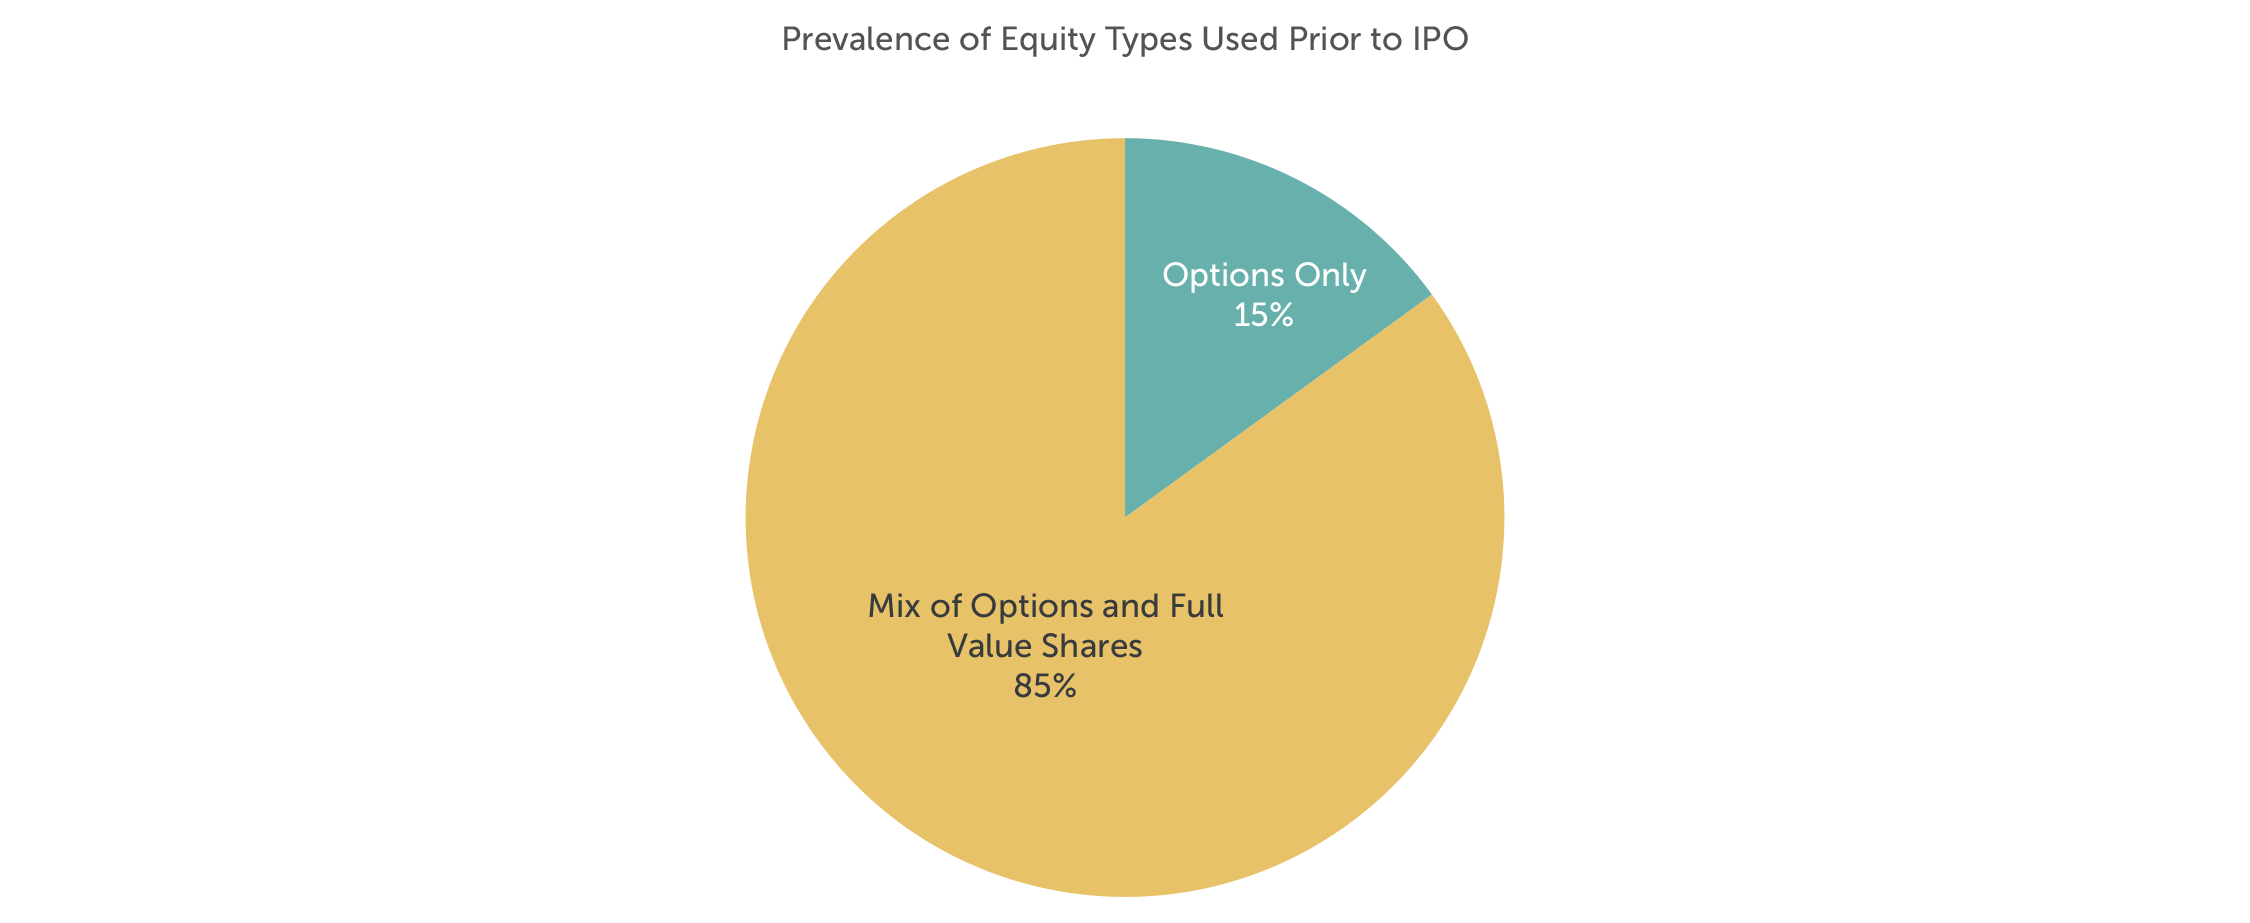
Note: No companies in the sample granted only full value shares prior to IPO.
Equity Authorization Pre- and At-IPO Practices
Before going public, companies often need to adopt multiple equity plans for incentive purposes. Not surprisingly, long time horizons and numerous funding rounds before IPO require companies to authorize additional equity share pools for compensation purposes. Private company investors are asked to approve incentives so that the company has enough “dry powder” to scale the executive team and grow its employee base. At median, equity overhang1 pre-IPO is 21.5% among the sample group.
In conjunction with the IPO, most companies (95% of companies in the sample), asked for an additional equity authorization. Median at-IPO overhang is 27.7% of common shares outstanding (CSO). In addition to the share request, companies often seek annual evergreen provisions (typically 5% of CSO per year) and liberal share recycling provisions.

Note: Pre-IPO and At-IPO equity overhang reflects the sample of 20 companies. Equity overhang for mature companies2 reflects sample (n=195) of S&P 1500 companies in the Information Technology sector, excluding companies that have gone public in the past three years.
Employee Stock Purchase Plans (ESPPs)
Many of the technology companies that went public implemented ESPPs in conjunction with their IPOs. ESPPs enable employees to purchase company stock, often at a discount, through payroll deductions. Most ESPPs are designed to be qualified plans under Internal Revenue Code Section 423, and from the standpoint of proxy advisory firms, such as ISS and Glass Lewis, are considered non-controversial. ESPPs are an appealing way for all employees to voluntarily acquire company shares after the IPO event. This is especially important as companies shift from granting equity to all employees to granting equity on a more selective basis (e.g., senior manager and up). An ESPP is an employee benefit that can be structured in ways (such as rollover provisions or extended offering periods) that make it an attractive recruiting and retention tool.
Founder Compensation
Every company has a different growth trajectory in its early years after formation. Founders typically must dilute personal ownership of the company in order to raise necessary capital. Companies in our study typically had multiple founders; however, not all founders contribute in the same way as the company evolves. Founders are often uniquely positioned and are key assets to their companies, which makes their retention crucial especially since finding a suitable replacement may be both difficult and expensive.
Founders who remain in executive roles after IPO have varied compensation packages depending on the specific circumstances. In some cases (Snap and Airbnb) founders reduced their base salaries to $1 post-IPO in exchange for significant equity grants in conjunction with the IPO. This is not typical as most founders maintain cash compensation (base salary and target bonuses) at market competitive levels.
With respect to equity compensation, some companies (including Airbnb and DoorDash) provided significant equity grants at or just prior to IPO. These grants often vest based on the achievement of performance criteria (e.g., stock price or market capitalization goals) and have long vesting periods that correspond with the magnitude of the award. Companies view these additional, often significant, equity grants to founders as necessary to incent continued service and focus, to maintain alignment with stockholder interests, and to mitigate the dilutive effects of public offerings on founder equity stakes.
Conclusion
Despite no “one-size-fits-all” approach to compensation, it is important to understand the various equity compensation tools available for companies preparing for an initial public offering. CAP’s review of recent technology IPOs highlights the latest trends in equity compensation needed to attract and retain skilled talent. Equally important is proactively and frequently communicating the value and mechanics of equity to participants for these awards to have maximum impact. Aligning pay philosophy with company culture and shareholder interests are important guiding principles to consider as companies design their equity incentive practices around IPO.
1 Overhang for IPO companies: Numerator = [Outstanding full value shares & options + shares available for grant + additional share requests] / Denominator = [Numerator + common shares outstanding as per the record date of the S-1 filing]
2 Overhang for Mature Companies: Numerator = [Outstanding full value shares & options + shares available for grant + additional share requests] / Denominator = [Diluted weighted average shares outstanding]
CAP Partners Bertha Masuda and Susan Schroeder discuss long-term incentives for executives working in family businesses.
CAP Partners Bertha Masuda and Susan Schroeder talking about how to compensate family members working in the business.


