The SEC recently updated its regulatory agenda. As part of the update, the deadline to adopt final pay ratio rules was pushed back to October 2015 (from October 2014).
- Implication: companies with a Dec 31 fiscal year end are not expected to be required to comply with pay ratio rules/disclosure until publication of 2017 proxy statements
The deadline for other outstanding compensation-related rulemaking coming out of the Dodd-Frank Act was also delayed to October 2015: standardized pay vs. performance disclosure, hedging policies, and clawbacks requirements.
- Note: Timeline changes reflect a new deadline, not the date at which rulemaking will be published or adopted
We will provide additional updates as this issue continues to evolve.
Key CAP Findings
Board Compensation. little/no change
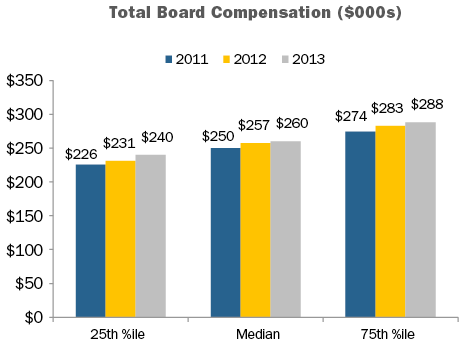
- Total Fees. At median, flat from 2012 to 2013 ($257K vs. $260K)2. Only increased four percent since 2011.
- Retainers. Pay programs have been simplified, now viewed more as an “advisory fee” than an “attendance fee.” In general, companies have moved to a fixed retainer pay structure, with a component in cash and a component in equity.
- Meeting fees. Provided by only 15 percent of companies, down slightly from 2012.
- Equity. Full-value awards (shares/units) are most common. Only five percent of companies use stock options. 92 percent of companies denominate equity awards (stock or options) as a fixed value, versus a fixed number of shares.
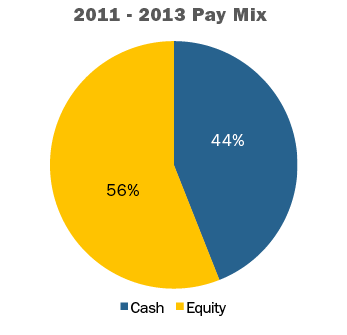
- Pay Mix. On average, 56% equity-based vs. 44% cash-based (consistent for past three years). Alignment with long-term shareholders is reinforced by delivering a majority of compensation in equity.
Committee Member Compensation. little/no change
- Less than half of companies paid committee-specific member fees3.
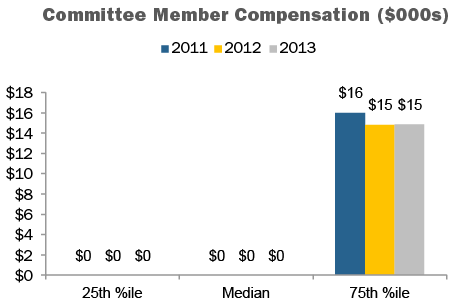
- At median, committee member compensation is $04. There has been a trend away from committee member fees; value typically rolled into Board cash or equity retainers.
Committee Chair Compensation. limited, but notable change
- Nearly all companies provided additional compensation to committee Chairs, versus committee members, typically through an additional retainer. The additional compensation recognizes additional time requirements, responsibilities, and reputational risk.
- At median, $20K in additional compensation (vs. members) was provided to Audit and Compensation Committee Chairs, and $15K to Nominating/Governance Chairs. This is the first year the premium, at median, provided to Compensation Chairs equaled that provided to Audit Chairs.
Independent Board Leader Compensation.
limited, but notable change
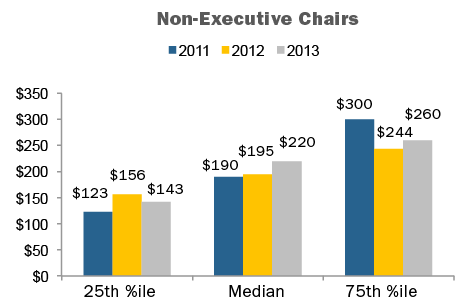
- Non-Exec Chair. Additional compensation is provided by all companies with this role, $220K at median.
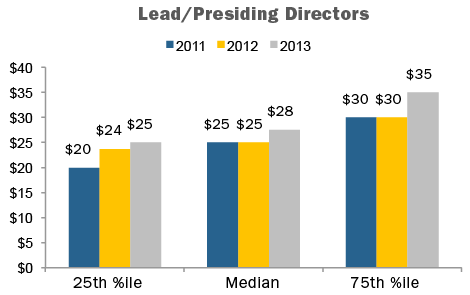
- Lead Director. Additional compensation is provided by nearly all companies with this role5, $28K at median. The differential in pay versus non-executive Chairs is in line with typical differences in responsibilities. Additional compensation was steady, at median, at $25K for the five years prior to 2013.
Perquisites. little/no change
- Overall, limited practice. One-third of companies continue to provide gift matching/charitable contribution.
Pay Limits. NEW to study
- Due mainly to advancement of litigation in Delaware court related to director compensation, several companies (23%) have adopted shareholder approved director compensation limits ($800K, at median). The limit most often applies only to equity-based compensation.
CAP Perspective
Board Pay Levels and Structure
We have hit somewhat of a “steady state” in terms of director pay levels. Over the next few years, we expect modest pay level changes; i.e., low-to-mid single-digit annual increases in Total Board Compensation6. among the broader data set. Individual companies typically make pay level changes every two-to-three years; when they do, the changes tend to be larger than those observed annually within the full data set.
In terms of practices, pay programs have continued a trend towards simplification, as director compensation has become viewed more as an “advisory fee” than an “attendance fee.” Companies have moved to fixed retainer pay structures, with a component in cash and a component in equity, as opposed to use of per-meeting fees.
Director Pay Limits
A number of companies have recently placed limits on director compensation. The limits are largely due to advancement of litigation in Delaware court. In these cases the issue has been that directors approve their own annual compensation, and the shareholder approved long-term incentive plan did not provide “meaningful limits” on the maximum award that could be granted to a director.
When seeking shareholder approval for amendment to an omnibus long-term incentive plan or director compensation plan, 23 percent of companies studied have included value- or share-based limits (13% and 10%, respectively) for non-employee director compensation. These limits range from $250K to $2 million, $800K at median, and typically apply to just equity-based compensation. Some companies have applied the limits to both cash and equity-based compensation while others have excluded initial at-election equity awards, committee Chair pay, and/or additional pay for Board leadership roles from the limit.
We expect prevalence of director pay limits to increase, becoming majority practice within the next three to four years.
Lead Director Compensation
The Lead Director role has evolved, oftentimes a more active role than three to five years ago. As a result, companies are looking at time commitment and responsibilities, and structuring compensation to appropriately reflect the current role and expectations. Boards are engaging in more outreach and meeting with shareholders to talk about governance practices, CEO succession and executive compensation, among other issues, and many investors want to hear from the Lead Director.
Prevalence of providing additional compensation for the Lead Director role has increased over the past five years. Currently, additional compensation is provided by nearly all companies studied with a Lead Director7.
Despite the increased activity of Lead Directors, additional compensation provided for the role continues to be quite different than non-executive Chairs. At median, $28K was provided for the Lead Director role, versus $220K for the non-executive Chair role. In terms of additional compensation, for Lead Directors the pay ranges from $25K to $35K and for non-executive Chairs it ranges from $143 to $260 at 25th and 75th percentiles, respectively. The differential in pay is in line with typical differences in responsibilities. Previously, additional compensation for Lead Directors was steady, at median, at $25K for the last five years. Still, differences exist, somewhat, in role/responsibilities across companies which can impact the level of premium compensation provided for the Lead director role.
Making the decision to provide additional compensation to the Lead Director can send a signal to investors regarding expectations for the role, including time commitment, responsibilities, and authority. Many times, companies have been able to settle (or argue against) shareholder proposals to split the CEO and Chairman roles by instituting (or emphasizing) a strong Lead Director and delineating the specific responsibilities of the position. Boards can also reassure investors concerned about overall governance practices at a company by increasing the Lead Director role/responsibilities. Stock Ownership Guidelines Based on our research, 83% of companies have formal stock ownership requirements. Approximately half of companies studied required directors to defer recognition of equity pay until retirement. The median value of required stock ownership level was $450K.
Detailed Findings
Total Board Compensation
At median, 2013 non-employee director compensation was $260K, generally consistent with 2012.
Pay Mix
The mix of cash and equity paid to outside directors has remained the same for the last 3 years. On average, 56 percent of compensation was equity-based, and 44 percent was cash-based.
Equity Compensation
Full-value equity awards (stock/units) are the most common form of stock-based compensation. Only five percent of companies used stock options in 2013.
|
Vehicle |
2013 |
2012 |
2011 |
|
Full-Value Equity |
95% |
93% |
93% |
|
Stock Options |
2% |
2% |
5% |
|
Both |
3% |
5% |
2% |
Equity awards denominated as a fixed value, as opposed to awards based on a fixed number of shares, continue to increase in prevalence. In 2013, 92 percent of companies denominated equity awards – stock and/or options – based on a fixed value.
|
Award Type |
2013 |
2012 |
2011 |
|
Fixed Value |
88% |
82% |
84% |
|
FIXED Shares |
8% |
11% |
15% |
|
Both |
4% |
7% |
1% |
Committee Compensation
In 2013, just under half of companies studied paid fees specific to committee members (Audit – 48%, Compensation – 35%, and Nominating/Governance – 32%). Given this, at median, committee member compensation was $0. Among companies that do pay separate fees for committee member service, median compensation during 2013 was $15K.
During 2013, additional compensation (premium vs. member) was provided to 96 percent of Audit Committee Chairs, 90% of Compensation Committee Chairs, and 89% of Nominating/Governance Committee Chairs.
Unlike prior years, during 2013 the additional compensation provided to Audit Committee Chairs, at median, was equal to that provided to Compensation Committee Chairs ($20K). The premium provided to Chairs of Nominating/Governance Committees, at median, was lower ($15K).
Lead/Presiding Directors and Non-Executive Board Chairs
Additional compensation is typically provided to Lead/Presiding Directors and non-Executive Board Chairs.
During 2013, median additional pay provided to Lead Directors and non-executive Chairs increased to $28K and $220K, respectively. Previously, median compensation provided to Lead Directors had been flat for five years.
Best in Class Director Compensation Process & Practices
|
Best in Class Director Compensation PROCESS |
|
|
Best in Class Director Compensation PRACTICES |
|
- 1 Analysis excludes privately held companies.
- 2 Total Board Compensation reflects all cash and equity compensation for Board and committee service, excluding compensation for leadership roles such as committee Chair, Lead/Presiding Director, or non-executive Board Chair.
- 3 Audit, Compensation and/or Nominating and Governance committee members.
- 4 Reflects all compensation for committee member service (excludes additional fees for leadership roles), across all Board committees.
- 5 Excludes controlled companies. Also excludes instances where Lead Director role is assumed by Chair of Nominating and Governance Committee, who receives additional compensation for that role.
- 6 Total Board Compensation reflects all cash and equity compensation for Board and committee service, excluding compensation for leadership roles such as committee Chair, Lead/Presiding Director, or non-executive Board Chair.
- 7 Excludes controlled companies. Also excludes instances where Lead Director role is assumed by Chair of Nominating and Governance Committee, who receives compensation for the role.
- Cost of Plan (45% Weighting) – This component will be driven by the SVT model, though ISS will be looking at the cost of plans based on two approaches
- Grants outstanding + shares available for grant + new shares being requested
- Shares available for grant + new shares being requested
- ISS is using this dual approach so as not to put companies who have significant options outstanding at a disadvantage when requesting new shares
- Grant Practices (35% Weighting) – This component will consider burn rate as well as the form of recent grants for the CEO as well as other factors (see ISS link below for complete list)
- Plan Features (20% weighting) – This component will consider factors such as single vs. double trigger on change in control, minimum vesting period, authority for Board to use discretion to vest equity (see ISS link below for complete list)
The results of the scorecard will be compared to relevant benchmark comparison groups[2]. For further details on the EPSC and non-compensation related policies, please visit http://www.issgovernance.com/file/policy/2015USPolicyUpdates.pdf. In addition, to read about CAP’s views on these policies, you can review the comment letter we submitted to ISS at: https://www.capartners.com/news/194/61/Comments-on-ISS-Draft-2015-Proxy-Voting-Policies-U-S
Glass Lewis Released Additional Context and Expectations For “One-Off” Awards
In its 2015 U.S. policy updates related to compensation, Glass Lewis included discussion of how it will analyze special “one-off” awards (e.g., special grants of long-term incentives). While being “wary” of such awards, Glass Lewis has left room to find such awards reasonable with robust disclosure.
“We generally believe that if the existing incentive programs fail to provide adequate incentive to executives, companies should redesign their compensation programs rather than make additional grants…In certain circumstances additional incentives may be appropriate… companies should provide a… convincing explanation of their necessity…”
In its 2015 policy release, Glass Lewis also included some clarification regarding its qualitative and quantitative Say on Pay analysis. For the complete guidelines, visit: http://www.glasslewis.com/assets/uploads/2013/12/2015_GUIDELINES_United_States.pdf
[1] Shareholder Value Transfer assesses the cost of an equity plan relative to a company’s market cap and then compares the cost to industry benchmark
[2] S&P 500, Russell 3000, Non-Russell 3000, Bankrupt companies, recent IPOs as applicable. Burn rate / SVT will be industry specific
The increases that CAP observed in 2013 are much higher than seen last year. In 2012, our study showed almost no change in CEO compensation (-0.3% at median) and a very modest increase in CFO total direct compensation (1.4% at median).
Our findings indicate that the rate of increase in total direct compensation levels for both CEOs and CFOs accelerated in 2012-2013 compared to flat pay increases in 2011-2012. This increase suggests that the economic recovery is having an impact. The higher increase in 2013 among CEOs was driven by larger increases in actual bonuses paid for 2013 and slight increases in long-term incentives (LTI). The slower rate of growth in CFO compensation may signal a leveling off of CFO pay increases – which has been increasing at a faster rate than CEO pay since 2010. On an absolute basis, CFO total direct compensation continues to total approximately one-third of CEO total direct compensation.
Methodology
Our findings are based on a sample of 92 public companies. Similar to prior years, the study analyzes executive pay data disclosed by companies with revenues ranging from $1 to $130 billion, and median 2013 revenues of $8 billion. Only companies with the same CEO and CFO incumbents in the past three years are included allowing us to measure year-over-year changes for individual incumbents. In the past, we excluded financial services firms from the study, since this industry’s compensation practices were evolving in the years after the financial crisis. This year we expanded our sample to include financial services companies in our analysis, because we believe that compensation in the financial services industry has stabilized over the last couple of years.
Study Results
Salaries
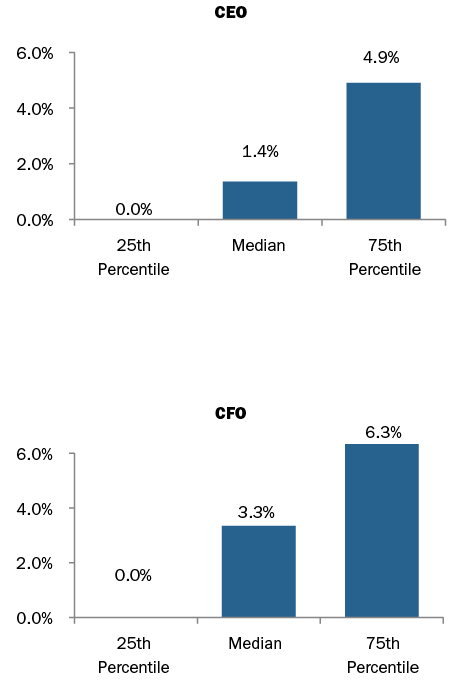
In 2013, approximately 73% of CFOs received salary increases compared to 85% in 2012. The median increase was 3.3% and the 75th percentile increase was 6.3%. In comparison, only 54% of CEOs received salary increases and the increases were smaller — 1.4% at median and 4.9% at the 75th percentile. The number of CEOs receiving a salary increase was similar to 2012. Less frequent and lower salary increases among CEOs may be explained by companies’ hesitancy to increase salaries beyond $1M.
|
% of Executives Receiving Salary Increases |
||||||
|
2010 – 2011 |
2011 – 2012 |
2012 – 2013 |
||||
|
No Increase |
Receiving Increase |
No Increase |
Receiving Increase |
No Increase |
Receiving Increase |
|
|
CEO |
34% |
66% |
47% |
53% |
46% |
54% |
|
CFO |
12% |
88% |
15% |
85% |
27% |
73% |
2013 Salary Increases
Actual Pay Levels
Our findings indicate that the rate of increase in total direct compensation levels for both CEOs and CFOs accelerated in 2012-2013 compared to flat pay increases in 2011-2012, supported by stronger performance in 2013. During 2012-2013, actual total direct compensation (salary plus actual annual incentive plus the grant date value of long-term incentives) for CEOs and CFOs increased by 5.2% and 3.2%, respectively. This year is the first year since 2010 that we see higher median increases in actual total direct compensation for the CEO versus the CFO. In addition to salary increases of 1-3%, annual bonuses were 4-5% higher at median and long-term incentives increased about 3% at median for both CEOs and CFOs.
Absolute CFO total direct compensation levels, on average, continue to be approximately 30% of CEO total direct compensation levels.
|
Median Percentage Change in Pay Components |
||||||
|
2010 – 2011 |
2011 – 2012 |
2012 – 2013 |
||||
|
Pay Components |
CEO |
CFO |
CEO |
CFO |
CEO |
CFO |
|
Salary |
1.8% |
3.5% |
0.5% |
3.0% |
1.4% |
3.3% |
|
Actual Bonus |
0.0% |
3.5% |
-2.8% |
-1.2% |
4.9% |
3.7% |
|
Long-Term Incentives |
10.0% |
10.3% |
0.0% |
2.0% |
3.2% |
3.3% |
|
Actual Total Direct Comp. |
3.6% |
7.5% |
-0.3% |
1.4% |
5.2% |
3.2% |
|
Financial Performance (Median Levels) |
|||
|
Year |
Total Shareholder Return (as of 12/31) |
1-Year Revenue Growth |
1-Year Net Income Growth |
|
2011 |
5% |
9% |
13% |
|
2012 |
14% |
3% |
2% |
|
2013 |
31% |
5% |
12% |
Since this was the first year financial services companies were included, we tested the results without financial services companies and found that the median increase in total direct compensation between the two data sets for CEOs and CFOs was within a 1% difference. However, total cash compensation yielded greater differences. For CFOs of non-financial services companies the median increase in total cash compensation was 1.9% vs. 4.6% median increase of the total sample. For CEOs the median increases were 3.1% vs. 4.2%, respectively. This is due to higher bonus payouts at financial services institutions in 2013.
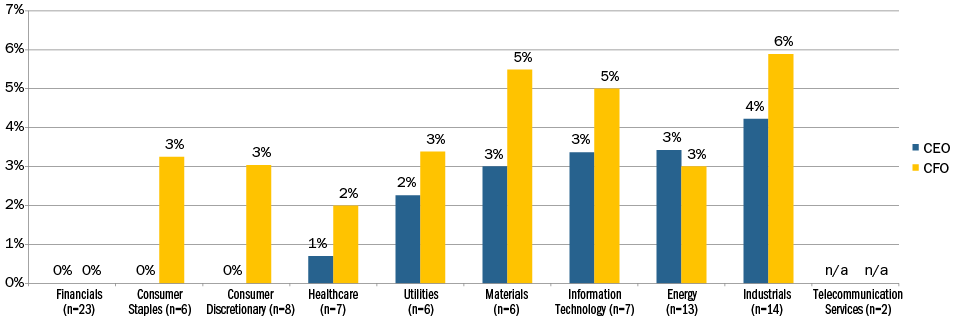
2013 Median Salary Increase by Industry
2013 Median Actual Total Direct Compensation Increase by Industry
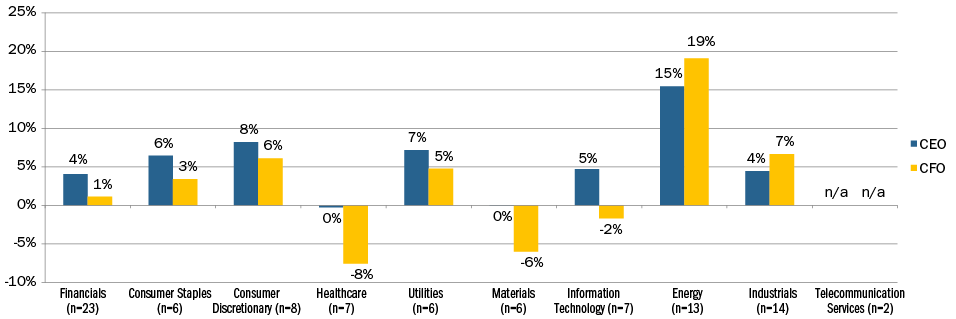
Our study breaks out 2013 CEO and CFO pay by industry classification (Financials, Consumer Staples, Consumer Discretionary, Healthcare, Utilities, Materials, Information Technology, Energy, Industrials, and Telecommunication Services). When looking at median increases in salary for both CEOs and CFOs, they tend to be in the range of 0-3%. Median salary increases over 3% occurred in the Materials and Information Technology industries for CFOs and in Industrials for both CEO and CFO. When looking at actual total direct compensation there is greater volatility in increases, which is primarily driven by industry and company performance.
Target Pay Mix
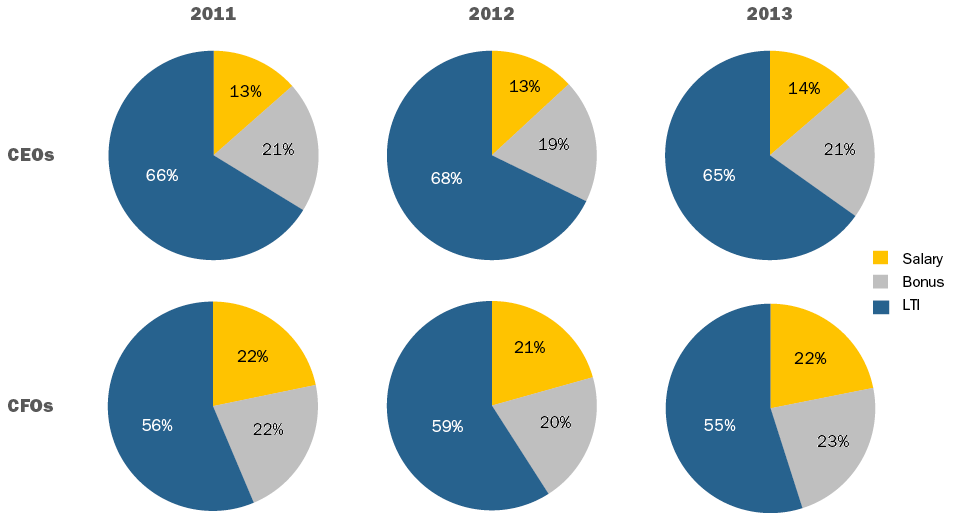
In terms of target compensation levels, the overall pay mix remained largely unchanged from 2011 to 2013. We continue to observe a greater emphasis on at-risk pay for CEOs than for CFOs.
Long-Term Incentive (LTI) Vehicle Prevalence and Mix
LTI vehicle prevalence and mix trends have been fairly consistent over the past few years. The use of at least two long-term incentive vehicles continues to be the majority practice for CEOs and CFOs. The role of stock options has been decreasing slowly in the overall mix with companies delivering about 30% of LTI using this vehicle. On average, performance-based LTI continues to comprise approximately 50% of LTI for CEOs and CFOs. Data continues to show that about 80% of CFOs and CEOs receive some form of performance-based awards as part of their LTI program.
|
# of LTI Vehicles Used |
% in Total |
|
|
CEO |
CFO |
|
|
1 Vehicle |
25% |
27% |
|
2 Vehicles |
49% |
43% |
|
3 Vehicles |
26% |
30% |
|
Average |
2 |
2 |
|
LTI Mix |
2011 |
2012 |
2013 |
|||
|
CEO |
CFO |
CEO |
CFO |
CEO |
CFO |
|
|
Stock Options |
32% |
32% |
30% |
32% |
29% |
29% |
|
Time Vested Restricted Stock |
17% |
22% |
16% |
20% |
19% |
22% |
|
Perf. Based LTI |
51% |
46% |
53% |
48% |
53% |
49% |
Conclusion
Given the improved economy and strong stock market it is not surprising that CEO and CFO pay levels increased in 2013. The fact that CEO pay increased at a faster rate than CFOs for the first time in four years, implies that Compensation Committees are recognizing CEO performance as overall company performance improves. In the future, we expect continued pay-for-performance alignment with CEOs experiencing a greater impact on compensation for good and bad performance.
Among the 44 company sample, median revenue was $11B, median market capitalization was $23B and median 12 month Total Shareholder Return (TSR) was 27% at the end of February 2014.
What We Found
The early findings and trends from these filers generally showed a continuation of trends from the 2013 proxy season. Early in 2014 companies:
- Received high levels of shareholder Say on Pay support
- Awarded CEO bonuses that were slightly higher as a percent of target compared to prior year earned bonuses, and
- Shifted more of the long-term incentive “LTI” program to performance based vehicles and decreased the emphasis on stock options
Say On Pay (SOP) Vote Results
In 2014, all Early Filers that released SOP results to-date (n=38) received majority shareholder support and 87% of companies received greater than 90% support. Among these companies there has been a steady uptick in the level of support at the 25th percentile over the last four years.
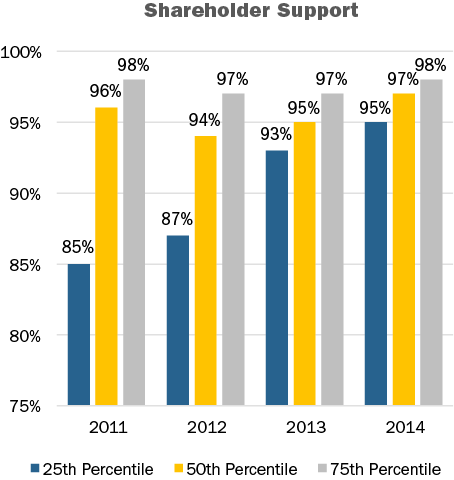
CAP Comment: SOP levels in early 2014 to-date continue to be strong. We expect similar SOP support levels for calendar year-end companies as we approach the 2014 annual meeting dates.
CHANGES IN SHORT AND LONG-TERM COMPENSATION
Base Salary
Among Early Filers, 46% of companies disclosed an increase to the CEO’s base salary in 2013 and the overall average base salary increase was 2.7%.2 CEOs in the Industrials industry received the largest average base salary increase (8.7%) followed by Consumer Staples (3.9%).
CAP Comment: The average executive base salary increase among the Early Filers is consistent with projected merit increases in the broader market where we are generally seeing 3.0% increases for 2014.
Short-term Incentive Payouts
Bonus payouts as a percent of target for the Early Filers increased slightly at the median. The median CEO bonus payout for 2013 was 100% of target compared to 97% in 2012. In general, there was a slight shift upwards in the bonus payouts when compared to the prior year. This is in-line with overall expectations as companies’ earnings and income also had modest growth year-over-year.
|
|
Annual Incentive Payout as a % of Target |
|
|
Summary Statistics |
2012 |
2013 |
|
75th Percentile |
118% |
119% |
|
50th Percentile |
97% |
100% |
|
25th Percentile |
74% |
84% |
51% of Early Filers paid above target in 2013, compared to 46% in 2012. Of the companies that paid above target, median year-over-year increases in revenue, earnings and income growth were in the 10-20% range, compared to 5% for all Early Filers companies.
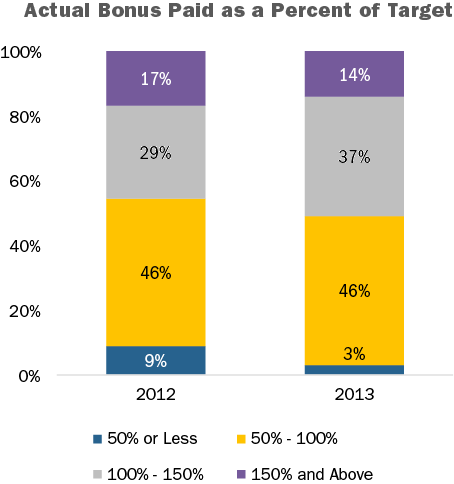
CAP Comment: Year-over-year financial performance results are aligned with CEO bonus payouts for the Early Filers. Companies are putting more time and effort into the goal setting process to ensure an appropriate pay and performance alignment; investors and proxy advisory firms increasingly focus on the performance goals and rigor of the incentive plan targets.
Long-term Incentive Mix
Over the last two years, the portion of the LTI mix delivered in a performance-based vehicle has increased in the general market. Early Filers showed a continuing, consistent shift, placing more emphasis on performance-based LTI and less emphasis on stock options; the weighting on time based restricted stock remained flat.
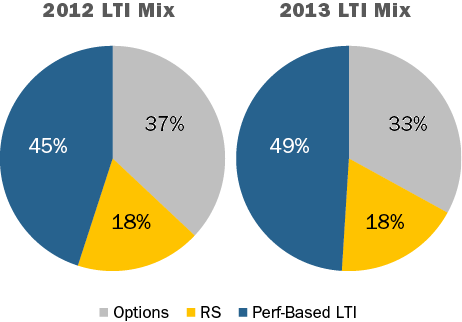
Approximately 85% of the Early Filers use two or three vehicles to deliver their long-term incentives.
CAP Comment: A general trend over the last couple of years has been a de-emphasis on stock options as part of the LTI program and an increase on the portion of performance based LTI. ISS is supporting this shift as they do not consider options to be performance-based.
Disclosed changes to compensation programs and polices
Companies continue to modify their compensation programs as they reassess program features in light of business/strategic changes and/or evolving shareholder and proxy advisory groups’ hot buttons. 36 of the 44 companies (82%) we researched disclosed making a change to their compensation programs or policies. The most prevalent change among the Early Filers was a modification to the company’s benchmarking peer group. Peer group changes are typically a result of companies trying to better align the peer group median size with that of their own company.
|
|
2013 |
% of Cos. |
|
Type of Change Reported in CD&A |
No. of Cos. |
n=44 |
|
Modified peer group |
22 |
50% |
|
Decreased weighting of options in LTI mix |
10 |
23% |
|
Increased weighting on perf.-based LTI |
9 |
20% |
|
Adopted / expanded clawback policy |
6 |
14% |
|
Adopted hedging and/or pledging |
5 |
11% |
Note: Percentages add up to greater than 100% due to multiple responses
CAP Comment: Modifications to a company’s peer group is common as Compensation Committees and management review appropriate peers for benchmarking on an annual or biennial basis. Given that ISS and Glass Lewis consider a company’s peer group when conducting their analyses, it is another reason that assessing the appropriateness of peer companies is a valuable exercise.
Similar to last year, companies continue to modify their clawback policy as a sign of good corporate governance. Companies are not universally waiting for final Dodd-Frank regulations before making adjustments to their policy. The uptick in the disclosure of hedging/pledging policies also continued, and overall, 86% of Early Filers disclose having both. Lastly, 14% of Early Filers voluntarily disclosed a supplemental table, graph or discussion of realized/realizable pay. In-line with CAP’s recent research on this topic and disclosure in 2013 proxies, these companies tend to compare realized/realizable pay with target or Summary Compensation Table pay values, as well as alignment with TSR.
Conclusions
While the Early Filers research is a sneak preview into the upcoming proxy season, we expect to see directionally consistent trends with these changes and practices indicated from our research. Companies are continuing to demonstrate good corporate governance and policies / programs that enhance company performance and pay linkages. Since there have not been significant changes in proxy advisory firm policies or expanded Dodd- Frank legislation, we do not expect to see significant program overhaul in the current proxy season. Companies with low SOP support will likely disclose more significant program modification.
1 Calendar year-end companies were not included in the analysis.
2 Based on companies whose current CEO has held the position for two years.
To address the limitations of SCT and GPBA data, companies have begun to disclose realized and realizable pay (see table below for definitions of realized and realizable pay). In order to evaluate this growing trend, Compensation Advisory Partners (“CAP”) reviewed the 2013 proxy statements of public Fortune 500 companies and tallied the disclosure of realized and realizable pay. For companies that presented a discussion on this topic, we recorded the use of graphics (e.g., tables and charts), we considered what methods companies used to compare different definitions of pay (e.g., vs. SCT/target pay, relative to a peer group, etc.), and we also tracked companies that supplemented their disclosure with the use of performance metrics.
|
Pay Component |
Realized |
Realizable |
|
Time Period |
1 – 5 years |
|
|
Base Salary |
Base salary disclosed in Summary Compensation Table (“SCT”) |
|
|
Bonus |
Actual bonuses/non-equity incentive (annual variable cash incentive) disclosed in the SCT |
|
|
Time-based Equity Awards |
||
|
Stock Options |
Value gained upon exercise for all stock options exercised within measurement period |
Valued at end of performance/measurement period Two alternative approaches: Intrinsic (in-the-money) value of awards granted during measurement period Updated Black-Scholes valuation of awards granted within measurement period |
|
Restricted Stock/Units |
Value at vest for all shares/units that vest within measurement period |
Value at end of measurement period, of all shares/units granted during measured period |
|
Performance-Contingent Equity Awards |
||
|
Stock/Stock Units |
Value upon payout, for all awards that paid during measured period |
Two alternative approaches: Value upon payout, for all awards that paid during measured period Awards granted, vested, and paid out during measured period; if unvested, target value of shares awarded during measured period |
|
Long-term Cash |
Long-term cash incentive payouts during measurement period disclosed in SCT |
Two alternative approaches: Long-term cash incentive payouts during measurement period disclosed in SCT Awards granted, vested, and paid out during measured period; if unvested, target value of long-term cash awarded during measurement period |
Results
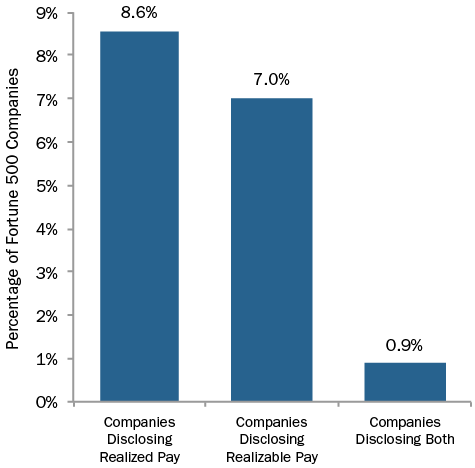
Among our sample of Fortune 500 companies, 15% supplemented the SCT and GPBA with realized and/or realizable pay disclosure. Approximately 9% of our sample disclosed realized pay, 7% disclosed realizable pay, and 1% disclosed both.
Realized Pay Disclosure
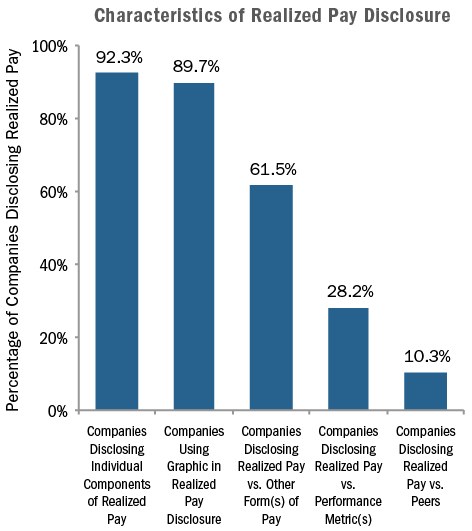
For companies disclosing realized pay, the most common methodology used was base salary actually paid, bonus actually paid, the value of restricted stock that vested during the period, and the value realized upon exercise of options during the period. In a lesser number of cases, companies also included all other compensation and the change in pension value. The majority of companies presented realized pay on an absolute basis (i.e., on an individual company basis, not against peers or some other index). CAP found that of the companies disclosing/discussing the concept of realized pay, most (90%) used some type of chart or table to discuss the concept, 62% compared their realized pay to some other definition of compensation (companies were equally divided between disclosing a comparison of realized pay to SCT pay or to the executive’s target compensation), and approximately 28% of companies compare a performance metric (most commonly TSR) to a graphic depiction of realized pay.
Companies disclosing realized pay had a median cumulative TSR of 7% and 5% on a 1- and 3-year basis, respectively—placing the majority of disclosing companies well below the median of the Fortune 500.
|
|
Cumulative TSR at 12/31/2012 |
|
|
Fortune 500 |
1-year |
3-year |
|
Median |
14.1% |
35.5% |
|
25th Percentile |
1.6% |
2.4% |
|
15th Percentile |
-3.9% |
-6.4% |
|
10th Percentile |
-10.8% |
-18.7% |
|
Companies Disclosing Realized Pay |
|
|
|
75th Percentile |
24.7% |
38.6% |
|
Median |
6.5% |
5.2% |
|
25th Percentile |
-7.8% |
-10.7% |
Realizable Pay Disclosure
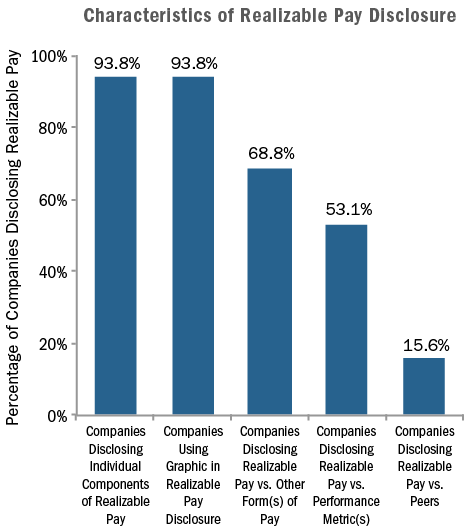
As stated above, among companies that disclosed a supplemental definition of pay, approximately half used some form of realizable pay. Typically, realizable pay is calculated as base salary, actual bonus paid, and long-term incentives granted and valued at the end of the period. For restricted stock, the value is calculated by multiplying the number of shares granted by the stock price at the end of the period. For stock options, the value is most often calculated as the intrinsic (in-the-money) value based on the stock price at the end of the period (Black-Scholes option values are also used, albeit less frequently). For performance shares, the calculation is generally based on the payout for shares granted within the period or the target number of shares granted for awards that have not vested, valued at the end of the period. Most of the companies disclosing used an accompanying table or graph to demonstrate the concept and the most commonly used graphics were: tables or charts showing the side-by-side difference between grant date/target pay vs. realizable pay, realizable pay vs. total shareholder return (TSR), or some combination of the two. Approximately 90% of companies disclosing realizable pay had SCT/GPBA pay data that was greater than realizable pay.
Like realized pay companies, a majority of Fortune 500 companies disclosing realizable pay had 1- and 3-year TSR at 12/31/2012 that trailed the median of the full Fortune 500 group. More specifically, the median TSR of realizable pay companies was slightly above the 25th percentile of the Fortune 500 on a 1-year basis, and between the 15th percentile and 25th percentile on a 3-year basis.
|
|
Cumulative TSR at 12/31/2012 |
|
|
Fortune 500 |
1-year |
3-year |
|
Median |
14.1% |
35.5% |
|
25th Percentile |
1.6% |
2.4% |
|
15th Percentile |
-3.9% |
-6.4% |
|
10th Percentile |
-10.8% |
-18.7% |
|
Companies Disclosing Realizable Pay |
|
|
|
75th Percentile |
19.2% |
37.1% |
|
Median |
1.7% |
-1.8% |
|
25th Percentile |
-15.0% |
-30.0% |
Conclusion
The 2013 proxy season was the first year where we saw a meaningful number of companies disclosing realized and/or realizable pay and with the 2014 proxy season fast approaching, we fully expect to see an increase in supplementary pay disclosure, particularly for those companies with below-average TSR.
Research assistance provided by: Kyle Eastman, Michael Biagi, Ryan Colucci.
Note: For detailed findings or specific company examples, please call or email Eric Hosken at Compensation Advisory Partners. We expect to publish a more comprehensive discussion of the topic in the Q2 2014 World at Work Journal.
Email: [email protected]
Phone: (212) 921-9363