Setting goals for long-term incentives has been a persistent problem for companies and Compensation Committees ever since the reliance on long-term performance plans has increased. However, the results of the recent election take the uncertainty to an entirely new level, right around the time when companies are starting to think about setting goals for their upcoming long-term incentive cycle. Examples of challenges various industries will face include:
Energy & Utilities
- Volatility of energy prices given the views on natural gas and oil
- Environmental regulations (i.e. carbon dioxide emissions)
- Traditional sources of energy vs. renewables
Financial Services
- Dodd-Frank implications
- Movement in interest rates
- Return of Glass-Steagall
Industrial and Materials Companies
- Investment in large infrastructure projects
- Renegotiation of trade deals and increased tariffs on goods
None of the above even touches on the implications for businesses if the administration implements a broad-reaching immigration initiative which can have implications on labor costs or if President-elect Donald Trump is successful at dramatically lowering the corporate tax rate.
In many ways, it is similar to the level of uncertainty companies and Boards were dealing with during and immediately following the financial crisis. As Compensation Committees and management plan for 2017 and beyond, a challenge will be setting goals in a company’s 1- and 3-year incentive plans. As such, Compensation Advisory Partners (“CAP”) outlines four things to think about when setting goals to avoid unintended outcomes and maximize flexibility and accountability.
- Scenario Testing – Run scenarios to test sensitivities and potential outcomes. For example, test what will happen if energy prices go up/down/stay flat and what will happen to payouts under the varying scenarios. Discuss this analysis with the Compensation Committee and establish guiding principles for what is a reasonable payout under the varying scenarios.
- Retrospective analysis – Over periods of uncertainty, companies can meet or miss their goals for many reasons. If the next four years are as volatile as currently expected, Compensation Committees should encourage management to do a retrospective analysis at the end of each performance cycle comparing actual performance to expected performance when goals were set. For example, if the company ultimately delivers $3.00 EPS and the goal was $2.50, did the company get there through true outperformance, because of changes in non-controllable events or because corporate tax rates declined? This retrospective analysis can help guide the Compensation Committee in determining how challenging the goals wound up being and if appropriate, make necessary adjustments to payouts.
- Wider range – As the ability to predict the future diminishes, it can often be helpful to rethink the range around target that justifies a threshold and maximum payout. For example, if a company has a high level of confidence in the ability to achieve planned performance, then they might set a relatively narrow range around target (e.g., 95% of plan for threshold and 105% of plan for maximum). However, if the company has less confidence in the ability to set its plan, a wider range (e.g., 90% of plan for threshold and 110% of plan for maximum) may be more appropriate such that deviation from plan does not have as much as much of an impact on payouts.
- 162m Umbrella Plan – With significant uncertainty it may be challenging to predict what, if any, adjustments a Compensation Committee may want to make to their annual or long-term performance plan. This would be a good time to consider implementing, if you have not already, a 162m umbrella plan to provide the Compensation Committee with flexibility to make adjustments and maintain tax deductibility. An umbrella plan is a structure whereby a bonus is effectively “over-funded” for the Named Executive Officers (“NEOs”) such that the Compensation Committee can determine the final payout with some flexibility as long as the final payout is below the umbrella funded amount. For example, in order to qualify as performance-based compensation, a company could establish a maximum to be paid equal to 3% of net income and specify a percentage of the award pool for the each NEO (excluding the CFO). The Compensation Committee then retains negative discretion to pay less than the maximums established. These umbrella plans are very common for annual incentives, but are less common for long-term plans, though this might be a good time to consider whether one might be appropriate.
There are many other ways of addressing uncertainty around goal setting, but these four tips should help maintain a pay for performance structure, hold management accountable and provide Compensation Committees with appropriate flexibility.
In today’s post Dodd-Frank executive compensation market, most companies are familiar with, and many have implemented, “shareholder-friendly policies” such as clawbacks, hedging/pledging, and stock ownership guidelines. Further, companies have grown increasingly savvy on the executive compensation policies of shareholder advisory firms such as Institutional Shareholder Services (ISS) and Glass-Lewis—specifically as they relate to Say on Pay resolutions (SoP). Most executive compensation professionals—ourselves included—do not deny the influence on voting results when a company receives the dreaded Against recommendation from one or more of the proxy advisory firms. Our research shows that when ISS and Glass-Lewis recommend Against an SoP resolution, there is an approximate 20-30% and 5-15% reduction in the voting results, respectively.
Is this causation or simply correlation? Perhaps that question cannot be answered so easily, but it is possible to study how large institutional shareholders vote on SoP in order to try and understand what factors influence their voting. Companies are already aware of who their largest shareholders are, but an understanding of their voting policies and practices can provide insights on potential shareholder reaction to executive compensation program design, program modifications, and company performance.
To gain a deeper understanding of how large institutional shareholders tend to vote on SoP, CAP compiled a list of the top 25 institutional shareholders (in terms of assets under management) that were invested in at least 250 of the companies in the S&P 500 (“Institutional Shareholders”). CAP collected voting data from Proxy Insight, a leading provider of global shareholder voting analytics.
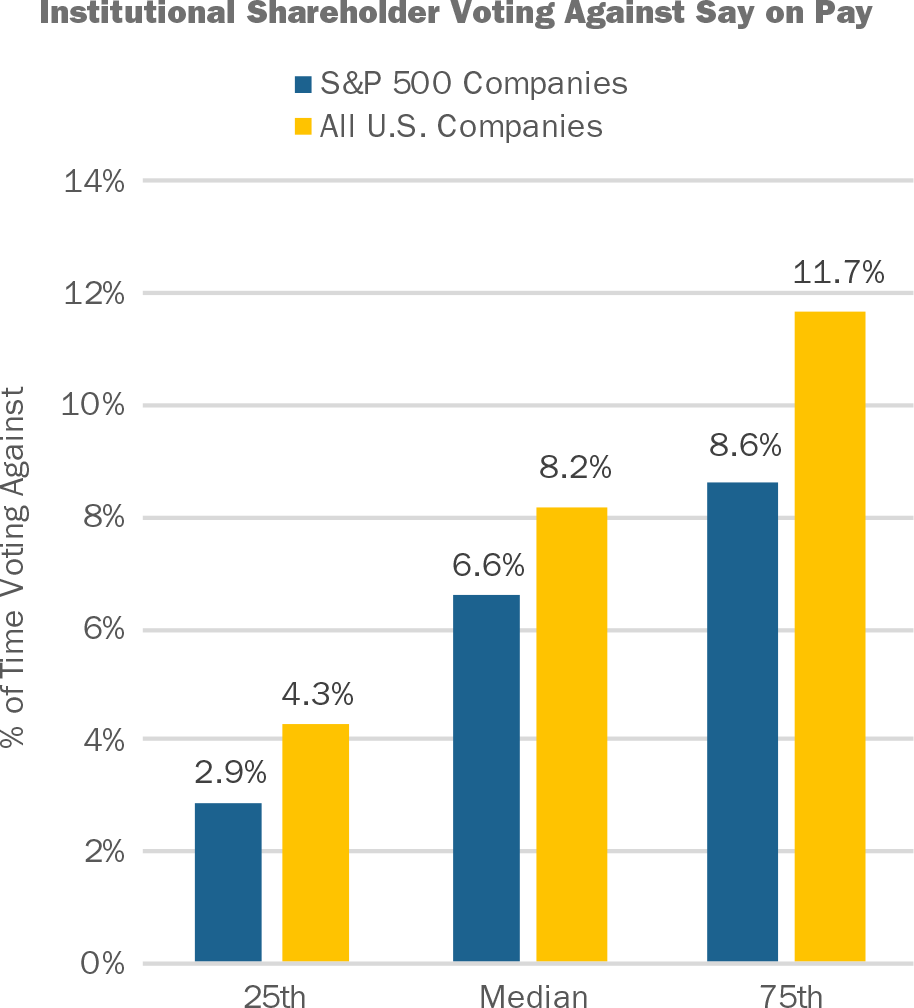
Among these Institutional Shareholders, 92% (23 out of 25) have their own “in-house” voting policies. What that means, is that even if ISS or Glass-Lewis makes a recommendation, the Institutional Shareholder will make the final determination on its voting decision. Based on 2016 voting results, Institutional Shareholders voted Against SoP 6.6% of the time, at median, for S&P 500 companies. When we expanded the scope of our review to all U.S. public companies, we found that Institutional Shareholders voted Against SoP 8.2% of the time, at median.
Source: Proxy Insight
Why do Against votes occur more frequently among all U.S. public companies compared to S&P 500 companies? This outcome could reflect that S&P 500 companies, in the aggregate, are larger and tend to have the resources to develop and maintain more balanced compensation programs. For example, a long-term incentive (LTI) program that is composed of a portfolio of time- and performance-based awards is viewed positively by institutional shareholders and is more common among S&P 500 companies versus all U.S. Companies. S&P 500 companies also have the capacity to lead more extensive shareholder outreach campaigns, which allows them to explain the rationale for their programs.
Although most Institutional Shareholders vote For SoP in most cases, there are some that will vote Against SoP 10% of the time or more. When voting on S&P 500 Companies, 5 out of 25 of the Institutional Shareholders vote Against 10% of the time or more. When voting on all US companies, 11 out of 25 vote Against 10% of the time or more.
|
Institutional Shareholder |
Percent of Time Voting Against SoP |
|
Institutional Shareholders Voting Against S&P 500 Companies 10% of the Time or Greater |
|
|
Robeco/RobecoSAM |
30% |
|
BNY Mellon |
27% |
|
Dimensional Fund Advisors, Inc. |
18% |
|
California Public Employees’ Retirement System (CalPERS) |
16% |
|
Schroders |
10% |
|
Institutional Shareholders Voting Against U.S. Companies 10% of the Time or Greater |
|
|
BNY Mellon |
44% |
|
Robeco/RobecoSAM |
28% |
|
Dimensional Fund Advisors, Inc. |
23% |
|
California Public Employees’ Retirement System (CalPERS) |
20% |
|
Canada Pension Plan Investment Board (CPPIB) |
13% |
|
Schroders |
13% |
|
AllianceBernstein LP |
12% |
|
T. Rowe Price Associates, Inc. |
10% |
|
AXA Investment Managers |
10% |
|
Principal Global Investors LLC |
10% |
|
RBC Global Asset Management, Inc. |
10% |
Source: Proxy Insight
CAP suggests that companies should track the voting tendencies of their major institutional shareholders, particularly if they vote Against more frequently. Companies may want to look at historical voting on SoP and should review their institutional shareholders’ proxy voting guidelines—particularly as it relates to compensation. For example, BNY Mellon voted Against SoP at 27% of S&P 500 companies and Against SoP at 44% of all U.S. companies. A review of BNY Mellon’s proxy voting guidelines states that they “consider proposals on a case-by-case basis in situations where:”
- There are tax gross-ups or make-whole provisions in CIC/severance agreements
- The company has poor relative stock performance, especially when compensation is deemed excessive compared to peers
- The company fails to address compensation issues identified in prior meetings
- There appears to be an imbalance between performance-based and time-based long-term incentive awards
Therefore, if one of your company’s major shareholders is an institutional investor that supports SoP less frequently, it is important to understand their voting guidelines, especially if your executive compensation program has practices or includes features that are viewed negatively (i.e. tax gross ups, 100% time-based LTI program, etc.).
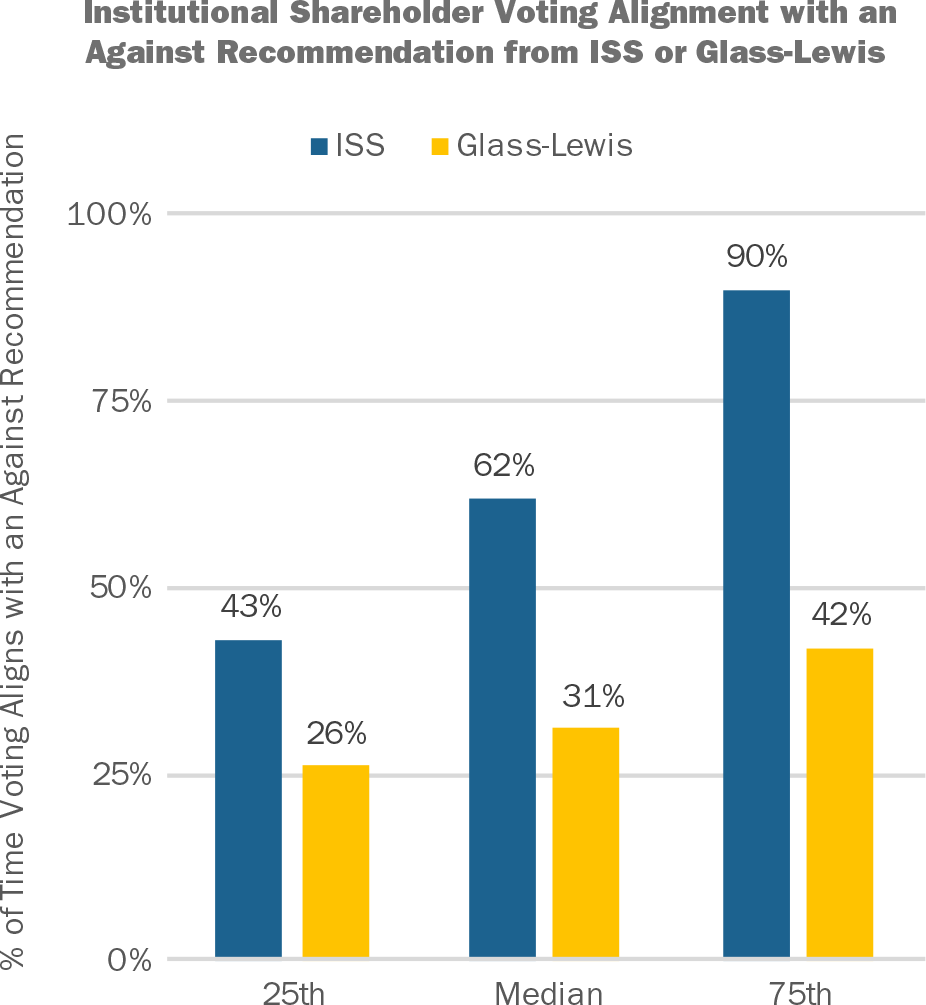
Although most Institutional Shareholders have in-house voting policies, they do still subscribe to proxy advisory research from ISS and Glass-Lewis. Among Institutional Shareholders, 88% (22 out of 25) subscribe to ISS and 48% (12 out of 25) subscribe to Glass-Lewis. While there is only one out of these 25 Institutional Shareholders that generally automatically-votes with ISS (Principal Global Investors LLC), CAP determined that there is a correlation between an ISS or Glass-Lewis Against recommendation and voting results. When subscribing to ISS or Glass-Lewis, we found that Institutional Shareholders’ voting aligns with an Against recommendation, at median, 62% of the time for ISS subscribers and 31% of the time for Glass-Lewis subscribers. The data exhibits a greater correlation (approximately double) of vote alignment with an Against recommendation from ISS than Glass-Lewis. This may occur because Glass-Lewis recommends Against about twice as often as ISS does (16% of companies receive an Against recommendation from Glass-Lewis vs. 8% from ISS).
Source: Proxy Insight
As mentioned above, it is not easy to confirm whether the alignment of an Against recommendation from ISS or Glass-Lewis and voting outcomes is the result of causation or simple correlation—perhaps it is a bit of both. However, when companies are trying to understand the voting practices of their institutional shareholders, knowledge of how their institutional shareholders vote in relation to an ISS or Glass-Lewis Against recommendation is a valuable input, particularly in cases where the alignment is very consistent. Since the recommendation from ISS and Glass-Lewis precedes voting, companies can predict potential outcomes based on shareholder tendencies—particularly in cases where the institutional shareholders voting tendencies are correlated with an Against recommendation a high percentage of the time.
|
Institutional Shareholder |
Percent of Time Voting with Rec. |
|
Institutional Shareholders Voting with ISS Against Rec. Greater than 85% of the Time |
|
|
Deutsche Asset & Wealth Management |
99% |
|
Principal Global Investors LLC |
98% |
|
Canada Pension Plan Investment Board (CPPIB) |
97% |
|
RBC Global Asset Management, Inc. |
97% |
|
Dimensional Fund Advisors, Inc. |
96% |
|
AllianceBernstein LP |
91% |
|
BNY Mellon |
87% |
|
Institutional Shareholders Voting with Glass-Lewis Against Rec. Greater than 50% of the Time |
|
|
California Public Employees’ Retirement System (CalPERS) |
75% |
|
Dimensional Fund Advisors, Inc. |
60% |
|
BNY Mellon |
57% |
Source: Proxy Insight
In examples where Institutional Shareholders do not have a high correlation of voting with an ISS or Glass-Lewis Against recommendation, this can generally be attributed to those Institutional Shareholders that vote For SoP a high percentage of the time in line with their own voting policies.
In our view, it is important for companies to develop a compensation program that aligns with the business strategy, promotes shareholder growth while minimizing risk, and attracts and retains key talent. Once a framework is established, companies can then overlay an understanding of the voting practices of their institutional shareholders, including specific proxy voting guidelines, voting history, as well as the alignment of voting results with ISS or Glass-Lewis recommendations. This becomes more important in cases where the institutional shareholder votes Against SoP more frequently than the norm or follows ISS and Glass-Lewis recommendations a very high percentage of the time. While some companies may engage in comprehensive shareholder outreach programs, other companies do not have the resources for large-scale shareholder engagement. For these companies, an understanding of their institutional shareholder voting policies and practices becomes an important consideration when it comes to compensation program plan design.
Appendix
|
Institutional Shareholders Used in this Analysis |
|
|
AllianceBernstein LP |
Legg Mason Partners Fund Advisor, LLC. |
|
AXA Investment Managers |
MFS Investment Management, Inc. |
|
BlackRock |
Morgan Stanley Investment Management, Inc. |
|
BNY Mellon |
Norges Bank Investment Management |
|
California Public Employees’ Retirement System (CalPERS) |
Northern Trust Investments |
|
Canada Pension Plan Investment Board (CPPIB) |
Principal Global Investors LLC |
|
Deutsche Asset & Wealth Management |
RBC Global Asset Management, Inc. |
|
Dimensional Fund Advisors, Inc. |
Robeco/RobecoSAM |
|
Federated Investment Management Co. |
Schroders |
|
Fidelity Management & Research Co. |
SSgA Funds Management, Inc. (State Street) |
|
Fidelity SelectCo |
T. Rowe Price Associates, Inc. |
|
Franklin Templeton Investments |
Vanguard Group, Inc. |
|
Goldman Sachs Asset Management LP |
|
Today, Institutional Shareholder Services (ISS) announced a methodology update to its CEO pay-for-performance assessment for U.S. companies. Beginning February 1, 2017, ISS proxy research reports will include a new standardized comparison of a company’s financial performance relative to its ISS-defined peer group.
This is a departure from ISS’ sole reliance on Total Shareholder Return (TSR) as a metric. ISS will measure multiple financial metrics which may include Return on Equity, Return on Assets, Return on Invested Capital, Revenue growth, EBITDA growth and Cash Flow (from Operations) growth; these metrics will supplement TSR, but only in the qualitative assessment. ISS will calculate a weighted average of select financial metrics; measures (and weightings) will be based on a company’s four-digit GICS industry group. For 2017, the new financial assessment will not be included in the quantitative assessment although ISS may incorporate a company’s relative financial performance in its qualitative discussion.
This is a significant change to ISS’ pay-for-performance methodology which primarily assesses performance based on Relative TSR. While the additional financial metrics will not be included in the quantitative assessment for the 2017 proxy season, it can provide shareholders with additional context of a company’s overall financial performance. The implication is that TSR will still drive a company’s specific level of concern in the quantitative tests. However, if the company’s financial metrics are not aligned with their stock performance, it could weigh heavily on whether they receive a “For” or an “Against” recommendation from ISS on the Say on Pay vote. Examples where this new policy could help a company is if the market has overreacted to news or industry shifts, but the underlying financials are still relatively strong. When ISS releases the details on the definition and weightings of each financial metric, it will be important for a company to model the financial performance relative to the ISS-defined peer group to understand how its performance will be viewed relative to comparators.
With this updated methodology, however, realizable pay will become increasingly more important in a company’s overall pay-for-performance assessment. By taking a more holistic look at stock and financial performance, ISS may more appropriately capture the linkage between actual compensation earned and the underlying financial performance.
Additionally, ISS has historically relied on S&P to provide financial data, which does an effective job at creating comparability across companies financials. However, they are typically limited in the adjustments they can make across companies (ISS will likely use GAAP definitions, where applicable) and, therefore, a company’s view of its relative performance (which may include adjustments) could differ from ISS. This could be true where there are significant differences between a company’s peer group and the ISS peer group, particularly for companies with a cross-industry peer group (which are more commonly used with large cap companies).
In addition to incorporating financial performance metrics, ISS also announced that it will no longer include companies with less than two years of TSR and pay data in the Relative Degree of Alignment (RDA) assessment. This change will only impact newly public companies.
The 2010 Dodd-Frank Wall Street Reform and Consumer Protection Act (“Dodd-Frank”) directed the SEC to enact rules that require disclosure in the annual proxy statement of the ratio of Chief Executive Officer (CEO) compensation to that of the median employee, including the absolute value for each input that goes into the ratio calculation. More than five years later, final pay ratio rules have been released by the SEC. These rules will go into effect requiring companies to provide disclosure of their pay ratios for their first fiscal year beginning on or after Jan. 1, 2017.
While many companies are preparing for the new pay ratio disclosure requirements from the SEC, ratios of CEO pay to other NEOs are also something companies should pay close attention to. Committees can use these ratios as a starting point to assess issues such as retention, talent development, and succession planning. A high ratio can be an indicator that the CEO is potentially carrying too much of the company, a disconnect exists between the pay practices for the CEO vs. other senior leaders, or that there is no succession plan in place. Having healthy internal equity with appropriate ratios of pay for leadership, and an eye on general market norms, is an important factor in talent acquisition and retention.
This CAPflash focuses on three NEO pay ratio calculations:
- CEO versus Chief Operating Officer (COO);
- CEO versus Chief Financial Officer (CFO); and
- CEO versus General Counsel (GC).
In this study, we provide market practice among S&P 500 companies, as well as the policies of proxy advisory firms, ISS and Glass-Lewis. In our analysis, we use the following target pay elements per proxy disclosure: disclosed base salary, target annual incentive, and target/grant date value of LTI awards.
Please note that the ratios used in this analysis are calculated from proxy disclosure. Therefore, if a COO or GC is not among the top 5 highest paid, as required in proxy disclosure, they are not included in the analysis—CFO pay disclosure is required.
What does our research show?
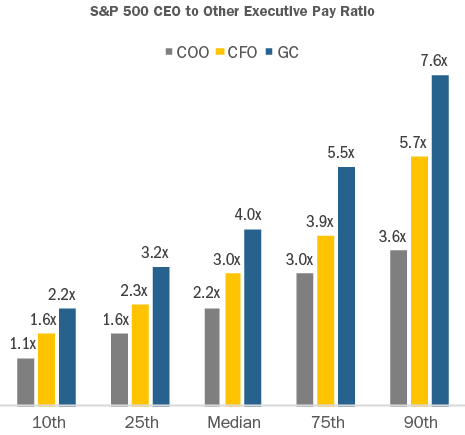
To evaluate market norms, Compensation Advisory Partners (“CAP”) conducted an analysis of senior executive target pay ratios among S&P 500 companies during the most recent three fiscal years (as of August 22, 2016).
- At median, CEO pay was 2.2x the COO; i.e., for every $1.00 paid to the COO, the CEO was paid approximately $2.20
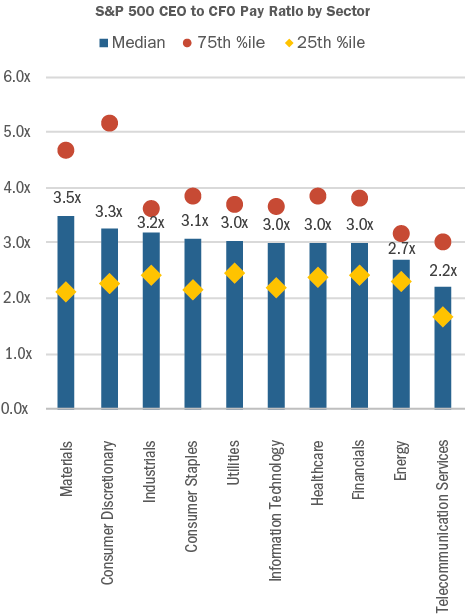
- At median, CEO pay was 3.0x the CFO; i.e., for every $1.00 paid to the CFO, the CEO was paid approximately $3.00
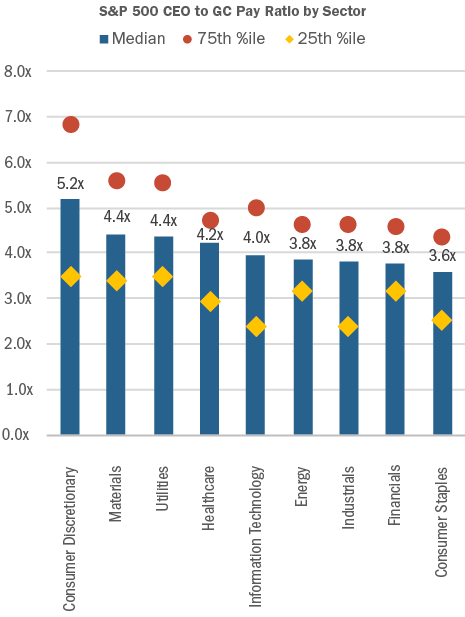
- At median, CEO pay was 4.0x the GC; i.e., for every $1.00 paid to the GC, the CEO was paid approximately $4.00
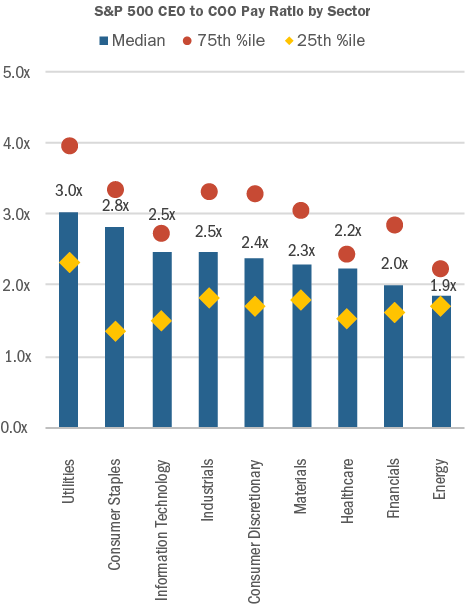
CAP also analyzed the S&P 500 senior executive pay ratios by industry.
- For the CEO vs. COO ratio, the Utilities sector had the highest ratio of 3.0x at median, while Energy had the lowest ratio of 1.9x at median
- For the CEO vs. CFO ratio, the Materials sector had the highest ratio of 3.5x at median, while Telecommunication Services had the lowest ratio of 2.2x, at median
- For the CEO vs. GC ratio, the Consumer Discretionary sector had the highest ratio of 5.2x at median, while Consumer staples had the lowest ratio of 3.6x, at median
Note: Telecommunication Services was not included because the sample was too small.
Note: Telecommunication Services was not included because the sample was too small.
How do ISS and Glass-Lewis use pay ratios?
Both proxy advisory firms include senior executive pay ratios in their annual proxy analyses.
- ISS includes the ratio of CEO pay versus the second highest paid active NEO, as well as the ratio of CEO pay versus the average of the other active NEOs. “Pay” includes all elements from the Summary Compensation Table; however, the grant-date value of stock options is updated to reflect ISS’ methodology which differs from accounting rules
- Glass-Lewis includes the ratio of CEO pay versus the average of other NEOs during each of the past three years. “Pay” includes select elements from the Summary Compensation Table: Salary, Bonus, Non-Equity Incentive Plan, Stock Awards, and Option Awards
ISS also uses pay ratio as one of the inputs to the Compensation score it assigns companies in its QuickScore 3.0 tool, which is meant to influence investment decisions through an assessment of risk factors. The ratio of CEO pay versus the second highest paid active NEO is included in QuickScore 3.0.
When do proxy advisors perceive there to be a possible issue?
To our knowledge, these ratios have not been used by ISS or Glass-Lewis to justify an Against Say on Pay vote recommendation. However, large pay discrepancies can reinforce other negative assessments. In general, comments from ISS and Glass-Lewis are likely when the CEO to NEO ratio exceeds 4x. Ratios exceed 4x at 5-10% of S&P companies, depending on which ratio is used (see ISS and Glass-Lewis definitions above). Ratios rising to 5-6x, or greater, will receive more strongly worded commentary.
Conclusion
Since companies are very different in their organizational and operational structures, we believe that there is limited utility in the CEO pay ratio disclosure that will be required by the SEC under Dodd-Frank. However, looking at the ratios of leadership pay at companies in the same business sector and/or of the same size, can provide important information and insights. It is worthwhile for compensation committees to track this information internally and on a relative basis. Such information can be used as an input in the pay benchmarking process and as a barometer of healthy succession planning, as well as contributing to effective talent acquisition and retention.
Each year CAP analyzes non-employee director compensation programs among the 100 largest companies. We believe these companies provide insight into where the market will be going in terms of practices. Below is a summary of trends – for pay levels and pay practices – based on 2016 proxy filings.
Key CAP Findings
Board Compensation. pay levels went up
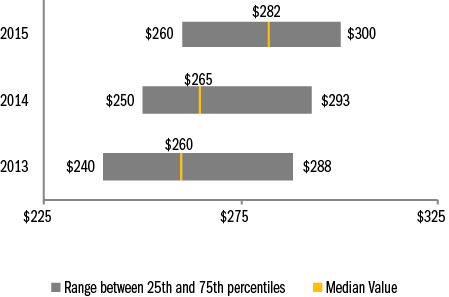
- Total Fees. Increased 6 percent (median is $282K, versus $265K in prior year), which is the biggest single year increase we have seen in more than 4 years, though still within historic norms
- Retainers. Large companies rely on annual retainers (cash and equity) to compensate directors. Pay programs are typically simple and viewed more as an “advisory fee” than an “attendance fee.”
- Meeting fees. Provided by only 11 percent of companies (versus 12 percent in prior year). In general, companies have moved to a fixed retainer pay structure, with a component in cash and a component in equity. We support this approach as it simplifies administration and the need to define “what counts as a meeting.” However, companies may want to consider having a mechanism for paying meeting fees if the number of meetings in a single year far exceeds the norm. For example, if the number of meetings is well above historic norms (e.g., 12 meetings/year), companies could consider paying meeting fees above a specified number of meetings. Three companies in our dataset use this approach to meeting fees.
- Equity. Full-value awards (shares/units) are most common. Only 8 percent of companies use stock options with, surprisingly, only one of these companies being in the traditional technology sector. 97 percent of companies denominate equity awards (stock or options) as a fixed value, versus a fixed number of shares, which is considered best practice as it manages the value each year. Approximately two-thirds of equity awards vest within 1 year of grant (either immediately or cliff vest after 1 year). Nearly 60 percent of equity awards settle at vest, with the remainder settling at or post retirement.
- Pay Mix. On average, 61 percent equity-based versus 39 percent cash-based. Alignment with long-term shareholders is reinforced by delivering a majority of compensation in equity.
Committee Member Compensation. little/no change
- Overall Prevalence. Only 48% of companies paid committee-specific member fees, relying on board-level compensation to recognize committee service, with the general expectation being that all independent directors contribute to committee service needs1.
- Total Fees. Of the companies that pay committee member compensation, the median is $16.8K.
Committee Chair Compensation. little/no change
- Overall Prevalence. Approximately 90 percent of companies provide additional compensation to committee Chairs, typically through an additional retainer and not meeting fees, to recognize additional time requirements, responsibilities, and reputational risk1.
- Fees. At median, $20K in additional compensation (vs. members) was provided to Audit and Compensation Committee Chairs, and $15K additional to Nominating/Governance Committee Chairs.
Independent Board Leader Compensation. little/no change
- Non-Exec Chair. Additional compensation is provided by all companies with this role, $225K at median. As a multiple of total Board Compensation, total Board Chair pay is 1.9x a standard Board member, at median.
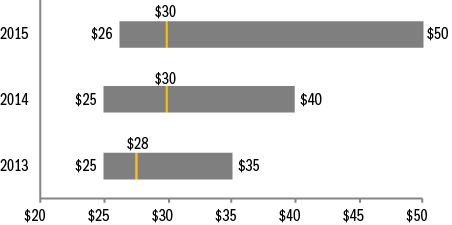
- Lead Director. Additional compensation – $30K, at median – is provided by nearly all companies with this role3. The differential in pay versus non-executive Chairs is in line with typical differences in responsibilities. 75th percentile additional compensation was $50K, up from $40K last year and up from $35K two years ago.
Pay Limits. prevalence of limits went up
- There were 17 companies in our data set that amended an equity plan this year; 2 of these companies already had a shareholder approved limit in place for director compensation. Among the remaining 15 companies, 9 of them (60 percent) implemented a new shareholder approved limit for director compensation.
- In total, 39 percent of the largest 100 companies now have such limits, up from 27 percent in prior year.
- Limits range from $250K to $3.6 million, and were $760K at median. Among companies that denominate the limit in shares, the median is $1.05M, while the median for the companies with value-based limits is $525K.
- Limits typically apply to just equity-based compensation; however, some companies have applied the limits to both cash and equity-based compensation (i.e., total pay) and we anticipate the prevalence of this practice will increase further. Other companies exclude initial at-election equity awards, committee Chair pay, and/or additional pay for Board leadership roles from the limit.
- The limits are largely due to advancement of litigation where the issue has been that directors approve their own annual compensation and are therefore inherently conflicted. Companies have a stronger legal defense – protecting them under the business judgement rule – by having “meaningful limits” approved by shareholders on the maximum award that could be granted to a director. The “business judgment rule” is judicial presumption that directors acted “on an informed basis, in good faith and in the honest belief that the action taken was in the best interests of the company.” An action protected by the business judgment rule will not be second-guessed by the courts. There is a chance that the business judgement rule can be called into question without a meaningful limit. When the business judgment rule does not protect directors’ awards of compensation to themselves, the awards are subject to heightened scrutiny under the “entire fairness test” under which both the process and the amount of the compensation must be found to be entirely fair to the company.
Appendix
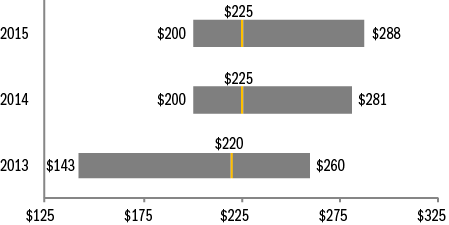
Total Board Compensation ($000s)
Equity Compensation
|
Equity Vehicle |
2013 |
2014 |
2015 |
|
Full-Value Equity (Shares/Units) |
95% |
96% |
92% |
|
Stock Options |
2% |
1% |
1% |
|
Both |
3% |
3% |
7% |
|
Award Denomination |
2013 |
2014 |
2015 |
|
Fixed Valued |
88% |
90% |
92% |
|
Fixed Shares |
8% |
6% |
3% |
|
Both |
4% |
4% |
5% |
Additional Compensation for Independent Board Leaders ($000s)
Lead/Presiding Directors
Non-Executive Chairs
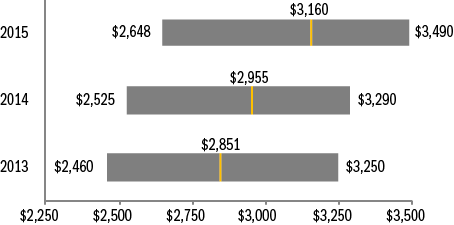
Total Company Cost for Board Service ($000s)
1 Audit, Compensation and/or Nominating and Governance committees.
2 Excludes controlled companies. Also excludes instances where Lead Director role is assumed by Chair of Nominating and Governance Committee, who receives compensation for the role.
ISS released the results of its 2016-2017 policy survey on September 29, 2016. The survey results will play an important role in shaping ISS’ policies for the 2017 proxy season. ISS Indicated that a draft of their 2017 policy updates will be published in late October, subject to public comment. Final policy updates are scheduled for publication in mid-November, with policy updates effective February 1, 2017.
417 organizations participated in ISS’ survey, including 115 institutional investors and 270 corporate issuers. 33% of investor responses came from institutions with $100 billion in assets or more, while 25% came from institutions with $10 – $100 billion in assets.
Highlights of the survey results related to U.S. executive compensation and corporate governance topics are summarized below:
Say on Pay Frequency: Survey participants were asked whether they favored annual, biennial or triennial say on pay proposals. Fully 66% of investors favored annual say on pay votes. Corporate issuers were more likely to favor biennial or triennial votes, but fully 42% voted for annual say on pay proposals. Based on the results of the survey, we do not expect ISS to make any changes to its existing policy of supporting annual say on pay vote frequency.
Metrics for Pay-for-Performance Alignment: ISS currently uses Total Shareholder Return (“TSR”) to assess pay-for-performance alignment, measuring relative TSR performance compared to peers over 3 years and measuring the absolute trend in TSR over 5 years. Survey participants were asked if other metrics should be incorporated in the initial screen. High levels of support were recorded for metrics other than TSR, with 79% of investors and 68% of corporate issuers voting in favor.
Investors identified Return on Investment metrics, such as Return on Invested Capital (ROIC), as the best metrics to be incorporated into pay-for-performance alignment screens. Detailed results are shown below:
|
Metrics |
% of Investors Favoring |
% of Non-Investors Favoring |
|
Return on Investment metrics |
47% |
23% |
|
Other Return metrics (i.e, ROA or ROE) |
35% |
18% |
|
Earnings metrics |
26% |
38% |
|
Cash Flow metrics |
25% |
20% |
|
Economic Profit metrics |
22% |
9% |
|
Revenue metrics |
18% |
24% |
|
Other metrics |
16% |
10% |
We suspect that ISS may modify its pay-for-performance model to incorporate additional measures in the future, based on this feedback. However, it may be challenging to implement for the coming year as it is difficult to find a single financial performance measure that is useful for performance comparisons in all industries. We will closely monitor ISS’ proposed policy revisions to see what changes, if any, that they make to the pay-for-performance assessment.
Board Refreshment: Lack of board refreshment is viewed as problematic by more than 50% of investors. Refreshment measurements that caused concern include lack of newly appointed directors (i.e., within the last 5 years), average tenure greater than 10 or 15 years and/or a high proportion of directors with long tenure.
Overboarding: More than 60% of investors indicated a preference for applying the same standard for overboarding to active executive chairs as currently applies to active CEOs – no more than three total boards. A minority supported the more lenient standard applicable to non-executive directors – no more than five total boards.
Next Steps
We will monitor ISS’ draft policy proposal (expected in October) and final policy issuance (expected in November) and will provide an updated CAPflash highlighting any material changes from ISS’ current policies. Based on this year’s survey results, there is potential for significant changes from the current policy, particularly for Pay-for-Performance alignment. Movement away from TSR as the sole metric would be welcomed by many companies as well as by most investors.
Full results of ISS’ policy survey can be found at www.issgovernance.com. If you wish to discuss the results, you can reach us at 212-921-9350.
Annually, Compensation Advisory Partners (CAP) evaluates pay levels for Chief Financial Officers (CFOs) and Chief Executive Officers (CEOs). This year, the analysis is based on a sample of 100 companies with median revenues of $13 billion. For more information on criteria used to develop the sample of companies, please see Appendix.
Highlights
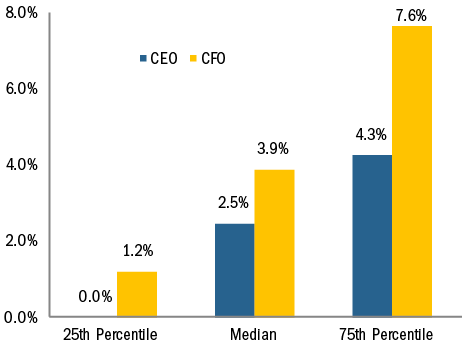
- Annual salary increases are increasing in prevalence for the third year in a row among CEOs and CFOs, with median increases of 2.5% and 3.9% respectively
- Similar to prior years, salary increases are provided much more frequently to CFOs than to CEOs, with over three quarters of CFOs studied receiving a salary increase in 2015
- The 2015 median increases in actual total direct compensation (i.e., cash plus equity) for both CEOs and CFOs were modest, 2.2% and 1.4% respectively
- At median, there was no growth in actual bonuses, partly reflective of a weaker performance year in 2015 vs 2014
- Median target bonus opportunities were flat for CEOs over the past 3 years; for CFOs median target bonuses were flat in 2015 after an increase from 2013 to 2014
- Growth in long-term incentive opportunities at median was in the mid-single digits for both positions
- CFO total compensation on an absolute basis approximates one-third of CEO total compensation, consistent with our findings in prior years
- Long-term incentive program structure has remained consistent over the past few years; performance-based equity continues to represent the largest component of LTI for CEOs and CFOs
Study Results
Salaries
In the last three years, we have seen a steady growth in the number of CEOs and CFOs receiving salary increases in a given year. Only 48% and 69% of CEOs and CFOs, respectively, received increases for the 2012-2013 period compared with 58% of CEOs and 77% of CFOs for the 2014-2015 period. Median 2015 salary increases were 3.9% for CFOs and 2.5% for CEOs.
|
% of Executives Receiving Salary Increases |
||||
|
2013 – 2014 |
2014 – 2015 |
|||
|
No Increase |
Receiving Increase |
No Increase |
Receiving Increase |
|
|
CEO |
49% |
51% |
42% |
58% |
|
CFO |
28% |
72% |
23% |
77% |
2015 Salary Increases
Actual Pay Levels
Based on our findings, the median rate of increase in actual total direct compensation levels for both CEOs and CFOs was approximately 2% for 2015. The median increases over the last two years ranged between 3% and 5%. The lower increases in total compensation for 2014-2015 are partially a result of no increase in bonuses, at median, and only slightly higher single digit increase in long-term incentives.
|
Median Percentage Change in Pay Components |
||||
|
2013 – 2014 |
2014 – 2015 |
|||
|
Pay Components |
CEO |
CFO |
CEO |
CFO |
|
Salary |
0.3% |
3.0% |
2.5% |
3.9% |
|
Actual Bonus |
4.3% |
7.8% |
0.0% |
-0.1% |
|
Long-Term Incentives |
3.7% |
4.2% |
6.8% |
7.6% |
|
Actual Total Direct Compensation |
3.2% |
5.2% |
2.2% |
1.4% |
As seen in the table above, the median 2015 increases by pay component were similar for both CFOs and CEOs. Similar to actual bonuses, median target bonuses remained flat for both CFOs (100% of base salary) and CEOs (150% of base salary).
|
Target Bonus as % of Salary |
||||
|
2014 |
2015 |
|||
|
CEO |
CFO |
CEO |
CFO |
|
|
75th Percentile |
165% |
105% |
180% |
120% |
|
Median |
150% |
100% |
150% |
100% |
|
25th Percentile |
125% |
80% |
130% |
80% |
Median Salary Increase by Industry
Median Actual Total Compensation Increase/Decrease by Industry
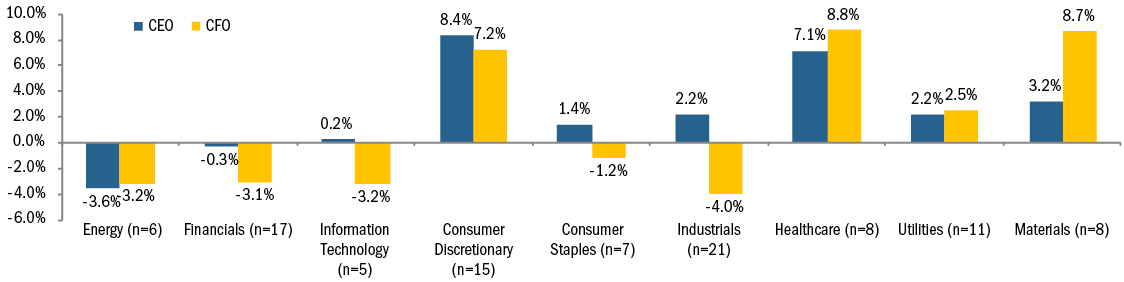
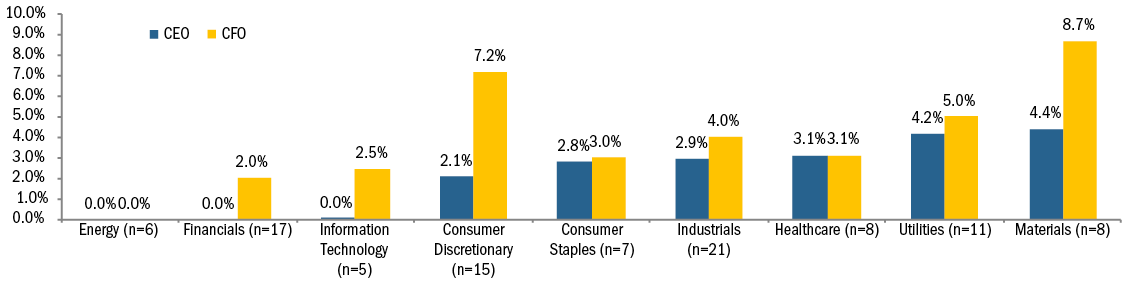
Median salary increases in salary are generally aligned for CEOs and CFOs within each specific industry, except for the Consumer Discretionary and Materials industries. Among the Consumer Discretionary industry, the median CEO increase was 2.1% compared to the CFO median increase of 7.2%. In the Materials industry, the median CEO increase was 4.4% compared to the CFO median increase of 8.7%. The Energy industry increases were 0% for both CFOs and CEOs. The salary freeze in the industry comes as no surprise given that some companies in the industry implemented salary freezes for 2015 after oil prices collapsed.
Differences by industry were more pronounced when looking at actual total direct compensation. There were more decreases in CEO or CFO total actual compensation in 2015 compared to 2014, primarily driven by weaker company performance and the annual incentive award paid as a result of performance. The Energy industry was the single industry where both CFOs and CEOs experienced similar declines in compensation, at median. Some of the largest increases in compensation levels were observed in Consumer Discretionary, Healthcare and Materials.
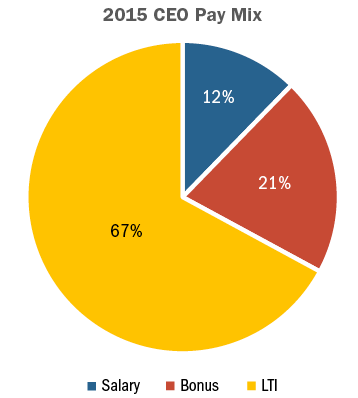
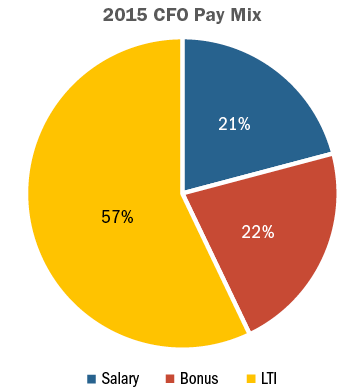
Target Pay Mix
The structure of the overall pay program (salary, bonus, LTI) has remained largely unchanged since 2011. CEOs continue to receive less in the form of salary and more in variable pay components, especially LTI, than CFOs.
Long-Term Incentive (LTI) Vehicle Prevalence and Mix
We have seen very little change in the type of vehicles used to deliver LTI awards. Overall LTI mix also remains similar to the past several years. The majority of companies continue to use two different vehicles to deliver long-term incentives to CEOs/CFOs with approximately a quarter of companies studied using all 3 equity vehicles (stock options, time-based stock awards, and awards under a performance plan)
Performance plans account for roughly 50% of LTI awards on average. The other half of LTI is delivered almost equally between stock options and time-vested restricted stock awards. The overall weighting of performance-based awards (performance plans and stock options) for both CEOs and CFOs continues to range between 75% – 80%.
|
LTI Mix |
||||
|
2014 |
2015 |
|||
|
CEO |
CFO |
CEO |
CFO |
|
|
Stock Options |
26% |
25% |
24% |
23% |
|
Time Vested Restricted Stock |
21% |
26% |
20% |
25% |
|
Performance Plans |
53% |
49% |
56% |
52% |
Conclusion
2015 was not as strong a performance year as 2014. Median revenue growth was -1% (vs 6% in 2014), net income growth was -1% (vs 9% in 2014) and total shareholder return was -2% (vs 16% in 2014). Overall total pay increases were also smaller than in 2014, which we believe were directionally aligned with performance. While salary and long-term incentive increases for CFOs were slightly higher in 2015, actual bonus amounts were flat. This pattern was similar for CEOs in the study.
We expect overall pay mix to continue to emphasize the variable, at-risk components of pay. We also expect the current approach to delivering long-term incentives, with an emphasis on performance-based LTI plans to continue. In this era of increased scrutiny and Say on Pay, we anticipate that aligning pay outcomes with company performance will continue to be an imperative for companies and Boards.
APPENDIX
Sample Screening Methodology
Based on the screening criteria below, we arrived at a sample of 100 public companies with median 2015 revenue of $13B.
|
Revenue |
At least $5B in revenue for fiscal year 2015 |
|
Fiscal year-end |
Fiscal year-end between 9/1/2015 and 1/1/2016 |
|
Proxy Statement Filing Date |
Proxy statement filed before 3/31/2016 |
|
Tenure |
No change in CEO and CFO incumbents in the past three years |


