- Evaluation of Executive Pay (Management Say on Pay)
- Board Response to the Management Say on Pay (MSOP) vote and the MSOP Frequency vote
- Developing a voting policy for recent IPO companies 162(m) approvals
Below CAP summarizes the key policy changes and we also provide perspective on the key implications for companies to consider.
Evaluation of Executive Pay
Current Pay-for-Performance Analysis Approach
Companies with one- and three-year total shareholder returns (TSR) below the median of their 4-digit GICS industry group are reviewed by ISS for potential pay-for-performance disconnects. For these companies, ISS conducts a qualitative assessment to determine if pay and performance are misaligned. The factors reviewed include year-over-year change in CEO pay and trends in CEO pay and company TSR over 5 years.
Updated Pay-for-Performance Evaluation
The approach for 2012 continues to have quantitative and qualitative components. The quantitative analysis reviews three factors in two categories (for companies in the Russell 3000 index):
- Peer Group Alignment – Two factors are analyzed to determine the pay-for-performance alignment relative to a peer group that is generally comprised of 14-24 companies selected using market cap, revenue (or assets for financial firms), and GICS industry group. The selection process is designed to identify peers that are closest to the subject company, and where the subject company is close to median of the peer group in revenue/asset size. ISS will disclose its peer group methodology and rationale in various communications leading up to the 2012 proxy season.
- The degree of alignment between the company’s TSR rank and the CEO’s total pay rank within the peer group, as measured over one-year and three-year periods (weighted 40/60, to put more emphasis on the longer term)
- The multiple of the CEO’s total pay relative to the peer group median
- Absolute Alignment – this factor measures long-term alignment between pay and company performance, as:
- Alignment between the trend in the CEO’s pay and the company’s TSR over the prior five fiscal years – i.e., the difference between the trend in annual pay changes and the trend in annualized TSR changes during the prior 5-year period
There is no explicit description of the relative importance of the peer group alignment and absolute alignment in ISS’ evaluation. If ISS’ analysis finds that the above analysis demonstrates a weak alignment between pay and performance, ISS will conduct a qualitative review before issuing a final vote recommendation.
Considerations for the qualitative review include:
- The ratio of performance- to time-based equity awards
- The ratio of performance-based compensation to overall compensation
- The completeness of disclosure and rigor of performance goals
- The company’s peer group benchmarking practices
- Actual results of financial/operational metrics, such as growth in revenue, profit, cash flow, etc., both absolute and relative to peers
- Special circumstances related to, for example, a new CEO in the prior FY or anomalous equity grant practices (e.g., biannual awards)
- Any other factors deemed relevant
It should be noted that except in extenuating circumstances, ISS indicates that there is no longer a “new” CEO exclusion from the pay-for-performance evaluation.
In the spirit of transparency, ISS will provide additional guidance on the 2012 Pay-for Performance methodology in a technical document that is scheduled for release in December.
ISS Intent and Impact
The new approach continues to use multiple factors with a stronger emphasis on long-term alignment, while maintaining in-depth qualitative analysis. ISS does not anticipate that the change in methodology will result in a significant change in the number or percentage of negative recommendations issued. Backtesting by ISS of the new methodology indicates a strong correlation between the results and shareholder say-on-pay votes in 2011.
CAP Perspective: ISS’ changes appear to address criticism that their current approach is a one size fits all approach and does not take into consideration company specific circumstances. This is evidenced in several areas:
- the modification of peer group to take into account factors in addition to industry such as similarity and size
- inclusion of absolute alignment gives weight to a company’s own pay and TSR trends
- more robust list of qualitative factors that consider operational results in addition to TSR as well as company specific practices
We expect companies and Compensation Committees to continue their focus on aligning their compensation programs with performance as we head into the second full year of Say on Pay. The elimination of the exclusion for “new” CEOs may create a challenge for any companies that have had to pay significantly to recruit a CEO and will likely be viewed as controversial as the new CEO will have had limited ability to impact performance.
Board Response to the MSOP and MSOP Frequency Votes
Following the first year of Say-on-Pay, ISS has conducted research with investors indicating a high degree of interest in having boards and Compensation Committees provide an explicit response to MSOP proposals that receive less than a majority support or weak majority support.
ISS’ policy update states that they will recommend case-by-case on Compensation Committee members (or in rare cases where the full board is deemed responsible, all directors) and the current MSOP proposal if the company’s prior year say-on-pay proposal received less than 70% of votes cast, taking into account:
- The company’s response, including:
- Disclosure of engagement efforts with major institutional investors regarding the compensation issue(s)
- Specific actions taken to address the issue(s) that appear to have caused the significant level of against votes
- Other recent compensation actions taken by the company
- Whether the issues raised are recurring or isolated
- The company’s ownership structure
- Whether the support was less than 50 percent, which would warrant the highest degree of responsiveness
In terms of the MSOP Frequency, ISS’ policy is more straightforward. ISS will recommend a withhold/against vote on all incumbent director nominees if the company implements an advisory vote on executive compensation on a less frequent basis than what the majority of voters supported. ISS will address votes on a case-by-case basis on all incumbent director nominees if the company implements an advisory vote on executive compensation on a less frequent basis than the frequency preferred by a plurality (but not a majority) of voters. Factors entering into ISS’ decision will include the board’s rationale for choosing the frequency, the company’s ownership structure and vote results, ISS analysis of the company’s executive compensation plans and the previous year’s level of support for the MSOP.
CAP Perspective: ISS has developed these two new policies to develop an enforcement mechanism to ensure that boards are responsive to shareholder votes on these non-binding measures. By potentially recommending a withhold/against vote on a director if the company is not adequately responsive to shareholders on MSOP or MSOP frequency, ISS is trying to ensure that these votes have “teeth” and directors are held accountable. Where companies received a less than 70% approval vote on the MSOP, “substantive and meaningful” disclosure of key steps taken to address potential shareholder concerns about the compensation program will be essential to getting ISS support in the following year.
Equity Plans Related to 162(m)
Under a proposed ruling related to IRC Section 162(m), recent IPO companies will now have to obtain shareholder approval before awarding certain performance-based restricted stock units (“RSUs”) to named executive officers in order to qualify them as performance-based compensation. While ISS has generally recommended that investors support equity plans solely for 162(m) purposes, they felt a new policy was warranted to address these IPO companies.
ISS will generally vote for proposals to approve or amend executive incentive bonus plans if the proposal:
- Is only to include administrative features
- Places a cap on the grants any one participant may receive to comply with the provisions of Section 162(m)
- Adds performance goals to existing compensation plans to comply with the provisions of Section 162(m) unless they are clearly inappropriate
- Covers cash or cash and stock bonus plans that are submitted to shareholders for the purpose of exempting compensation from taxes under the provisions of Section 162(m) if no increase in shares is requested
ISS will generally vote against proposals if:
- The compensation committee does not fully consist of independent outside directors, per ISS’ director classification
- The plan contains excessive problematic provisions
ISS will vote on a case-by-case basis on proposals if:
- In addition to seeking 162(m) tax treatment, the amendment may result in the transfer of additional value to employees (e.g., by asking for additional shares, extending option term, etc.); it will be subject a Shareholder Value Transfer analysis vs. the allowable cap
- A company is presenting the plan to shareholders for the first time after the company’s initial public offering (IPO). A full equity analysis will be conducted, including a review of total shareholder value transfer, repricing, burn rate analysis and liberal change in control. Other factors such as pay-for-performance or problematic pay practices as related to MSOP may also be included in ISS’ recommendation
CAP Perspective: This provision is unlikely to have major impact, but is something that companies moving toward an IPO should incorporate into their planning. To increase the likelihood of ISS support, pre-IPO companies should ensure that their equity plans overall have shareholder friendly provisions and that the share reserve is not excessive.
Conclusion
We expect the pay-for-performance policy to be the area of greatest focus as companies enter the 2012 proxy season and try to understand how ISS will be evaluating their compensation programs. While ISS’ new approach appears to be an attempt to recognize issues with their current pay-for-performance test, there will likely continue to be a difference between how ISS views a company’s performance and the company’s own internal view of performance. ISS’ move towards increased transparency may assist companies in replicating their pay for-performance analysis. This may provide a better understanding of how ISS is likely to view their compensation programs. Companies with concerns about the shareholder vote on MSOP and ISS’ potential recommendations may find it worthwhile to model out the ISS analysis on their own, though the exercise will likely require significant resources and expense.
In addition, the new pay-for-performance disclosure under Dodd-Frank may vary from ISS’ proposed approach and create additional confusion around what is the appropriate way to assess pay-for-performance. In any case, ISS and other shareholders will be looking for a clear demonstration that positive action is taken where there is a major shareholder concern about the executive compensation program.
- Evaluation of Executive Pay (Management Say on Pay)
- Board Response to the Management Say on Pay (MSOP) vote and the MSOP Frequency vote
- Developing a voting policy for recent IPO companies 162(m) approvals
Below CAP summarizes the key policy changes contemplated by ISS, along with areas where they are seeking comment. We also provide perspective on the key implications for companies to consider.
Evaluation of Executive Pay
Current Pay-for-Performance Analysis Approach
Companies with one- and three-year total shareholder returns (TSR) below the median of their 4-digit GICS industry group are reviewed by ISS for potential pay-for-performance disconnects. For these companies, ISS conducts a qualitative assessment to determine if pay and performance are misaligned. The factors reviewed include year-over-year change in CEO pay and trends in CEO pay and company TSR over 5 years.
Proposed Pay-for-Performance Analysis Approach
The proposed approach for 2012 continues to have quantitative and qualitative components. The quantitative analysis would review three factors in two categories:
- Relative Alignment – Two factors are analyzed to determine the pay-for-performance alignment within a group of companies similar to the company in market cap, revenue (or assets), and industry. The peer group is generally comprised of 14-24 companies that are selected on the basis of size and GICS industry group, via a process designed to select peers that are closest to the subject company in terms of revenue/assets (for financial firms) and industry and also within a market cap range that is reflective of the company’s life cycle maturity phase
- The degree of alignment between the company’s TSR rank and the CEO’s total pay rank within the peer group, as measured over one-year and three-year periods (weighted 40/60, to put more emphasis on the longer term)
- The multiple of the CEO’s total pay relative to the peer group median, which may identify cases where a high performing company may be overpaying
- Absolute Alignment – this factor measures long-term alignment between pay and company performance, as:
- Alignment between the trend in the CEO’s pay and the company’s TSRs over the prior five fiscal years – i.e., the difference between the slope of annual pay changes and the slope of annualized TSR changes during the prior 5-year period
For the quantitative assessment, the relative and absolute test may be weighted 50/50. ISS will generally provide a positive recommendation (absent other pay related issues) to companies demonstrating strong or satisfactory alignment. If the alignment is weak, ISS will conduct a qualitative review before issuing a final vote recommendation.
Considerations for the qualitative review include:
- The ratio of performance- to time-based equity awards
- The overall ratio of performance-based compensation
- The robustness of disclosure and rigor of performance goals
- The company’s peer group benchmarking practices
- Actual results of financial/operational metrics, such as growth in revenue, profit, cash flow, etc., both absolute and relative to peers
- Special circumstances related to, for example, a new CEO in the prior FY or equity grant practices (e.g., biannual awards)
- Any other factors deemed relevant
ISS Intent and Impact
The proposed approach continues to use multiple factors with a stronger emphasis on long-term alignment, while maintaining in-depth qualitative analysis. ISS does not anticipate that the change in methodology will result in a significant change in the number or percentage of negative recommendations issued. Backtesting by ISS of the new methodology indicates a strong correlation between the results and shareholder say-on-pay votes in 2011. ISS is requesting comments on the factors they are using, whether the new approach appropriately emphasizes the long-term and if there are other factors they should be considering.
CAP Perspective: ISS’s proposed changes appear to address criticism that their current approach is a one size fits all approach and does not take into consideration company specific circumstances. This is evidenced in several areas:
- the modification of peer group to take into account factors in addition to industry such as size and life cycle
- inclusion of absolute alignment gives weight to a company’s own pay and TSR trends
- more robust list of qualitative factors that consider operational results in addition to TSR as well as company specific practices
We expect companies and Compensation Committees to continue their focus on aligning their compensation programs with performance as we head into the second full year of Say on Pay.
Board Response to the MSOP and MSOP Frequency Votes
Following the first year of Say-on-Pay, ISS has conducted research with investors indicating a high degree of interest in having boards and Compensation Committees provide an explicit response to MSOP proposals that receive less than a majority support or weak majority support.
ISS’ proposed policy update states that they will recommend case-by-case on Compensation Committee members (or in rare cases where the full board is deemed responsible, all directors) and the current MSOP proposal if the company’s prior year say-on-pay proposal received significant opposition from votes cast, taking into account multiple factors, including:
- The level of opposition
- The company’s ownership structure
- Disclosure of engagement efforts with major institutional investors regarding the compensation issue(s)
- The company’s response
- Specific actions taken to address the issue(s) that appear to have caused the significant level of against votes
- Other recent compensation actions taken by the company
- ISS’ current analysis of the company’s executive compensation and whether any prior issues of concern are recurring or one-time
ISS will place more scrutiny on companies where an MSOP proposal received less than 50 percent support from all votes cast or where there are previously identified compensation issues or newly identified compensation concerns. Depending on the severity of the concerns, it may result in an against vote recommendation on Management Say on Pay and the Compensation Committee members. ISS is seeking comment on this policy to determine what the threshold (e.g., <70% support) should be for requiring an action plan from companies on how they will address shareholder concerns with their compensation plans and whether ISS should require more than one year of a low vote before expecting a response to shareholder concerns from boards.
In terms of the MSOP Frequency, ISS’ proposed policy is more straightforward. ISS will recommend a withhold/against vote on all incumbent director nominees if the company implements an advisory vote on executive compensation on a less frequent basis than what the majority of voters supported. ISS will address votes on a case-by-case basis on all incumbent director nominees if the company implements an advisory vote on executive compensation on a less frequent basis than what the majority of voters supported. Factors entering into ISS’ decision will include the board’s rationale for choosing the frequency, the company’s ownership structure, ISS analysis of the company’s executive compensation plans, the previous year’s level of support for the MSOP and the difference between the frequency adopted and the frequency supported by shareholders. ISS is asking for comments on whether there should be any additional factors considered in cases where a company adopts a say-on-pay frequency different from that preferred by the majority of shareholders and in plurality cases whether the factors identified are helpful and if there are other factors that would be of more use in assessing the decision to deviate from the frequency preference of the plurality of shareholders.
CAP Perspective: ISS has developed these two new policies to develop an enforcement mechanism to ensure that boards are responsive to shareholder votes on these non-binding measures. By potentially recommending a withhold/against vote on a director if the company is not adequately responsive to shareholders on MSOP or MSOP frequency, ISS is trying to ensure that these votes have “teeth” and directors are held accountable.
Equity Plans Related to 162(m)
Under a proposed ruling related to IRC Section 162(m), recent IPO companies will now have to obtain shareholder approval before awarding certain performance-based restricted stock units (“RSUs”) to named executive officers in order to qualify them as performance-based compensation. While ISS has generally recommended that investors support equity plans solely for 162(m) purposes, they felt a new policy was warranted to establish a new policy to address these IPO companies.
ISS will vote on a case-by-case basis on these plans and will subject them to a full equity plan analysis, including a review of total shareholder value transfer, repricing, burn rate analysis and liberal change in control. If the plans are not asking for additional shares, ISS still anticipates supporting the vast majority of plans.
CAP Perspective: This provision is unlikely to have major impact, but is something that companies moving toward an IPO should incorporate into their planning. To increase the likelihood of ISS support, pre-IPO companies should ensure that their equity plans overall have shareholder friendly provisions and that the share reserve is not excessive.
Conclusion
We expect the pay-for-performance policy to be the area of greatest focus as companies enter the 2012 proxy season and try to understand how ISS will be evaluating their compensation programs. While ISS’ proposed approach appears to be an attempt to recognize issues with their current pay-for-performance test, there will still likely continue to be a disconnect between how ISS views a company’s performance and the company’s own internal view of performance. In addition, the new pay-for-performance disclosure under Dodd-Frank may vary from ISS’ proposed approach and create additional confusion around what is the appropriate way to assess pay-for-performance. In any case, ISS and other shareholders will be looking for a clear demonstration that positive action is taken where there is a major shareholder concern about the executive compensation program.
In 2007, the SEC required public companies to provide proxy-based disclosure of the potential value of severance and change-in-control (“CIC”) payments to proxy-level named executive officers (“NEOs”). Since then, senior executive severance and CIC programs have been subject to increased/intense scrutiny by shareholders, shareholder advisors, institutional investors, and, more recently, legislators.
Introduction
Compensation Advisory Partners’ 2011 Executive Change-in-Control and Severance Report provides:
- A comprehensive review of current senior executive (Named Executive Officers) CIC and severance practices among two datasets, based on proxy statement disclosures and incentive plan documents:
- Dow Jones Industrial Average Component Companies (“Dow 30”)
Dow 30 Companies (n=30) Revenues Market Cap.
as of 12/31/2010Number of Employees ($MM) ($MM) (000s) Median $62,036 $111,583 127 - “Mid-Sized” companies reflecting 20 Fortune 1000 companies with revenues closest to $2.75B (“Mid-Sized Companies”)
Mid-Sized Companies
(n=20)Revenues Market Cap.
as of 12/31/2010Number of Employees ($MM) ($MM) (000s) Median $2,753 $4,155 6
- Dow Jones Industrial Average Component Companies (“Dow 30”)
- A review of changes to senior executive (Named Executive Officers) CIC and severance practices from 2007 – 2010 among the Dow 30 (market leading / trend setting companies)
- Observations regarding our findings, recent trends and near-term outlook
Executive Summary
In 2007, the SEC required public companies to provide proxy-based disclosure of the potential value of severance and change-in-control (“CIC”) payments to proxy-level named executive officers (“NEOs”). Since then, senior executive severance and CIC programs have been subject to increased/intense scrutiny by shareholders, shareholder advisors, institutional investors, and, more recently, legislators.
As a result, many companies have revised their severance and CIC policies to provide less generous payments upon CIC and/or termination, and others have eliminated these programs or scaled back eligibility. Still, “golden parachute” payments remain a high-profile element of pay packages. Benchmarking existing plans against other companies can help validate existing benefits or indentify opportunities to adjust arrangements.
- CAP’s study found that 60% of the Dow 30 and 85% of our Mid-Sized company dataset currently provide CIC-related cash severance benefits to NEOs through a formal program or individual contracts, and nearly 90% of the companies reviewed provide CIC/severance-related benefits when long-term and annual incentive plan provisions are included.
- Cash severance multiples for NEOs have not changed significantly for Dow 30 companies over the past three years, and CEO cash severance formulas are comparable among larger and smaller sized companies studied. Among the Dow 30, double trigger equity vesting upon a CIC (requiring a termination of employment and a CIC) has increased in prevalence from 50% (in 2007) to 70% in 2010, and double trigger provisions are equally prevalent among our sample of Mid-Sized companies. While excise tax gross-ups have become a minority practice among the Dow companies, they are still prevalent among Mid-Sized companies.
Outlook
We have witnessed changes to CIC- and severance related benefit provisions at a somewhat accelerated pace over the last 12-24 months and expect the general market trend of benefit reduction to continue. We also expect the policies and practices of smaller market capitalization. companies to migrate towards those of larger companies, following the lead of companies such as the Dow 30, and resulting in new “best practices” in this arena overall.
| Element of Pay | NOTABLE FINDINGS | |
| Dow 30 | Mid-Sized Companies | |
| Cash Severance (CIC) | Prevalence
|
Prevalence
|
Multiples – Most Prevalent
|
Formula– Most Prevalent
|
|
Formula – Most Prevalent
|
Multiples– Most Prevalent
|
|
Definition of Bonus – Most Prevalent
|
Definition of Bonus – Most Prevalent
|
|
Bonus Payment in Year of Termination– Most Prevalent
|
Bonus Payment in Year of Termination– Most Prevalent
|
|
|
Treatment of Equity (CIC) |
Acceleration – Prevalence
Trigger – Most Prevalent
|
Acceleration – Prevalence
Triger – Most Prevalent
|
|
Tax Gross-Ups |
Prevalence
|
Prevalence
|
|
Cash Severance Multiples (Non-CIC) |
Multiples – Most Prevalent
|
Multiples – Most Prevalent
|
Stronger Governance Practices
What We Found
In response to increased pressure from shareholders and proxy advisory firms, as well as recent Say on Pay legislation, companies continue to monitor their executive compensation programs. In the past, companies would re-evaluate their programs every 2-3 years. Given today’s intense scrutiny of executive compensation, we are seeing companies and compensation committees re-evaluate their programs annually. New governance standards include completing the annual risk assessment and implementing updated clawback policies. In addition, companies have removed excise tax-gross ups from change in control benefits and perquisites, continue to emphasize stock ownership guidelines and stock retention requirements, and have reduced supplemental retirement benefits.
Compensation Risk Disclosure
Clear and explicit disclosure of the compensation risk assessment process is becoming standard practice, especially after the recent economic downturn and passage of SEC rules on enhanced compensation disclosure. Of the 111 companies in our study, 105, or 95%, make some type of affirmative disclosure on risk assessment in the most recent proxy. Similar to 2009, none of the companies disclosed that their incentive programs create material adverse risks.
Most companies make their risk-related disclosure in the CD&A of the proxy statement, with the corporate governance section of the proxy statement ranking as the second most common place for this disclosure. The table below summarizes where risk disclosures were made:
| Section of the Proxy Statement with Compensation Risk Disclosure |
2010 | 2009 | ||
| % of Cos. | % of Cos. | |||
| No. of Cos. | n=105 | No. of Cos. | n=75 | |
| CD&A | 49 | 47% | 39 | 52% |
| Corporate Governance Section (Section 407) | 25 | 24% | 19 | 25% |
| CD&A and Corporate Governance Section (Section 407) | 14 | 13% | 7 | 9% |
| Separate Stand Alone Section | 11 | 10% | 8 | 11% |
| CD&A and Compensation Committee Report | 4 | 4% | 2 | 3% |
| Compensation Committee Report | 2 | 2% | n/a | n/a |
Responsibility for completing the risk assessment process varies by company. Of the companies disclosing a risk assessment, 35 companies (33%) had management and the compensation committee working together to conduct the assessment, while 17 companies (16%) reported that the compensation committee worked alone to conduct the assessment. One change we noted is that this year 95% of companies disclosed who conducted the risk assessment versus only 65% last year. The table below provides further detail on which groups were involved in the compensation risk review:
| Approach to Compensation Risk Reviews | 2010 | 2009 | ||
| % of Cos. | % of Cos. | |||
| No. of Cos. | n=105 | No. of Cos. | n=75 | |
| Management & Compensation Committee | 35 | 33% | 10 | 13% |
| Compensation Committee | 17 | 16% | 7 | 9% |
| Compensation Committee & Consultant | 15 | 14% | 9 | 12% |
| Management | 13 | 12% | 7 | 9% |
| Management, Compensation Committee & Consultant | 12 | 11% | 15 | 20% |
| Management & Consultant | 8 | 8% | 1 | 1% |
| Not Disclosed | 5 | 5% | 26 | 35% |
Clawbacks
Despite the SEC’s delay in proposing policies to recoup executive compensation under Dodd-Frank, companies have been proactively adopting clawback policies. Even though clawbacks are mandated by the SEC for all public company CEOs and CFOs under SOX and for the top 25 executives in TARP participants, companies have implemented their own clawbacks to obtain broader protection.
A significant majority of our research companies – 89 of 111 (80%) – maintain some form of clawback provision. For 2010, 17 of the 89 companies adopted a new clawback policy and 10 modified existing policies by expanding the type of compensation that can be recouped, the executives covered or the events that trigger a clawback. The majority of companies are awaiting final SEC regulations, however, before making comprehensive changes to update existing policies.
Similar to our findings in 2009, a financial restatement is required to trigger a clawback in nearly all cases (74 companies or 83% of those with a clawback). Further, 66 companies (74% of those with a clawback) disclosed that misconduct is a triggering event and 45 companies (51%) disclosed fraud as a trigger.
Based on our review of CD&A disclosures, companies with a clawback include the ability to clawback or recoup the following types of compensation: earned, exercised, outstanding, vested or unvested.
| Compensation Subject to Clawback | % of Cos. | |
| No. of Cos. | n=89 | |
| Prior annual incentive | 81 | 91% |
| Prior LTI | 79 | 89% |
| Future annual incentive | 20 | 22% |
| Future LTI | 14 | 16% |
Note: Percentages add up to greater than 100% due to multiple responses.
Of the type of compensation that is subject to a clawback, clawbacks of both cash and equity are equally prevalent.
While the majority of companies do not explicitly state who their clawback policy applies to, it is clear that coverage extends to the NEOs at 83 companies (93%).
A minority of companies (18 companies or 20%) indicate the time period which compensation can be recovered after a restatement. Of the 18 companies that disclosed a time frame, the most common is 1 year from the date of restatement and the range is 1-3 years.
It is apparent from reviewing CD&A disclosure that most companies are waiting for the SEC to rule before modifying their current policies. Companies will need to develop and implement a policy to provide for recovery of compensation that aligns final rules issued by the SEC. The proposed rules apply to both current and former executives and cover all incentive compensation within 3 years of a financial restatement (with or without intentional misconduct). It is unlikely that companies will make final modifications to their policies that apply to the 2012 proxy season, since the SEC is not expected to issue final rules until the first half of 2012.
Stock Ownership Requirement Changes
Companies continue to monitor their stock ownership requirements in order to align executives with shareholders. This year 25 companies (23%) initiated a change with respect to stock ownership or stock holding requirements. The most prevalent change was an increase in stock ownership guideline levels, with 12 of the 25 companies (48%) disclosing an increase. This is likely attributed to a recovery in the economy as well as stock prices, and increasing pressure from regulators and proxy advisory firms. Other common changes were 24% of companies added a new stock holding requirement and 20% modified or added a penalty for non-compliance. Further detail on changes made to executive stock ownership guidelines are below:
| Changes made to Executive Stock Ownership Guidelines | 2010 | 2009 | ||
| % of Cos. | % of Cos. | |||
| No. of Cos. | n=25 | No. of Cos. | n=17 | |
| Increased | 12 | 48% | 3 | 18% |
| Added holding requirement | 6 | 24% | n/a | n/a |
| Modified penalty for non-compliance | 5 | 20% | n/a | n/a |
| Changed to multiple of salary | 2 | 8% | n/a | n/a |
| Increased holding requirement | 2 | 8% | n/a | n/a |
| Decreased holding requirement | 2 | 8% | n/a | n/a |
| Newly adopted | 1 | 4% | 10 | 59% |
| Decreased | 1 | 4% | 1 | 6% |
| Adopted mandatory holding of shares through retirement | 1 | 4% | n/a | n/a |
Note: Percentages add up to greater than 100% due to multiple changes by several companies.
Stock Ownership Requirements Detail
For companies disclosing shares counted toward ownership requirements, it is interesting to note that one-third of companies count unvested restricted stock towards meeting the guidelines, since companies expect executives to vest in these shares. However, only 6% count vested/unexercised options and 5% count unearned performance shares since these shares are viewed as being subject to greater risk. See below for further detail:
| Shares Counting For Guideline Requirements | % of Cos. | |
| No. of Cos. | n=99 | |
| Shares directly owned | 55 | 56% |
| Unvested RS | 33 | 33% |
| Shares in 401(k) plan | 33 | 33% |
| Shares indirectly owned | 29 | 30% |
| Shares purchased on open market | 29 | 29% |
| Not disclosed | 29 | 29% |
| Deferred Compensation | 25 | 25% |
| Vested but unexercised options | 6 | 6% |
| Unearned performance shares | 5 | 5% |
| Unvested options | 1 | 1% |
Note: Percentages add up to greater than 100% due to multiple types of equity counted by various companies.
Among CEOs, most companies (82%) express their guidelines as a multiple of base salary and 17% of companies express their guidelines in fixed share amounts. The fixed share approach is more prevalent among financial services and technology companies.
The median guideline for all company CEOs in our study sample is a 5x multiple of base salary or a fixed share guideline of 150,000 shares. The median value of these guidelines is $6,700,000.
| CEO Stock Ownership Guidelines (n=99) |
Prevalence |
25th Percentile Level | Median Level | 75th Percentile Level |
| Multiple of Base | 82% | 5.0x | 5.0x | 6.0x |
| Fixed Share | 17% | 100,000 | 150,000 | 300,000 |
| Fixed Value | 1% | $5,000,000 | $5,000,000 | $5,000,000 |
| Total Value | – | $5,389,894 | $6,700,000 | $8,600,000 |
15% of companies disclose some type of penalty for non-compliance with stock ownership guidelines. The most common penalties disclosed include mandatory payment of a portion of the annual bonus in stock and requiring executives to hold shares after an option exercise or the vesting of stock awards.
Stock Holding Requirements Detail
Having stock holding or stock retention requirements in addition to stock ownership guidelines is a growing trend. In our sample of 111 companies, 30 companies (27%) disclose some type of stock holding requirement. Over half of the 30 companies have a stand-alone stock holding requirement. This type of requirement is most prevalent among financial services companies in place at 75% of financial services companies.
Most of these companies (46%) require executives to hold equity after vesting or exercise for 1 year. Holding shares until retirement (33%) is the second most prevalent holding period, although it is relatively rare. 70% of companies disclose that the equity to be held is the net after-tax shares retained by the executive after option exercise/equity vesting. See below for further detail:
| Definition of LTI subject to Hold | % of Cos. | |
| No. of Cos. | n=30 | |
| RS/RSUs | 25 | 83% |
| Options | 22 | 73% |
| Performance Shares | 12 | 40% |
| Net after tax shares | 21 | 70% |
Note: Percentages add up to
- Going forward, a Say on Pay vote will be an annual event at most companies
- A simple majority should not be considered a passing grade
- Companies with stronger performance generally received higher levels of shareholder support
- Say on Pay voting has already been a catalyst for change
As background, on January 25, 2011, the SEC issued final rules implementing Section 951 of the Dodd-Frank Wall Street Reform and Consumer Protection Act (“Dodd-Frank”), which generally provides shareholders of US public companies with the right to cast three types of advisory votes related to executive compensation:
- A vote to approve the compensation of the Named Executive Officers (NEOs), effective for shareholder meetings occurring on or after January 21, 2011;
- A vote on the frequency with which shareholders should be entitled to cast Say on Pay votes (every one, two or three years), effective for shareholder meetings occurring on or after January 21, 2011; and
- A vote on golden parachute arrangements for NEOs related to a sale, consolidation or merger, effective April 25, 2011.
Say on Pay Frequency Vote Results (2011 Proxy Season)
An annual vote frequency has emerged as the clear shareholder preference. Among 93% of S&P 500 companies reporting vote results, a majority of shareholders supported annual Say on Pay vote frequency. This differs from vote recommendations, where only 68% of the companies had recommended an annual vote.
Company Recommendation (n=455)
| Vote Frequency | # of Companies | % of Companies |
| Annual | 310 | 68% |
| Bienniel | 13 | 3% |
| Triennial | 111 | 24% |
| No Recommendation | 21 | 5% |
Vote Results: Received Majority Shareholder Support (n=438)
| Vote Frequency | # of Companies | % of Companies |
| Annual | 409 | 93% |
| Bienniel | 1 | 0% |
| Triennial | 21 | 5% |
| None (only plurality)1 | 7 | 2% |
The strong support for annual votes is not a surprise. 39 institutional investors, representing more than $830 billion in assets, issued a public call for companies and investors to support annual advisory votes on executive compensation in 2011 proxy statements. Similarly, a number of major mutual funds have also indicated support for annual Say on Pay votes, and ISS’ policy recommends that shareholders support annual votes (Glass Lewis has indicated a similar preference).2
CAP Comment: Following the frequency vote, the SEC rules mandate disclosure of how often the company will hold future Say on Pay votes, generally through an 8-K. Issuers must also provide proxy-based disclosure of the current frequency of Say on Pay votes and when the next scheduled Say on Pay vote will occur.
CAP Comment: When companies conduct their Say on Pay vote in line with the frequency preferred by a majority of shareholders, they may exclude shareholder frequency proposals from the proxy for six years.
Say on Pay Vote Results (2011 Proxy Season)
Say on Pay resolutions received majority shareholder support at all but eight S&P 500 companies, with average support of 89% (most companies received greater than 80% support for their NEO pay program).3
| %inFavor | #of Companies | %of Companies | Average1-Yr TSR @12/31/10 | A “threshold” for acceptable passage rates seems to have emerged; to-date, results indicate this threshold is around 80% shareholder support. |
| 90%-100% | 274 | 62% | 25.2% | |
| 80%-90% | 73 | 17% | 24.3% | |
| 70%-80% | 43 | 10% | 16.5% | |
| 50%-70% | 40 | 9% | 7.4% | |
| 0%-50% | 8 | 2% | 9.6% |
As shown above, companies with stronger TSR on a 1-year basis generally received a higher level of support from shareholders on their executive pay programs.
CAP Comment: While a company does not “fail” its Say on Pay vote unless a majority of shareholders vote against the compensation program, many companies have received 90+% shareholder support and an “acceptable” shareholder support threshold has emerged around 80%. Below this level of support, we have found that there often is a notable level of shareholder discontent that should be carefully reviewed.
CAP Comment: While these votes are non-binding, we expect that most companies will carefully evaluate their vote results, taking some action if there is low shareholder support (not just in the limited cases where a majority of shareholders did not support the company’s executive compensation program).
CAP Comment: The final SEC rules require additional disclosure in the CD&A regarding whether, and if so how, companies have considered the results of the most recent Say on Pay vote.
CAP Comment: As a result of the Dodd-Frank legislation, the SEC will eventually adopt rules requiring proxy-based disclosure of the pay-for-performance relationship at each U.S. public company (rules currently schedule to be adopted during 2012).
The eight companies where a majority of shareholders did not support the executive compensation program, and the Say on Pay vote results for these companies, are:
| Company | 1-Yr TSR | % Votes in Favor |
| Hewlett-Packard | -17.7% | 48.2% |
| Freeport-McMoran Copper & Gold | 52.6% | 45.5% |
| Jacobs Engineering | 21.9% | 44.8% |
| Masco Corp. | -6.1% | 44.6% |
| Nabors Industries | 7.2% | 42.5% |
| Janus Capital Group | -3.2% | 40.1% |
| Constellation Energy Group | -10.3% | 38.0% |
| Stanley Black and Decker | 32.7% | 38.0% |
Impact of Proxy Advisor Recommendations
On average, shareholder support for Say on Pay votes was considerably lower when ISS recommended an “Against” vote to shareholders.4,5
|
|
|||||||||||||||||||||
CAP Comment: Where ISS recommended an “Against” vote for Say on Pay, 90% of companies received less than the 80% percent shareholder support threshold discussed above.
As shown below, companies that received an “Against” vote recommendation from ISS generally had lower TSR.
| ISS Vote Recommendation | # Companies that Passed | # Companies that Failed | Total | Average 1-Yr TSR @ 12/31/10 |
| For | 377 | 0 | 377 | 24.3% |
| Against | 53 | 8 | 61 | 10.3% |
| Total | 430 | 8 | 438 | 22.5% |
CAP Comment: Of the 438 companies reporting vote results, to-date, ISS recommended an “Against” vote for Say on Pay at 61 S&P 500 companies (14%). Only 8 of the 61 companies (13%) did not receive majority support for their Named Executive Officer compensation program.
Responding to Proxy Advisor Recommendations
Some notable companies took additional steps related to executive compensation during this proxy season, filing supplementary soliciting materials and/or making last minute modifications to their CEO pay program. Select examples include: General Electric, Disney, ExxonMobil, Johnson & Johnson, Hewlett-Packard, Lockheed Martin, and Northern Trust. While these filings were generally in reaction to negative vote recommendations from shareholder advisory services such as ISS, ExxonMobil went a step further by filing supplementary materials (essentially an executive pay brochure) on the same day as the proxy. ExxonMobil still received a negative vote recommendation from ISS, and later filed additional soliciting material rebutting ISS’ vote recommendation.
Conclusion
During the 2011 proxy season, a clear shareholder preference for annual Say on Pay votes emerged. In terms of the actual Say on Pay vote, an 80% threshold emerged as an “acceptable” level of shareholder support, a significantly higher hurdle than simple a pass / fail test.
Say on Pay has already been a catalyst for change. Companies are more willing to address controversial pay practices than they were a year earlier. Disclosure of executive compensation in proxy statements has evolved, and the influence of proxy/shareholder advisory services (such as ISS) has increased.
Looking forward, companies will need to carefully evaluate their Say on Pay vote result from the 2011 proxy season, and determine how to best incorporate any findings into planning for 2012.
1 None of the three frequency options (annual, biennial, or triennial) received majority support (greater than 50%).
2 For additional detail, see 12/5/10 CAPFlash: “ISS 2011 Policy Updates – Here Comes Say on Pay.”
3 Outside of the S&P 500, an additional 29 companies did not receive majority shareholder support for their NEO compensation program.
4 ISS refers to Institutional Shareholder Services, an influential proxy advisory service. Source of vote recommendations was ISS Voting Analytics.
5 Sample = 434 companies that filed vote results to-date.
Notable 2010 Findings
Total Board Compensation
At median, pay levels for non-employee directors were flat from 2009-10. Year-over-year, median Total Board Compensation remained steady at $235,000 i.
Total Board Compensation ($000s)
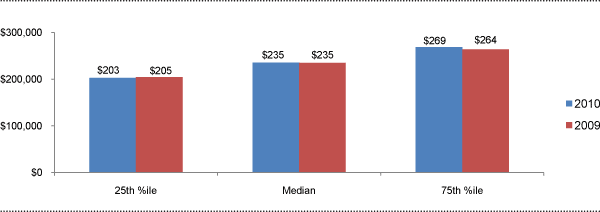
In line with emerging practices among large companies, use of Board meeting fees was minority practice in 2010, with only 23% of companies paying meeting fees.
Pay Mix
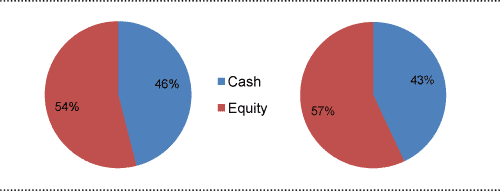
On average, the cash vs. equity pay mix was generally consistent between 2009 and 2010. The majority of compensation delivered to non-employee directors continues to be in the form of equity.
2010 Pay Mix | 2009 Pay Mix
CAP Perspective:
Over the next few years, we expect the following trends in director compensation to take place: 1) low to mid single-digit annual increases in Total Board Compensation; 2) more companies moving to fixed cash pay structures; 3) a continued emphasis on full-value equity awards.
Equity Compensation
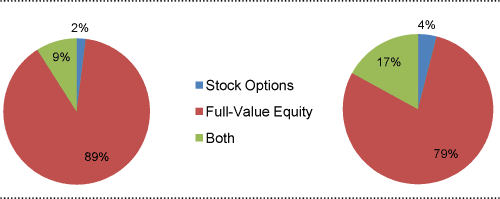
On average, an increased portion of 2010 equity-based compensation for non-employee directors was paid in the form on full-value awards, as compared to 2009.
2010 Equity Awards | 2009 Equity Awards
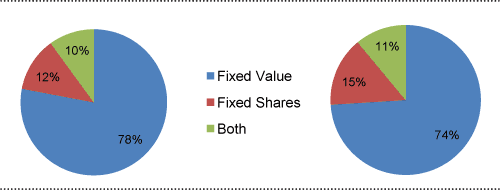
Year-over-year (2010 vs. 2009), equity awards denominated as a fixed value increased in prevalence, as opposed to those based on a fixed number of shares.
2010 Equity Awards | 2009 Equity Awards
Committee Compensation
During 2010, median committee member compensation was generally consistent with 2009ii. Our research also found that approximately one-third of companies studied pay no committee-specific fees to members of any of the 3 major committeesiii.
Committee Member Compensation
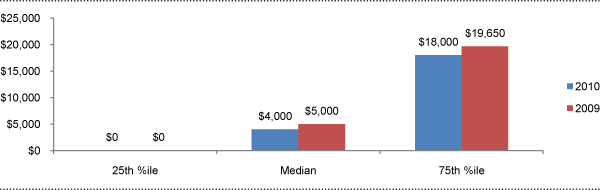
CAP Perspective:
We expect the trend away from committee member fees to continue, with the value being rolled into board cash or equity retainers, as many companies now view all Board members as active participants in committee-level work.
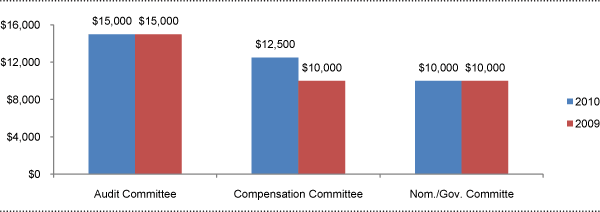
At median, additional compensation for committee Chairs remained flat for the Audit and Nominating / Governance committees, and rose by 25% for the Compensation Committee, driven by increased time requirements and scrutiny of executive compensation.
Median Additional Compensation for Committee Chairs
Lead/Presiding Directors and Non-Executive Chairs of the Board
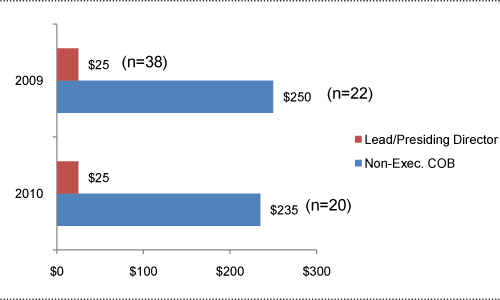
During 2010, the prevalence of additional compensation for Lead/Presiding Directors and non-Executive Board Chairs remained flat as compared to 2009. While, at median, additional compensation for Lead/Presiding Directors remained flat, additional compensation for non-Executive Chairs decreased slightly.
Median Additional Compensation for Board Leadership Roles ($000s) (excl. 0s)
CAP Perspective:
While not all non-executive Board leaders receive additional pay for the role, prevalence of additional compensation for these roles is expected to increase over time. The differential in pay between Lead/Presiding directors and non-Executive Chairs is in line with the typically different responsibilities of each position.
Conclusion
As shown above, there was nominal change in director pay levels and practices year-over-year (2010 vs. 2009) among the largest public U.S. corporations.
It is important for companies to regularly evaluate their overall non-employee director compensation program, or risk falling behind the curve in regards to desired relative market positioning and best in class program design. While reviews should be conducted regularly, it is usually unnecessary for design or pay level changes to take place more often than every 2-3 years.
CAP will release its full report on non-employee director compensation during Fall 2011. The report will provide a detailed analysis of year-over-year changes in pay levels, pay practices and other program design considerations, as well as a discussion of best in class director compensation program setting process.
- i Compensation reflects all cash and equity compensation for Board and committee service, excluding compensation for additional leadership roles such as committee Chair, Lead/Presiding director, or non-executive Chair of the Board.
- ii Reflects all compensation for committee member service (excludes additional fees for leadership roles), across all Board committees.
- iii Audit, Compensation and Nominating / Governance committees.
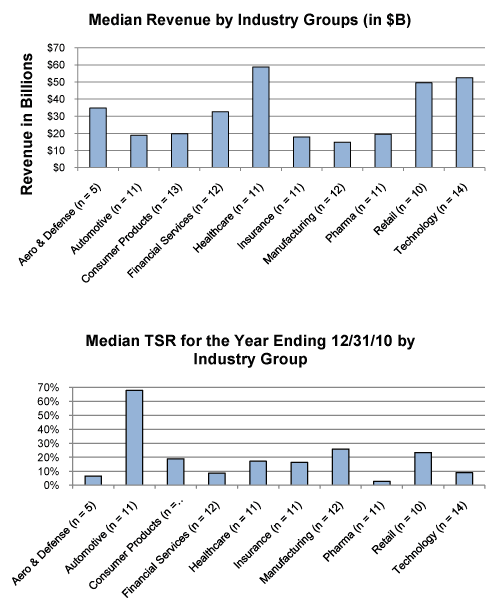
For the 111 company sample, median revenue was $27B, market capitalization was $30B and Total Shareholder Return (TSR) was 16% for 2010.
What We Found
Highlights of our research findings are below. Most companies did not make sweeping changes to their executive compensation programs. But many companies continued to refine annual and long-term incentive plans to strengthen the alignment between executive rewards and financial performance and to focus executives on the overall health of the organization.
Compensation Strategy Changes
Similar to 2009, most companies did not make significant changes to their compensation strategy. Financial Service firms were more likely to make changes to the strategy (e.g., increase at-risk pay) as they emerged from compensation restrictions imposed by TARP.
Peer Groups Used For Benchmarking
In 2010, companies continued to review and modify their peer group, although wholesale changes were not the norm. Approximately 40% of companies made some modification to their peer group by selecting peers that more closely aligned with their size and business mix. Pharmaceutical companies, in particular, continued to make changes to the peer group as industry consolidation continued.
Base Salary Actions
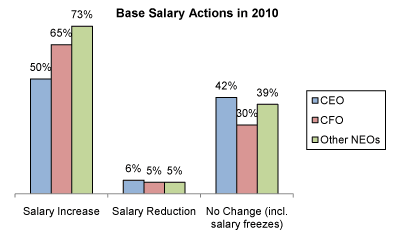
2010 saw the return of salary increases for senior executives with a majority of companies providing salary increases to Named Executive Officers (NEOs) in 2010 (vs. 20% in 2009) as the economy improved. Within the NEO ranks, companies provided increases more frequently to executives below the CEO as they focused on retaining top talent and remaining competitive with the market. Salary reductions were most prevalent in companies that emerged from TARP, as these companies reverted to a compensation mix that provides a greater emphasis on incentive-based pay. Fewer companies froze base salaries for NEOs in 2010; companies in the Consumer Goods, Retail and Technology industry groups were more likely to maintain salaries at 2009 levels.
Annual Incentive Plan Design
Approximately 50% of companies disclosed a change in 2010 or planned changes for 2011 to their annual incentive plan design. Companies continued to refine the metrics and weightings that determine plan funding and payout as pay for performance remains a major focus for companies. 26% of companies increased the target annual incentive opportunity for at least one NEO illustrating that companies are focusing on the competitive market given the improvements in the economy. Although changes to annual incentive plans vary by company, there continues to be an attempt to reward executives based on appropriate indicators of company success.
The chart below presents the reported AIP changes:
| % of Cos. Reporting Changes | |||
| Type of Change Reported in CD&A | No. of Cos. | 2010 (n = 57) | 2009 (n = 34) |
| Change in performance metrics used to fund awards | 19 | 33% | 44% |
| Change in performance metric weighting mix* | 10 | 18% | n/a |
| Increased target award opportunities | 15 | 26% | 26% |
| Adopted / amended annual incentive plan | 13 | 23% | 6% |
| Modified performance scale | 6 | 11% | n/a |
| Reduced maximum award payout leverage | 2 | 4% | 12% |
| Other changes | 9 | 16% | 9% |
Note: Percentages do not add up to 100% due to multiple responses.
* Not captured separately in 2009 and is included in preceding category.
Change in Performance Metrics
Of the 19 companies that made changes to performance metrics, most (10 companies) added metrics to the plan design. Additionally, 10 companies changed the weighting of the AIP metrics. In general, these changes were focused on basic company performance indicators such as profitability and cash flow. For example,
- Computer Sciences: Added free cash flow as a measure to emphasize the importance of liquidity and profitability
- Morgan Stanley: Added capital adequacy and credit rating measures to the metrics used to determine financial achievements
- Visteon: Added product quality and free cash flow as performance metrics
Many companies added cash flow as an annual incentive metric in 2010 indicating that in the wake of the recent economic downturn, companies are balancing profitability with liquidity.
Annual Incentive Plan Metrics
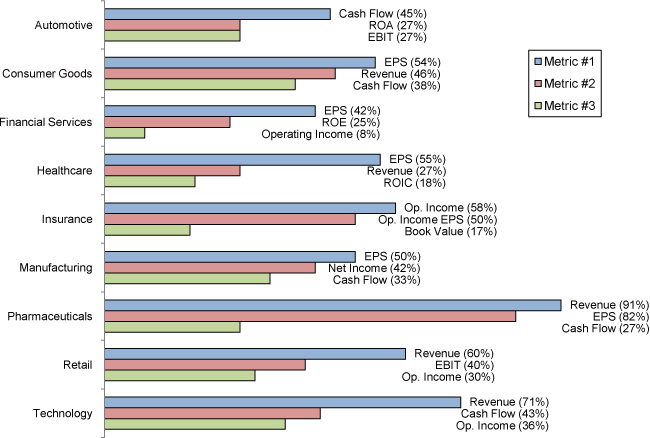
In 2010, the most common metrics used across all industry groups were revenue or revenue growth, EPS and cash flow. Cash flow was one of the three most common metrics in five industry groups (Automotive, Consumer Goods, Manufacturing, Pharmaceuticals and Technology). More than other industries, annual incentive metrics for insurance companies tend to focus on industry-specific measures. The most prevalent metrics in the Automotive industry are cash flow and return on assets (ROA) denoting a focus on company operating performance during the economic recovery.
The three most prevalent metrics for each industry group are detailed below:
Note: Excludes Aerospace and Defense due to limited sample size (n = 5).
2010 Bonus Payout Details
Nearly all companies (95%) paid a bonus to an NEO for 2010. Most companies (90%) used financial performance to calculate the payout, although many of these companies (19%) also used discretion (positive and negative) to account for non-financial performance. Actual bonus payouts for CEOs on average were approximately 135% of the target incentive opportunity for 2010, indicating a rebound in financial performance in 2010 over 2009.
Long-Term Incentive Plan Design
A majority of companies (approximately 70%) reported making changes to their long-term incentive plan designs in 2010 or for 2011. Similar to the annual incentive plan changes, many companies (32%) reported changes to the performance metrics used to determine award payouts. 26% of companies reported changes to the LTI vehicle mix, with companies placing more emphasis on performance-based awards. This suggests that companies are focusing executives on longer-term goals. The table below outlines the reported changes:
| % of Cos. Reporting Changes | |||
| Type of Change Reported in CD&A | No. of Cos. | 2010 (n = 77) | 2009 (n = 60) |
| Changed long-term performance metric | 24 | 31% | 38% |
| Adopted / amended long-term incentive plan | 24 | 31% | n/a |
| Changed mix of LTI award vehicles | 20 | 26% | 55% |
| Added or eliminated LTI vehicle* | 22 | 29% | n/a |
| Changed LTI award opportunity level | 14 | 18% | 20% |
| Changed performance metrics/weighting | 6 | 8% | n/a |
| Other | 17 | 22% | 35% |
Note: Percentages do not add up to 100% due to multiple responses.
* Not captured separately in 2009 and is included in preceding category.
Long-Term Award Mix
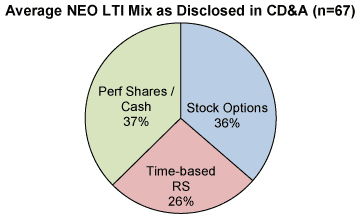
From companies making changes to their LTI award mix, a majority (60%) disclosed that they increased the emphasis on performance by shifting a portion of total LTI value from time-based awards (options and restricted stock) to performance-based vehicles. On average, companies are providing approximately 25% of the total LTI awarded to NEOs in time-based restricted stock with the remaining value equally split between performance-based LTI and stock options.
| % of Cos. Reporting Changes | |||
| Type of Change Reported in CD&A | No. of Cos. | 2010 (n = 20) | 2009 (n = 33) |
| Greater emphasis on performance-based awards | 12 | 60% | 55% |
| Reduced emphasis on time-based restricted stock | 7 | 35% | n/a |
| Reduced emphasis on stock options | 5 | 25% | n/a |
| Other | 5 | 25% | 45% |
Long-Term Incentive Prevalence
Although companies making a change indicated they are placing a greater emphasis on performance-based awards, equity awards with time-based vesting continue to be prevalent. The prevalence of stock options and restricted stock with time-based vesting remained relatively flat in 2010, with 74% and 65% of companies using these vehicles, respectively.
Below is the breakdown of overall LTI vehicle prevalence for NEOs in 2010 vs. 2009:
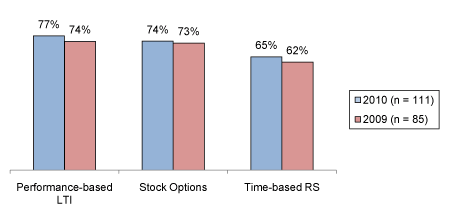
Note: Percentages do not add up to 100% due to multiple responses.
Companies typically grant multiple LTI vehicles to NEOs to offer a balanced program with different performance metrics and time horizons. Most companies (77%) grant two or three award vehicles to provide LTI to executives.
Performance-Based LTI Metrics
For companies using performance-based LTI, TSR (38%) and EPS (35%) continue to be the most prevalent metrics. More companies are incorporating return on capital or return on equity as a metric in 2010 to increase the focus on longer term health/stability and the quality of earnings. The use of revenue and cash flow remained relatively flat year over year.
The chart below displays the prevalence of LTI metrics for performance-based awards in 2010 and 2009:
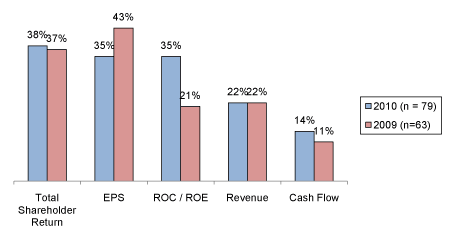
Note: Percentages do not add up to 100% due to multiple responses.
Treatment of Dividend Equivalents
Approximately 40% of companies that grant restricted stock (either time-based or performance-based) and 20% of companies that grant performance shares / units disclose that they pay dividend equivalents to executive officers. Companies typically pay dividends when the shares have vested or are earned.
Conclusions
2010 saw changes to annual and long-term incentive plan design in response to the rebounding economy, greater shareholder scrutiny, as a result of say on pay, and an attempt to further align pay and performance. With the economy on the rebound companies provided more frequent salary increases to NEOs in 2010 and were less likely to freeze base salaries. Companies modified incentive plan metrics, focusing on both company profitability and cash flow. The executive LTI mix continues to shift, with companies reporting more emphasis on performance-based awards. We expect to see companies continue to refine pay programs overall with the objective of strengthening pay and performance linkages and transparency.