This Performance Update report examines full year 2023 financial performance. Our full Insurance Industry report, which is typically published in the second quarter, will cover 2023 executive compensation trends. Our sample of insurers represents 19 of the largest Property & Casualty (P&C) and Life & Health (L/H) Insurance companies with median revenue of approximately $19B.
|
2022 – 2023 Annual Growth (Median) |
S&P 500 Median TSR1 |
|||||||
|
Revenue |
Premiums |
Net Investment Income |
Catastrophe Losses |
Operating |
Operating |
TSR |
||
|
Property & Casualty (n=10) |
+11.5% |
+9.6% |
+24.7% |
+2.6% |
+21.9% |
+2.3%pt. |
+5.3% |
+12.7% |
|
Life & Health (n=9) |
-1.1% |
— |
+6.8% |
— |
+5.1% |
-0.1%pt. |
+10.1% |
|
|
All Companies (n=19) |
+8.7% |
+9.6% |
+12.1% |
+2.6% |
+9.9% |
+1.5%pt. |
+6.4% |
|
|
2021 – 2022 Annual Growth (Median) |
S&P 500 Median TSR1 |
|||||||
|
Revenue |
Premiums |
Net Investment Income |
Catastrophe Losses |
Operating |
Operating |
TSR |
||
|
Property & Casualty (n=10) |
+4.2% |
+10.1% |
-5.3% |
0.0% |
-14.9% |
-2.4%pt. |
+14.9% |
-11.8% |
|
Life & Health (n=9) |
-0.2% |
— |
-9.9% |
— |
-11.8% |
-1.5%pt. |
+20.1% |
|
|
All Companies (n=19) |
+1.6% |
+10.1% |
-6.6% |
0.0% |
-12.4% |
-2.0%pt. |
+18.4% |
|
|
2020 – 2021 Annual Growth (Median) |
S&P 500 Median TSR1 |
|||||||
|
Revenue |
Premiums |
Net Investment Income |
Catastrophe Losses |
Operating |
Operating |
TSR |
||
|
Property & Casualty (n=10) |
+11.3% |
+11.0% |
+13.3% |
-25.8% |
+40.8% |
+2.7%pt. |
+23.2% |
+28.1% |
|
Life & Health (n=9) |
-2.1% |
— |
+4.9% |
— |
+35.2% |
+3.4%pt. |
+34.5% |
|
|
All Companies (n=19) |
+8.9% |
+11.0% |
+9.0% |
-25.8% |
+35.2% |
+3.0%pt. |
+27.4% |
|
Source: S&P Capital IQ & Publicly-disclosed SEC Filings
- Total shareholder return for the S&P 500 is reflective of the median return of all current S&P 500 constituents
Key Observations – 2023 Full Year Results
- Among all companies reviewed, Revenue growth was stronger in 2023 than 2022, and in line with 2021. This was driven by P&C companies in particular, with Revenues increasing +11.5% year-over-year at median in 2023, compared to +4.2% growth in 2022. Premium growth for P&C insurers also remained strong in 2023. Revenues for L/H insurers declined -1.1% in 2023, following a flat year in 2022.
- Net Investment Income rebounded strongly in 2023 for the full sample, up +12.1% at median after a -6.6% decline in 2022.
- Operating profitability improved year-over-year, with Operating Income and Operating ROE increasing +9.9% and +1.5 percentage points, respectively, for the full sample. This is a positive improvement from the 2022 decline in Operating Income performance, following exceptional 2021 results. Operating Income for P&C insurers increased +21.9% in 2023, compared to +5.1% growth posted by L/H insurers in the study. Operating ROE for L/H insurers was flat year-over-year.
- For 2023, median Operating Income ROE for P&C companies was 11.0% and for L/H insurers, 12.8%
- In 2023, catastrophe loss (CATs) performance for P&C insurers was mixed by company. At median, CATs increased slightly (+2.6%), however three companies had an increase in CAT losses of more than +50% vs. prior year. Cumulative reported CAT losses among the 10 P&C companies increased from $12.3B in 2022 to $15.7B in 2023. On average, P&C insurers in our sample recorded CATs for the first half of 2023 that were about 63% of the full year total (36% in 2022), with 7 companies reporting higher CATs in the first half than the second half (1 in 2022).
- A recovery in operating performance in the second half of the year lifted share prices for insurers, with a +6.4% gain in 2023 for the full group of companies. However, share price performance lagged 2022, which had a +18.4% increase, and 2021, which had a +27.4% increase. This also compares with the median 2023 return for the S&P 500 of +12.7%.
Key Observations – Second Half Performance Highlights
|
2022 – 2023 Annual Growth (Median) |
S&P 500 Median TSR1 |
|||||||
|
Revenue |
Premiums |
Net Investment Income |
Catastrophe Losses |
Operating |
Operating |
TSR |
||
|
Property & Casualty (n=10) |
+11.5% |
+9.6% |
+24.7% |
+2.6% |
+21.9% |
+2.3%pt. |
+5.3% |
+12.7% |
|
Life & Health (n=9) |
-1.1% |
— |
+6.8% |
— |
+5.1% |
-0.1%pt. |
+10.1% |
|
|
All Companies (n=19) |
+8.7% |
+9.6% |
+12.1% |
+2.6% |
+9.9% |
+1.5%pt. |
+6.4% |
|
|
First Half 2022 – First Half 2023 Growth (Median) |
S&P 500 Median TSR2 |
|||||||
|
Revenue |
Premiums |
Net Investment Income |
Catastrophe Losses |
Operating |
Operating |
TSR |
||
|
Property & Casualty (n=10) |
+11.9% |
+10.2% |
+17.2% |
+92.1% |
-5.4% |
-0.3%pt. |
-7.2% |
+8.1% |
|
Life & Health (n=9) |
+2.1% |
— |
+5.7% |
— |
-0.4% |
+0.5%pt. |
-0.8% |
|
|
All Companies (n=19) |
+10.3% |
+10.2% |
+9.2% |
+92.1% |
-0.6% |
-0.2%pt. |
-5.7% |
|
Source: S&P Capital IQ & Publicly-disclosed SEC Filings
- Total shareholder return for the S&P 500 is reflective of the median return of all current S&P 500 constituents
- Total shareholder return is measured between January 1 and August 31 for the S&P 500 constituents as of August 31, 2023
- Top line Revenue and Premium growth for P&C insurers for the full year 2023 continued to grow at similar rates as the first half of 2023. L/H insurers experienced a dip in Revenue Growth as the year progressed, posting a -1.1% Revenue decline year-over-year for the full year after increasing +2.1% in the first half of the year.
- Net Investment Income growth for all insurers continued its momentum as the year progressed, with full year 2023 results exceeding the already strong growth reported in the first half of the year.
- Operating Income for the full sample sharply reversed course from where it was tracking for the first half of the year, posting a nearly +10% increase for the full year after a slight decline in the first half of the year.
- After historic increases in CATs for P&C insurers in the first half of 2023, CAT losses slowed in the second half of the year. For the first half of 2023, the 10 P&C companies reported cumulative CAT losses of $9.9B, which was more than double the reported CAT losses for the first half of 2022 of $4.4B. For the second half of 2023, the CAT losses declined compared to the same period last year, from $7.9B to $5.9B.
- Total shareholder return improved from where it was tracking mid-year, reversing from a -5.7% decline year-over year (January 1 through August 31), with a year-end gain of +6.4%.
For questions or more information, please contact the CAP Insurance Team:
Melissa Burek
Partner
[email protected]
212-921-9354
Roman Beleuta
Principal
[email protected]
646-532-5932
Kyle White
Associate
[email protected]
646-568-1161
Matthew Schwarcz
Analyst
[email protected]
646-568-1174
CAP’s Insurance Sample
P&C Companies
- Allstate Corporation
- American International Group, Inc.
- Chubb Limited
- Cincinnati Financial
- CNA Financial Corporation
- Hanover
- Hartford Financial Services Group
- Progressive Corporation
- Travelers Companies, Inc.
- W.R. Berkley.
Life & Health Companies
- Aflac Incorporated
- Genworth Financial, Inc.
- Globe Life
- Lincoln National Corporation
- Manulife Financial Corporation
- MetLife, Inc.
- Principal Financial Group Inc.
- Prudential Financial, Inc.
- Unum Group
CAP's 2023 insurance industry report examines 2022 executive compensation and financial performance across two segments of the industry, including 19 of the largest Property & Casualty (P&C) and Life & Health (L/H) Insurance companies. 2022 median revenue of these companies was approximately $20B.
Key Takeaways
- 2022 performance results were weaker compared to 2021 results. Top-line growth was flat at median while Operating Income was down approximately 20% compared to a very strong 2021, when Operating Income increased by more than 40% at median.
- 2022 bonus payouts, while not as strong as 2021, were generally above target for both industry segments, despite weaker operating performance compared to 2021.
- The median increase to CEO total target compensation for 2022 was 5.6%.
- While operating performance was weaker in 2002, share price returns in 2022 were strong and the insurance industry outperformed the S&P 500. For 2023, however, the industry to date, is underperforming the S&P 500.
2022 Performance: A Step Back Year From 2021
The 2022 performance results for the insurance industry were much weaker compared with 2021. Median Revenue growth for all companies in our study was flat in 2022, down compared to the increase in 2021 of +9.1% and the switch to 5 year CAGR. Median Operating Income decreased 14.9% in 2022, a stark contrast to the +35.2% increase in 2021. ROE and Net Investment Income performance was also weaker. Some of the headwinds for the industry in 2022 included the level of CAT losses for P&C companies and a slowdown in operating results following the post-pandemic recovery for L/H companies.
The P&C industry had solid top-line growth with a revenue increase of 4.3% at median, which was impacted by lower Net Investment Income reported by most companies in our study (median decrease of -5.3%). CAT losses for P&C companies were generally flat in aggregateyear-over-year, yet CAT losses are at peak levels for many companies. Lower Net Investment Income and increased expenses from inflationary pressures, resulted in Operating Income decreasing -14.9% in 2022; following a more robust year of growth in 2021.
At median, revenue declined -4.1% for L/H companies, lagging P&C counterparts. Both Operating Income and ROE also declined (-11.7% and -1.5 pts., respectively) year-over-year, however to a lesser degree compared to P&C companies.
|
Median Revenue Growth |
Median Net Investment Income Growth |
Median Op. Income Growth |
Median Op. ROE Improvement |
Median TSR |
|
|
P&C (n=10) |
+4.3% |
-5.3% |
-14.9% |
-2.3% |
+14.9% |
|
L/H (n=9) |
-4.1% |
-8.3% |
-11.7% |
-1.5% |
+20.1% |
|
Total Sample (n=19) |
0.0% |
-6.3% |
-14.9% |
-2.1% |
+18.4% |
2022 CEO Pay For Performance: Bonuses Still Pay Out Above Target
|
CEO Bonuses |
Median Annual Incentive Payouts |
Median Annual Incentive Payouts |
||||
|
2020 |
2021 |
2022 |
2020 |
2021 |
2022 |
|
|
P&C (n=10) |
102% |
137% |
108% |
385% |
433% |
446% |
|
L/H (n=9) |
89% |
150% |
112% |
254% |
385% |
315% |
|
Total Sample (n=19) |
92% |
150% |
111% |
260% |
383% |
316% |
Bonus payouts for insurance companies generally paid out above target in 2022, yet payouts were not as strong as last year. In our sample, 10 companies paid bonuses above target, 5 paid out bonuses below target and 4 companies paid out bonuses at around target (90% to 110% of target). With the exception of 2020, these insurance companies have tended to pay above target bonuses over the past four years, with only a few select companies paying above 150% of target for CEOs. In 2022 for example, only 3 companies paid above 150% of target. Payouts between P&C and L/H companies were generally similar.
2022 LTI Performance Plan Payouts
|
LTI Payouts |
Median LTI Incentive Payouts (% of Target) |
||
|
2018-2020 |
2019-2021 |
2020-2022 |
|
|
P&C (n=10) |
130% |
123% |
117% |
|
L/H (n=9) |
106% |
130% |
90% |
|
Total Sample (n=19) |
110% |
113% |
112% |
Payouts for performance-based long-term incentive awards for the 2020-2022 period generally paid around target, comparable to payouts in prior award cycles, with P&C payouts slightly higher than those of L/H companies. Payouts for the 2020-2022 award cycle correlate with TSR performance: of the full sample of companies, the half that outperformed the median TSR of all companies had an average payout of 160% of target, and those that underperformed the median TSR had an average payout of 84%.
The TSR and LTI payout relationship holds true for prior performance periods as well. The top half of performers averaged payouts of 139% and 175% of target in the periods ending in 2021 and 2020, respectively. The bottom performers averaged 108% and 79% of target, respectively.
2022 CEO Target Pay: Modest Increases
Median CEO target total direct compensation (TDC) for 2022 increased modestly for most companies in the sample. The median increase in TDC for all CEOs in the sample was 5.6% in 2022. Increases were primarily in the LTI component of pay, which tracks with the broader market. Eight of 19 CEOs received a salary increase in 2022 and 16 of 19 received an increase in the LTI target award, with a median increase of 7.1%.
|
CEO Compensation |
Median Pay Increase by Element |
|||
|
Salary |
Target Total Cash Compensation |
Target Total LTI |
Target Total Direct Compensation |
|
|
P&C (n=10) |
0% |
+2.7% |
+6.1% |
+5.4% |
|
L/H (n=9) |
0% |
0% |
+7.1% |
+5.6% |
|
Total Sample (n=19) |
0% |
+1.2% |
+7.1% |
+5.6% |
Share Price Performance and 2023 Outlook
In 2022, share price returns among these insurers were strong, despite weaker operating performance. Median total shareholder return (TSR) was +18.4% in 2022, with L/H companies (+20.1%) outpacing P&C company returns (+14.1%). 2022 TSR was still lower compared to strong returns in 2021 (+27.4%), yet above the prior five-year average return (+11.0%).
The start of 2023 has proven to be more challenging, with median TSR for the full insurance company sample falling (-8.9%) through May 15, 2023, while the S&P 500 Index is up +8.4%. Performance expectations for the full year 2023 are not as optimistic for most insurers in both P&C and L/H businesses. Companies expect continued headwinds for the remainder of the year, in large part due to broader economic factors (e.g., inflation, interest rates, equity markets).
For questions or more information, please contact:
Melissa Burek
Partner
[email protected]
212-921-9354
Roman Beleuta
Principal
[email protected]
646-532-5932
Kyle White
Associate
[email protected]
646-568-1161
Matthew Schwarz
Analyst
[email protected]
646-568-1174
CAP’s Insurance Sample
Life and Health Companies
- Aflac Incorporated
- Genworth Financial, Inc
- Globe Life
- Lincoln National Corporation
- Manulife Financial Corporation
- MetLife, Inc.
- Principal Financial Group Inc.
- Prudential Financial, Inc.
- Unum Group
P&C Companies
- Allstate Corporation
- American International Group, Inc.
- Chubb Limited
- Cincinnati Financial
- CNA Financial Corporation
- Hanover
- Hartford Financial Services Group
- Progressive Corp.
- Travelers Companies, Inc
- W.R. Berkley
This report examines 2020 compensation and financial performance across two segments of the insurance industry, including seventeen of the largest Property & Casualty (P&C) and Life & Health (L/H) Insurance companies. 2020 median revenue of these companies was approximately $22B. CAP focused on 2020 financial performance, 2020 CEO pay and evolving trends.
Key Takeaways
Pay and Performance. 2020 was an erratic year for all companies. Large insurance companies, however, were generally able to maintain revenue levels and experienced just a modest decrease in operating income, with L/H companies generally underperforming relative to P&C companies. Bonus payouts in the industry tracked with performance and decreased for the second year in the row.
Current Trends in Executive Compensation. Compensation programs remained fairly consistent compared to prior years, but insurance companies are leading most industries in the use of ESG or strategic measures in their compensation programs.
Looking Ahead. Insurance companies will continue to face challenges in setting short and long term goals given inherent volatility in the industry. The increased use of ESG and strategic measures in incentive programs will help align executives with business priorities as Boards continue to focus on diversity, equity and inclusion.
2020 Performance: Somewhat Weaker Performance
The insurance industry overall saw weaker performance compared to recent years. Companies in our study saw flat revenue growth (+0.4%) and operating income loss of 8.1% for 2020 at median. Median TSR was also down (-8.9%), a stark contrast to high returns for 2019 (+25%). S&P 500 companies also saw weaker TSR performance from prior years but was still positive (+10.5%) at median.
The P&C industry generally performed better than L/H companies in our sample. Some segments benefited from fewer accident claims and higher in premium rates, offset in part by greater severity of CATs. Lower interest rates hampered L/H performance.
Catastrophe (CAT) losses were up for P&C companies from 2019 lows and neared 2018 levels. CAT loss volatility impacted individual company results to varying degrees, yet operating income growth netted out flat overall.
Revenue growth for L/H companies was similar to P&C counterparts with overall flat results (-0.7%) at median. Operating income losses were greater, however, with income down 11.7% at median. TSR performance was similarly down 11%, compared to a 20% increase for 2019.
P&C Financial Performance
- Flat revenue in 2020 lagged 2019 median growth of 7.9%.
- Operating Income was flat, down from 2019 growth of 23% at median.
- CAT losses continued to have a mixed impact on individual company results; CAT losses were up for nearly all P&C companies, comparable to 2018 levels on an aggregate dollar value basis.
- Median Operating ROE of 12% consistent with prior year.
- Net Investment Income was down 9.2% at median, compared to 2019 growth of 10.7%.
L/H Financial Performance
- Revenue was flat at median, compared to modest growth of 3.5% in 2019.
- Operating Income down from last year.
- Median Operating ROE of 11.2% declined from prior year.
- Net Investment Income was flat (+1.2%) compared to 2019 modest growth of 4%.
|
|
Median Revenue Growth |
Median Net Investment Income Growth |
Median Op. Income Growth |
Median Op. ROE Improvement |
Median TSR |
|
Property & Casualty |
0.8% |
-9.2% |
0.0% |
-0.3% |
0.6% |
|
Life & Health |
-0.7% |
1.2% |
-11.7% |
-1.0% |
-11.1% |
|
All Insurance |
0.4% |
-3.1% |
-8.1% |
-0.9% |
-8.9% |
2021 Performance Update: Overall, the insurance industry thus far is performing better in 2021 compared to 2020, and is aligned with S&P 500 performance. Median total shareholder return through June 30, 2021 for the S&P 500 companies is 19.9% and median for our insurance company sample is 20.8%, returning to 2019 levels. The L/H industry is generally performing better, with a median return of 26.5% compared to 18.0% for P&C companies.
2020 CEO Pay For Performance: Bonuses Pay Out Near Target
|
CEO Bonuses |
Median Annual Incentive Payouts (% of Target) |
Median Annual Incentive Payouts (% of Salary) |
||||
|
2020 |
2019 |
2018 |
2020 |
2019 |
2018 |
|
|
P&C (n=8) |
102% |
132% |
135% |
385% |
393% |
409% |
|
Life and Health (n=9) |
89% |
112% |
125% |
250% |
278% |
281% |
|
Total Sample (n=17) |
92% |
117% |
125% |
259% |
370% |
283% |
Insurers tended not to make adjustments for COVID and though bonuses trended slightly down overall, pay levels still fared reasonably well. Executive bonus payments in the insurance industry were down compared to 2018 and 2019, yet still paid out around target.
Property & Casualty: Generally flat results for 2020 resulted in bonus payouts around target. Individual company payouts were mixed, with companies paying out both above and below target– most companies paid out in the range of 80% – 120% of target. On a dollar value basis, bonus payouts increased 3%.
Life & Health: Flat to down financial performance in 2020 resulted in bonus payouts slightly below target. All but one company in our sample paid out below prior year results.
Impact of COVID-19 Pandemic
Compared to some industries, the insurance industry was not as severely impacted by the COVID-19 pandemic. On average, large insurers were generally able to maintain flat revenue for 2020 despite bleaker predictions in the spring of 2020. Operating income performance varied, with life insurers seeing greater declines. The impact of COVID was greater on life insurers than P&C companies overall.
Life insurance underwriting became more complicated during COVID as many products may require medical evaluations or other in person contact. In addition to challenges selling new products, underwriting assumptions for in-force policies had to be reevaluated (such as increased volatility, mortality rate adjustments, etc.), which can impact profitability of in-force policies.
For P&C insurance companies, the COVID impact was less severe as many companies accelerated their transition to digital sales/distribution. Operating income also remained flat on average, as accident frequency declined but severity increased in personal lines. COVID claims have been stable, but litigation uncertainty around business interruption cases remains.
With respect to compensation implications, insurance companies generally “took the hit” of performance on bonus payouts. Bonus payouts generally declined for most companies and bonus levels as a percent of target generally tracked Operating Income performance.
Compensation Design Trends
The overall construct of compensation program design remains largely unchanged among the insurance companies reviewed; within core compensation programs, there were few changes or adjustments to incentive plan financial metrics. One trend we did see among insurers, however, was a noticeable increase in the use of Environment, Social and Governance (ESG) and other strategic business imperatives in compensation design. This trend aligns pay plans with the strategic shifts occurring in response to external and customer influences.
Among the P&C companies reviewed, the majority (5 of 8 companies) of annual incentive plans use ESG or company-specific strategic measures when making a payout determination. Among L/H companies, the majority (5 of 9 companies) also used ESG or strategic measures in their bonus programs. Additionally, two P&C companies recently implemented such measures in their long-term performance plans. The insurance companies reviewed generally lead the broader market in use of such measures. We believe the trend of using non-financial measures in determining incentives will continue in 2021 and beyond.
The metrics used vary by company and include diversity, workforce representation, employee engagement, and other measures that may support a company’s strategic focus and long-term goals (such as customer satisfaction, employee engagement, cost savings, etc.). Companies are balanced in terms of the approach used for these metrics and may include use of a specific weighted component, an award modifier, or a discretionary adjustment.
Human Capital Management Disclosure
Effective November 9, 2020, the Securities Exchange Commission (SEC) issued final rules that modernized the requirements of Regulation S-K applicable to disclosure around the description of the business (Item 101). The Human Capital Management section is one area of focus, and the rules require companies to expand their disclosure. The rules are not prescriptive and are principles based, which gives companies flexibility around the details disclosed.
Among the insurance companies reviewed, the level of detail included in the disclosure is generally similar to other large companies in the US. The most common topics include diversity and inclusion, employee engagement, compensation, workforce training/development, and COVID response. A quarter of the insurance companies in our sample disclose quantitative representation statistics around their employee base (e.g., race, ethnic diversity, gender), however the level of detail varies by company. Companies generally did not disclose actual objectives and/or metrics used to manage the business.
Human Capital Management disclosure will become more standardized over time. The SEC has indicated they are considering expanding and standardizing disclosure requirements. On June 23, Gary Gensler said the disclosure “could include a number of metrics, such as workforce turnover, skills and development training, compensation, benefits, workforce demographics including diversity, and health and safety.”
2021/2022 Expectations
From a business standpoint, insurers started 2021 with both opportunities and challenges given strong demand for certain products, continued pressure on costs, and continued economic shifts. It will be a challenge for insurers to establish realistic compensation program performance goals over the short and long term. The movement towards greater use of strategic priorities and ESG related goals in incentive programs, however, will help support business priorities and ensure that executives stay focused on new and changing imperatives as the business and industry evolve.
The importance of digital platforms, the customer experience, product innovation and employee development can be appropriately addressed in pay decisions yet, will require informed judgement. We expect external stakeholders (like major shareholders, proxy advisors, regulators) will push for greater transparency around the process used by Compensation Committees to measure results when making incentive determinations. Even though the use of non-financial measures is increasing, we believe the majority of overall incentive programs will continue to align with the business fundamentals (profitability, ROE, growth) and shareholder returns.
Insurers have been adept at handling market uncertainty and volatility and have demonstrated responsible pay practices over time. They tend to lead in good governance practices and social responsibility. We believe larger challenges lie in developing of human capital – ensuring workers are trained, skilled, and capable of adapting to new ways of doing business. Even with strong talent development strategies, companies will have to manage on many different fronts to attract and retain top talent, with diversity/equity/inclusion becoming the key imperative of most company Boards today.
For questions or more information, please contact:
Melissa Burek Partner
[email protected]
212-921-9354
Roman Beleuta Principal
[email protected]
212-921-9370
Joanna Czyzewski Senior Associate
[email protected]
646-486-9746
Kyle White provided research assistance for this report.
CAP’s Insurance Sample:
P&C Companies
- Allstate Corporation
- American International Group, Inc.
- Assurant, Inc.
- Chubb Limited
- CNA Financial Corporation
- Hartford Financial Services Group
- Progressive Corp.
- Travelers Companies, Inc.
- Aflac Incorporated
- Genworth Financial, Inc.
- Globe Life
- Lincoln National Corporation
- Manulife Financial Corporation
- MetLife, Inc.
- Principal Financial Group Inc.
- Prudential Financial, Inc.
- Unum Group
Life & Health Companies
Compensation Advisory Partners (CAP) assessed human capital actions taken by companies in the Financials sector in response to the COVID-19 pandemic. Key findings include:
- The Financials sector was moderately impacted by the COVID-19 pandemic, with 27% of companies in the S&P Composite 1500 Index taking human capital actions.
- Banks, which often have retail operations, reported the most actions (35%) – many of which were positive for employees, such as expanded time off and healthcare benefits, and one-time bonuses and additional pay for on-site workers
- The five most prevalent human capital actions by Financial Sector are expanded benefits programs, one-time bonuses for non-executives, additional payments for on-site employees (non-executives), reducing CEO base salary, and guaranteed pay continuity for non-executives
- Executive salaries were reduced, particularly in Diversified Financials and Insurance:
- Median salary reductions were 30 percent for chief executive officers (CEOs), while median salary reductions for other executives were 20 percent.
- For boards of directors, pay was cut by a median of 28 percent.
The PDF of the report provides additional data for the Financials sector.
The human capital actions that CAP is tracking include pay cuts; changes to annual and long-term incentives; furloughs; workforce reductions; suspended 401K matches; enhanced health and welfare benefits; additional pay for frontline workers; pay continuity; and workforce expansions. CAP will continue to monitor corporate public announcements of COVID-19 actions.
This report examines 2019 compensation and financial performance across two segments of the insurance industry, including seventeen of the largest Property & Casualty (P&C) and Life & Health (L/H) Insurance companies. 2019 median revenue of these companies was approximately $22B. CAP focused on 2019 financial performance, CEO pay trends and current industry dynamics, including the impact of the COVID-19 pandemic.
Key Takeaways
2019 Pay and Performance. Bonus payouts for insurance company CEOs continued to be above target and commensurate with good financial results and strong total shareholder return in 2019.
Current Environment. 2020 started strong before the COVID-19 pandemic significantly impacted economies with stay at home orders and travel bans. Insurance companies were generally less impacted than other companies that had to take more extreme actions to stabilize business.
Looking Ahead. The COVID-19 pandemic is expected to result in changes in lifestyles and consumer behaviors. We do not believe this will lead to major overhauls in executive compensation programs among insurers. Most companies will make minor changes to their programs, and the primary focus will be on diminishing the impact of future uncertainties on compensation outcomes.
2019 Performance: Another Good Year
The insurance industry saw growth results generally similar to 2018. Companies in our study experienced 5% median revenue growth, coupled with 6% operating income growth in 2019. Median TSR was strong (+25%), a noticeable improvement from 2018; however, the sample did lag the median TSR of the S&P 500 companies of 30%.
The P&C industry generally experienced a better year than the L/H companies in our sample. Catastrophe (CAT) losses were down again in 2019, helping drive better performance. Operating income increased for all the P&C companies in the sample, with a median increase of 23% compared to 18% in 2018. CAT loss volatility continues to impact performance results for each company.
L/H company performance in terms of growth was consistent with the prior year, with a median revenue increase of 3.5% and operating income growth at 1.2%. Contrary to expectations for 2019, the industry experienced two interest rate decreases during the year, which depressed sales of certain products. Despite flat performance, TSR results were strong at +20% at median.
P&C Financial Performance
- Median revenue growth of 7.9% in 2019 was similar to 2018 median growth of 5.5%.
- Operating Income increased by 23% at median, higher growth compared to 2018.
- Similar to prior years, CAT losses had mixed impact on individual company results; CAT losses were down for all companies, nearly 40% at median.
- Median Operating ROE of 11.2% increased 0.9% compared to last year.
- Net Investment Income increased 11.2% at median, compared to 2018 growth of 4.5%.
L/H Financial Performance
- Revenue increased by 3.5% at median, similar to 2018.
- Operating income was flat compared to last year (+1.2%), a decline from 2018 growth at 18%.
- Median Operating ROE of 12.8% declined slightly from prior year.
|
|
Median Revenue Growth |
Median Op. Income Growth |
Median Op. ROE Improvement |
Median TSR |
|
Property & Casualty |
7.9% |
23.4% |
0.9% |
29.4% |
|
Life & Health |
3.5% |
1.2% |
-0.5% |
20.1% |
|
All Insurance |
5.1% |
6.0% |
0.3% |
25.1% |
2019 CEO Pay For Performance: Bonuses Pay Out Above Target
|
CEO Bonuses |
Median Annual Incentive Payouts (% of Target) |
Median Annual Incentive Payouts (% of Salary) |
||||
|
2019 |
2018 |
2017 |
2019 |
2018 |
2017 |
|
|
P&C (n=8) |
132% |
135% |
142% |
393% |
409% |
396% |
|
Life and Health (n=9) |
112% |
125% |
138% |
278% |
281% |
300% |
|
Total Sample (n=17) |
117% |
125% |
138% |
370% |
283% |
318% |
Executive bonus payments in the insurance industry were above target again in 2019, although to a lesser degree than 2018.
Property & Casualty: 2019 was another strong year for the P&C industry. All eight companies experienced positive operating income growth. Performance results for P&C companies resulted in CEO bonuses as percent of target for 2019 that were consistent with prior years. On a dollar value basis, bonus payouts increased by 5% year over year (driven by small increases in salaries and target bonus opportunities).
Life & Health: Modest revenue growth and flat operating income growth for 2019 resulted in reduced bonus payouts for 2019. While payouts are still above target, they were closer to target than in prior years, reflecting financial results.
2020 Developments and Expectations for 2021
This year, the COVID-19 pandemic has led to significant volatility in financial markets, hampered growth for many companies, and transformed social behaviors. This section assesses the impact to-date and future expectations for insurance industry executive compensation and performance.
S&P 500 Performance (through 5/31/2020). Year-to-date, the S&P 500 index has been volatile. Performance was strong before the COVID-19 pandemic disrupted the economy and financial markets. At its highest point on February 19, the index was up 4.8%. Just a little over a month later, on March 23, the index loss was 30.7% for the year. While certain industries were impacted more than others, all industries were down for the year. As the CARES (Coronavirus Aid, Relief, and Economic Security) Act agreement got closer to being passed, markets started rebounding late March. The act will ultimately inject over $2 trillion into the US economy. Despite record unemployment claims, the S&P 500 index recouped most of the losses by the end of May.
S&P 500 Insurance Sector TSR. Insurance companies in the S&P 500 index tracked the index at both the height of the market in February, and the bottom of the market on March 23. As the market began recouping losses, insurers recovered to a lesser degree than other industries. We believe this has been driven by investor sentiment on profitability expectations for insurers due to lower interest rates, increased short-term disability and mortality rates, and uncertainty around potential lawsuits related to business interruption.
|
|
2/19/2020 S&P 500 High |
3/23/2020 S&P 500 Low |
5/31/2020 |
|
S&P 500 Index |
4.8% |
-30.7% |
-5.8% |
|
Insurance Industry Group Median |
4.9% |
-38.2% |
-26.9% |
|
Insurance Industry Rank vs. Other Industry Groups |
6 of 24 |
13 of 24 |
19 of 24 |
COVID-19 Impact on Compensation. As it became apparent that the COVID-19 pandemic would have a more lasting impact on businesses, companies took significant actions to preserve liquidity and conserve costs. More than 200 companies in the S&P 500 have taken temporary compensation or human capital actions. The most prevalent action has been salary reductions for executives, with over 100 companies announcing such actions. The most impacted industries have been retail, consumer services and automotive.
The insurance industry has not been impacted as much as other industries that may have lost significant sources of revenue. As a result, we have seen very few insurance companies reduce compensation or significantly reduce the workforce on a temporary or permanent basis. Instead, many insurers, particularly P&C companies, have announced favorable actions directed at customers, including rebates on certain policies, suspension of policy cancellations for non-payment, and fee waivers for late payments, to help customers through the crisis and retain customer loyalty. Some companies also committed to no layoffs and expanded employee benefits, such as additional paid leave and travel reimbursements for essential employees.
Developments in the Insurance Industry. The impact of the COVID-19 pandemic has been far reaching, and it is unclear what the long-lasting behavior changes will be on daily lives, work habits, and consumer preferences. For insurance companies it will be important to correctly plan for such changes in order to respond with new products, adjust pricing of current products and maintain appropriate digital platforms, among other things.
For the P&C industry, one area of change will likely include revisions to workers compensation insurance and how it applies to the increasing number of telecommuters. Further, P&C insurers have already been impacted by pricing on auto insurance. Incident rates have currently declined as Americans stopped commuting to work and reduced leisure travel. It is not clear if this behavior will continue, or if we will see a surge in driving when COVID-19 is perceived to be more controlled. Enterprise cybersecurity is also becoming more important with millions working from home and creating needs in cyber liability insurance products. In Life and Health insurance companies, the extremely low interest rate environment has forced some insurers to make changes to product offerings, reprice products, turn away certain customers, and increase premiums. The fast pace of change in products is driven in part by increased demand in response to the COVID-19 pandemic. Some life insurers reported over a 20-30% jump in sales in the months of March or April, yet life insurers are also expecting increased claims (e.g., short-term disability and mortality claims) in the remainder of the year, which will put pressure on profitability.
Uncertainty in the industry is also coming from a potential issue around business interruption policies. Many property policies-in-force specifically exclude viruses. For those that do not, interpretation exists around the requirement for physical damage. There is increasing pressure suggesting that insurers may be expected to cover some of the loss from the pandemic, and pressure to retroactively change policies to cover such losses. Lawsuits have followed, with preliminary arguments favoring both sides of the issue. If insurers are ultimately required to change outstanding contracts, the financial impact on the industry could be significant.
2020 Performance Expectations. In light of the expected changes among P&C and Life Insurance companies, we expect financial performance in 2020 to be lower and impact compensation accordingly. Companies will likely pay below target incentives (with just a few falling below threshold and paying no incentives to executives and a few paying above target), yet performance and bonus payouts will vary significantly depending on the line of business.
We believe companies will adjust performance results for COVID-19 to varying degrees. Some will adjust for direct costs of COVID-19 if quantifiable. For example, if companies helped employees with costs of establishing home offices, those costs are easily identifiable and reasonable to exclude as unplanned costs. Some companies will take a more holistic assessment and consider not only financial performance but also how well the company and senior leadership responded in the crisis. It is fairly certain that Compensation Committees will use more discretion (if allowed under the plan) when determining current year bonuses. For long-term incentives, we do not expect many changes to performance goals on outstanding awards, yet some COVID-19 related adjustments to performance will likely be applied when performance periods are completed.
Implications on 2021 Executive Compensation. The COVID-19 pandemic will result in companies in most industries evaluating their incentive compensation plans to determine if any potential design changes should be made on a go forward basis, to ensure that the incentive plans continue to be relevant and motivational during the economic downturn and period of uncertainty. Some of the incentive design changes companies may consider, include:
|
Annual Incentive Plans |
Long-term Incentive Plans |
|
Use of wider performance scales around target goals, which may lead to less volatility in payouts |
Increased use of time-based restricted stock/units, given its certainty and retentive aspect |
|
Increased weighting on (or introduce) individual, strategic or ESG performance components |
Adopting relative performance measures (primarily TSR) or increasing the weight of relative measures |
|
Greater degree of (informed) discretion used in approving final payouts |
Potentially shorter performance periods for performance based LTI to de-risk the overall incentive program. In periods of uncertainty, a longer performance period exposes participants to greater risk of awards not being earned and makes goal setting more challenging. |
We do not expect insurance companies to make sweeping changes to their incentive programs due to the COVID-19 pandemic, yet companies will likely make some changes depending on the expected length and severity of the economic downturn. We anticipate that shareholders will look for parity in treatment between the broader population and executives. While shareholders may be understanding of the significant business impact related to COVID-19, we are confident they will still look for strong business rationale behind pay program decisions, even if original performance objectives have been reconstituted. As companies forge ahead through the challenges presented this year, we also believe it is a very opportunistic time to reassess programs and potentially redefine performance expectations and accountability at both the corporate and individual executive level.
For questions or more information, please contact:
Melissa Burek Partner
[email protected] 212-921-9354
Roman Beleuta Principal
[email protected] 646-532-5932
Joanna Czyzewski Senior Associate
[email protected] 646-486-9746
Brooke Warhurst provided research assistance for this report.
Insurance Sample for Pay for Performance Analysis:
P&C Companies
- Allstate Corporation
- American International Group, Inc.
- Assurant, Inc.
- Chubb Limited
- CNA Financial Corporation
- Hartford Financial Services Group
- Progressive Corp.
- Travelers Companies, Inc.
Life & Health Companies
- Aflac Incorporated
- Genworth Financial, Inc.
- Globe Life
- Lincoln National Corporation
- Manulife Financial Corporation
- MetLife, Inc.
- Principal Financial Group Inc.
- Prudential Financial, Inc.
- Unum Group
This report examines 2018 compensation and financial performance across two segments of the insurance industry, including seventeen of the largest Property & Casualty (P&C) and Life & Health (L/H) Insurance companies. 2018 median revenue of these companies was approximately $22B. CAP focused on key compensation trends, financial performance, and industry dynamics affecting pay practices within the industry.
Key Takeaways
- Insurance industry bonuses for 2018 were down compared to 2017 bonuses, however payouts were still above target.
- 2018 performance results indicated another strong year for insurance.
- Annual incentive plans are slowly beginning to incorporate strategic objectives, including environmental, social and governance (ESG) issues, in bonus determinations. We expect to see increased focus on strategic measures in annual incentive plan designs.
- Long-term incentive practices remained almost unchanged since 2014 in terms vehicle prevalence and mix of awards.
2018 Performance: Solid Financial Results
The insurance industry overall generally experienced stronger financial performance in 2018 compared to 2017. Companies saw higher revenue growth, at a similar pace with 2017, while Operating Income results were more favorable. The stronger results however did not produce shareholder returns in line with financial results. Total shareholder returns of -17% at median for the companies studied was three times lower than the S&P 500 median of -6%, indicating a skeptical shareholder outlook for the insurance sectors.
The P&C industry experienced higher revenue growth in 2018. As far as profitability, Operating Income increased for all but two companies studied, and the median increase was 17.7% compared to 11.1% in 2017. Higher profitability was partly driven by lower catastrophe (CAT) losses in 2018, which declined by approximately 25%, but were still high, because of increased number of wildfires. Climate change has introduced additional uncertainty for property insurers and CAT loss volatility continues to have the potential for significant impact on results.
L/H companies also performed well but revenue only grew 2.8% at median (not a significant improvement compared to prior year). Operating Income results were stronger for the majority of companies. Shareholder sentiment resulted in a TSR decline of 23%, which was impacted by the continued flattening of the yield curve, fee pressure from asset management, and constant/slow increase in inflation.
P&C Financial Performance
- Revenue growth of 5.5% at median in 2018 outpaced 2017 growth of 4.6% at median.
- Operating Income increased by 17% at median, higher growth compared to 2017. Similar to prior years, results varied by company based on the degree of CAT losses.
- Median Operating ROE of 11% improved by 130 basis points.
L/H Financial Performance
- Revenue increased by 2.8% at median, in line with the prior year.
- Operating income grew 17.3% at median, a meaningful increase from 11% in 2017.
- Median Operating ROE of 13.5% improved by 60 basis points.
2018 CEO Pay For Performance: Bonuses Continue to Align with Performance
| CEO Bonuses | Median Annual Incentive Payouts (% of Target) | Median Annual Incentive Payouts (% of Salary) | ||||
| 2018 | 2017 | 2016 | 2018 | 2017 | 2016 | |
| P&C (n=8) | 135% | 142% | 87% | 409% | 396% | 189% |
| Life and Health (n=9) | 125% | 138% | 120% | 281% | 300% | 264% |
| Total Sample (n=17) | 125% | 138% | 100% | 283% | 318% | 258% |
Property & Casualty: 2018 was a good year for the P&C industry. Total CAT losses, while representing an approximate 25% (favorable) decrease from 2017, approximated $11B in 2018 for the 8 companies in our study. All eight companies had lower CAT losses in 2018 and only two of the eight P&C companies had a decrease in Operating Income for the year. Median Operating ROE showed a solid improvement of 1.3%
Results for P&C companies translated to CEO bonus payments as percentage of target that were generally in line with 2017 payments (approximately +/-10%). Three companies had an increase in bonus funding as percent of target that was between 10% and 25% and four companies saw a slight decrease between -3% and -10%. The actual median bonus value however, increased 6.7% for the eight companies driven by higher target bonuses or base salaries.
Life & Health: Although the L/H industry had good Operating Income growth in 2018, the somewhat flat revenue growth put pressure on bonus payouts. Bonus payouts as a percentage of target decreased and are generally back to 2016 levels, however still above target. Only two companies had higher bonuses in 2018 compared to 2017. The median bonus value decreased 16.7% for the nine companies.
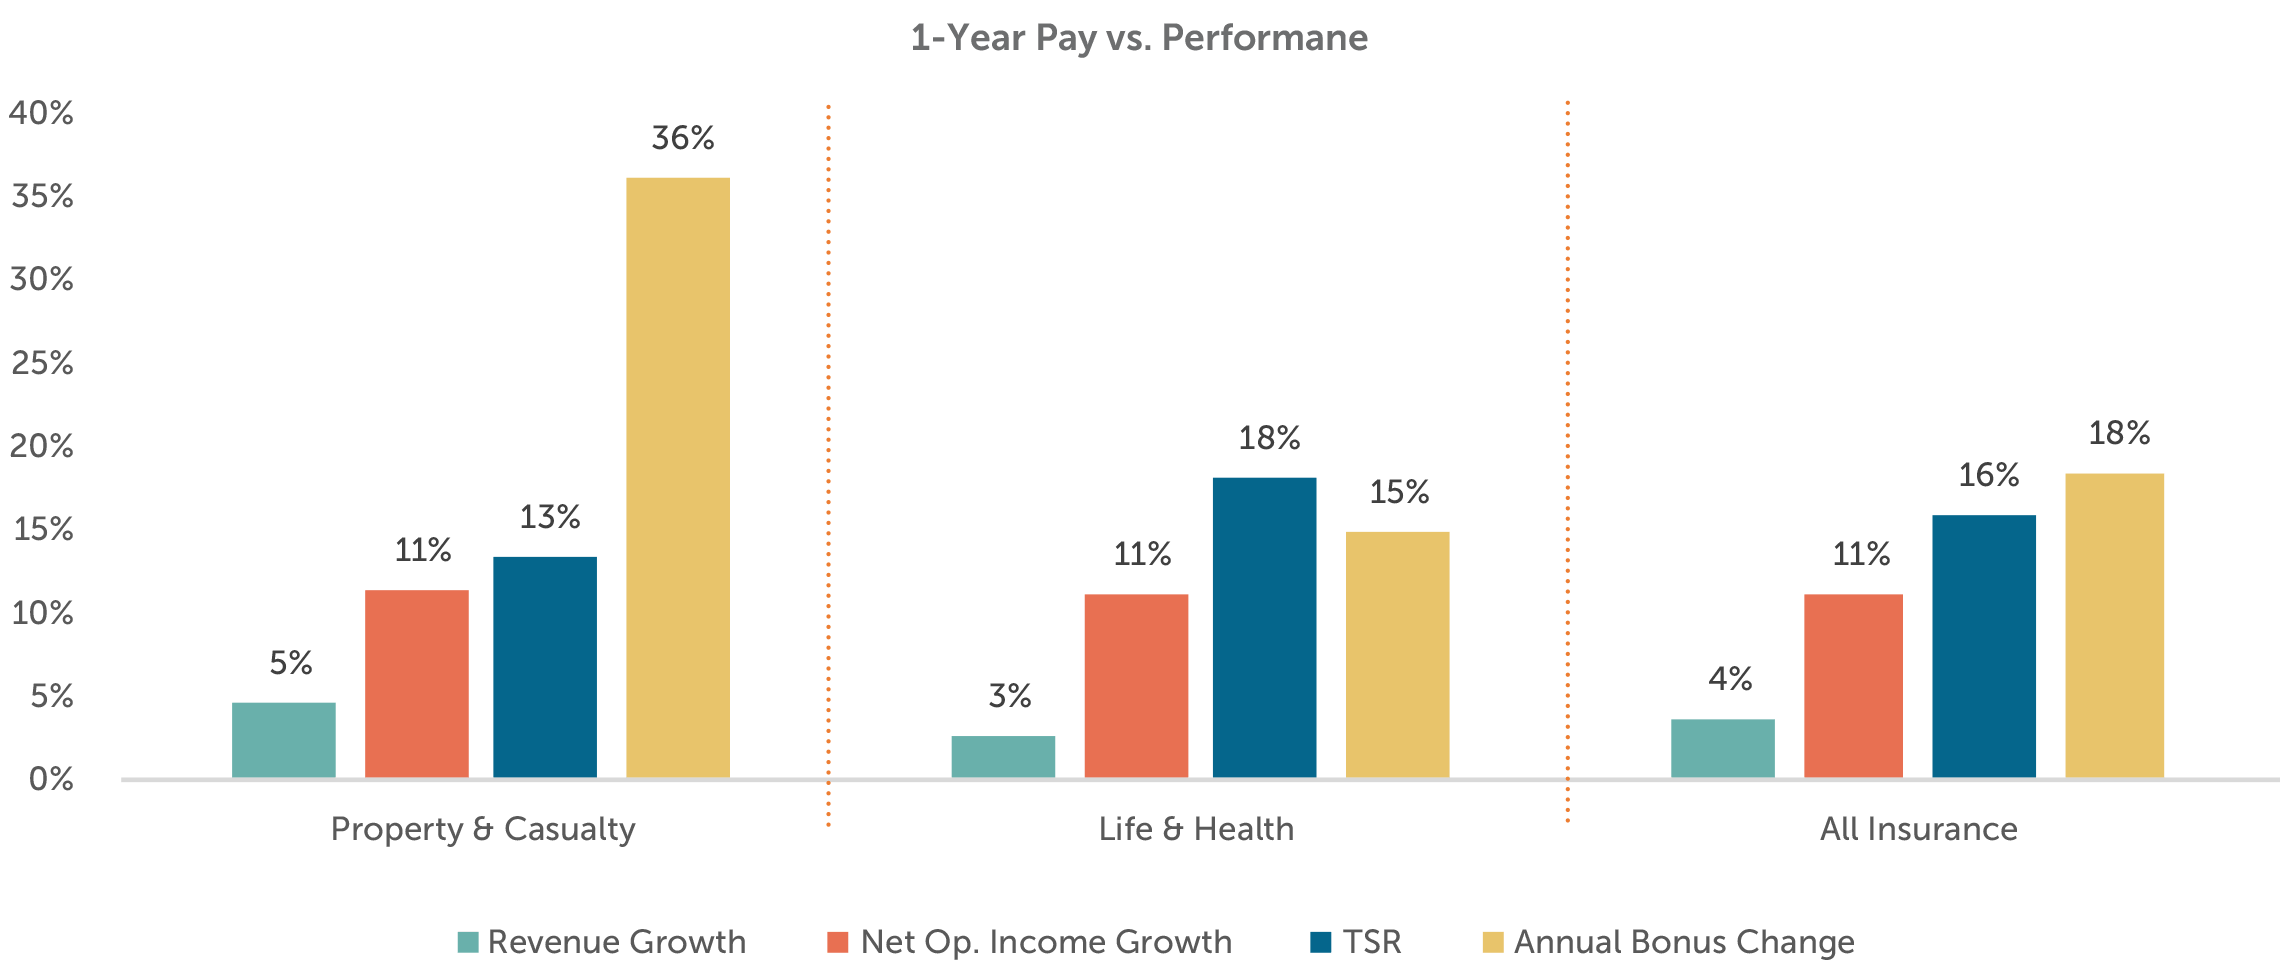
1-Year Pay vs. Performance
| Median Revenue Growth | Median Op. Income Growth | Median Op. ROE Improvement | Median TSR | Median Bonus Payout Change | |
| Property & Casualty | 5.5% | 17.7% | 1.3% | -10.4% | 6.7% |
| Life & Health | 2.8% | 17.3% | 0.6% | -23.2% | -16.7% |
| All Insurance | 3.6% | 17.3% | 0.9% | -17.2% | -0.2% |
Directionally, bonus funding was slightly lower compared to 2017, yet still above target. Above target payouts are in line with overall good financial results.
Annual Incentive Plans
Annual bonuses for the companies in the study were generally based on financial metrics tied primarily to short-term profitability. The most common annual incentive financial metrics among our sample include Operating Income (used by 82% of cos.), followed by Operating ROE (41%) and Revenue/Premiums (35%).
| Most Prevalent Annual Incentive Plan Metrics | |||
| Metric #1 | Metric #2 | Metric #3 | |
| Property & Casualty | Op. Income/EPS (63%) | Op. ROE (38%) | Combined Ratio (38%) |
| Life & Health | Op. Income/EPS (100%) | Revenue/Premiums (44%) | Op. ROE (44%) |
| All Insurance | Op. Income/EPS (82%) | Op. ROE (41%) | Revenue/Premiums (35%) |
Approximately 70% of companies in the sample include an assessment of individual or strategic performance in the determination of CEO bonuses. While most of these companies use a more holistic and subjective review of individual performance, three companies fund a discrete portion of the bonus (between 10% and 25%) based on specific strategic goals. The goals disclosed by these companies include customer experience/satisfaction, technology milestones, employee retention, broader ESG measures (including diversity and inclusion).
Companies design their plans to reward executives for financial results that meet pre-established goals and often make adjustments to financial results for events outside the company’s control. This is not unique to companies in the insurance industry. Insurance companies continue to employ certain approaches to mitigate volatility in financial results and ensure that incentives reflect results controllable by, and reflective of, management actions and decisions. For example, a few P&C companies use budgeted CATs or protective collars around planned CATs or investments to determine incentive plan results, and some others use a more discretionary approach to funding incentives to account for external factors.
More broadly in the market, strategic measures, with specific focus on ESG issues, are becoming more prominent in annual incentive plans. The shift towards a focus on ESG issues in executive incentives is partly driven by select shareholders, as well as continuously evolving state regulations that encourage companies to be more socially responsible. Boards are listening to these concerns and some companies have introduced measures in their incentive plans to support company efforts. Other companies are debating whether executives should be rewarded, through incentives, for becoming better corporate citizens or whether those goals should be implicit as part of company’s culture and vision.
We expect companies to continue to focus on non-financial measures in incentive plans that align with their long-term goals and priorities and support organizational change and culture. The focus on corporate social responsibility will increase and we believe companies will be under more external demands to take specific actions on such issues beyond financial results.
Long-Term Incentive Plans
All companies studied use long-term performance-based incentive plans. Performance plan awards generally represent at least 50% of the overall executive LTI program, and on average account for 61% of the CEO’s LTI program. Stock options and time-based RSUs are used by more than 50% of the sample and on average, each approximate 20% of the remaining LTI value.
| CEO LTI Mix | Other NEOs LTI Mix | |||||
| Stock Options |
RS/RSU | Performance Plan | Stock Options |
RS/RSU | Performance Plan | |
| Property & Casualty | 23% | 12% | 65% | 22% | 15% | 63% |
| Life & Health | 19% | 23% | 58% | 21% | 15% | 64% |
| All Insurance | 21% | 18% | 61% | 22% | 15% | 63% |
Since 2014, three companies in the study added time-based RSUs to their LTI vehicle mix. This increased the average RSU portion of LTI by approximately 5%, with a slight decrease in the stock option component.
| CEO LTI Prevalence | CEO LTI Mix | |||
| LTI Vehicle | 2018 | 2014 | 2018 | 2014 |
| Stock Options | 65% | 65% | 21% | 25% |
| RS/RSU | 59% | 41% | 18% | 12% |
| Performance Plan | 100% | 100% | 61% | 63% |
Within performance plans, the most commonly used metrics include Operating ROE (71%) and Relative TSR (47%). Five of the eight companies using TSR include it as a discrete award component (approximately 50% of the award), and three companies use it as an award modifier. There has not been any significant shift in the use of TSR as a metric. Using a mix of a relative and absolute performance metric helps provide balance and can offset issues associated with setting three-year goals in a volatile industry. Unlike annual incentive plans, we have not seen adoption of individual or strategic performance in LTI awards.
| Most Prevalent Long-Term Incentive Plan Metrics | |||
| Metric #1 | Metric #2 | Metric #3 | |
| Property & Casualty | Op. ROE (50%) | TSR (38%) | Book Value (38%) |
| Life & Health | Op. ROE (89%) | TSR (56%) | Op. Income/EPS (22%) |
| All Insurance | Op. ROE (71%) | TSR (47%) | Book Value (29%) |
Conclusion
The fundamentals for the industry have generally been strong so far into 2019. To date, CATs have been 20% lower among the companies studied vs. 2018, and returns for both the P&C and Life/Health segments have rebounded with year to date total shareholder return at approximately 30% and 20%, respectively. Like many industries however, companies will be impacted by interest rate declines and slower economic growth.
Transformation in the industry is significant and continues to require not only investment and innovation, but workforce skills and competencies that keep pace with the changing nature of the business. The insurance industry relies on data analytics, digitization of products and services, and a customer experience that is faster and more transparent. Companies are working to upskill existing talent, attract and retain new talent, and maintain a culture that supports workforce development and customer focus.
Compensation strategies need to be flexible with changing HR needs. Organizations are developing different pay schemes for specific, high demand talent (such as IT) and for specific businesses (such as online sales/distribution, and emerging niche businesses). As with all facets of HR, successful compensation programs will continue to require flexibility and adaptability, in addition to competitive and performance-based design.
For questions or more information, please contact:
Melissa Burek
Partner
[email protected]
212-921-9354
Roman Beleuta
Senior Associate
[email protected]
212-921-9370
Joanna Czyzewski
Associate
[email protected]
646-486-9746
Brooke Warhurst provided research assistance for this report.
CAP’s Insurance Sample:
P&C Companies
- Allstate Corporation
- American International Group, Inc.
- Assurant, Inc.
- Chubb Limited
- CNA Financial Corporation
- Hartford Financial Services Group
- Progressive Corp.
- Travelers Companies, Inc.
Life & Health Companies
- Aflac Incorporated
- Genworth Financial, Inc.
- Globe Life
- Lincoln National Corporation
- Manulife Financial Corporation
- MetLife, Inc.
- Principal Financial Group Inc.
- Prudential Financial, Inc.
- Unum Group
CAP examined 2017 compensation and financial performance across two segments of the insurance industry including eighteen of the largest Property & Casualty (P&C) and Life & Health (L/H) Insurance companies1. 2017 median revenue of these companies was approximately $19B compared with 2016 median revenue of $18B. The study focused on performance and pay trends and industry dynamics affecting pay practices within the industry.
1 See Exhibit 1 for list of companies included.
Key Takeaways
- Insurance industry bonuses for 2017 performance were up year over year in spite of major catastrophes that weighed on the P&C industry.
- Annual incentive plans in the P&C industry take varying approaches to deal with the impact of catastrophes on earnings.
- We expect to see increased focus on digital innovation and improved customer experience in annual incentive plan designs.
- Long-term incentives continue to emphasize performance plans with Operating Income, ROE and Relative TSR as the primary measures used.
2017 Performance: Financial Results Improve Despite Industry Challenges
The insurance industry saw an uptick in financial performance in 2017 compared to 2016. While 2017 presented some significant challenges for certain segments of the industry, revenue and operating income growth overall were stronger in 2017, and ROEs overall were flat, though stronger in some industry segments. Notwithstanding such improvements, the insurance industry slightly underperformed the broader stock market, with median TSR of 16%, just below the S&P 500 median TSR of 20%.
The P&C industry experienced record catastrophe (CATs) losses and continued to be challenged by loss frequency and severity. Some of the earnings pressure was eased however, by improved investment income results, operational improvements, and adequate capital levels that helped companies withstand losses.
L/H companies did not experience as strong of an interest rate environment as originally expected yet did benefit from modest economic improvement/healthy economy and continued demand for certain products. L/H companies were challenged by the uncertainty surrounding the U.S. DOL’s fiduciary rule, weaker annuity sales, and changing consumer preferences.
P&C Financial Performance
- Revenue growth of 4.6% at median for the P&C businesses this year outpaced prior year increase of 2.6% at median.
- Operating Income increased by 11% at median, an improvement over 2016. Results varied dramatically by company however, with the degree of CAT losses impacting profitability.
- Operating Income ROE was approximately 8%, reflecting a decline versus the prior year, yet ROE increased for five of nine P&C companies.
L/H Financial Performance
- Revenue increased by 2.5% at median, in line with the prior year increase.
- Operating income increased 11% at median, an improvement from 2016.
- Operating Income ROE improved from 12% to 13%, with stronger ROE at seven of nine L/H companies.
2017 CEO Pay for Performance: Bonuses Align with Performance
| CEO Bonuses | Median Annual Incentive Payouts (% of Target) | Median Annual Incentive Payouts (% of Salary) | ||||
| 2017 | 2016 | 2015 | 2017 | 2016 | 2015 | |
| P&C (n=9) | 170% | 74% | 126% | 393% | 225% | 245% |
| Life and Health (n=9) | 142% | 120% | 93% | 300% | 264% | 186% |
| Total Sample (n=18) | 145% | 100% | 102% | 309% | 254% | 243% |
Property & Casualty: 2017 was a turbulent year for the P&C industry; notably, CAT losses increased 122% at median for the companies in our study. While profitability was impacted at some companies more than others, 2017 results were generally stronger than 2016. Five of the nine P&C companies had an increase in Operating Income for the year.
Results for P&C companies translated to an increase in CEO bonus payments from 225% of salary in 2016 to 393% of salary in 2017. In all but one company, CEO bonuses changed in the same direction as the change in Operating Income results; five of nine companies saw bonuses increase, while four were flat or down. The median bonus increase was 36% compared to an overall decrease last year.
Life & Health: The L/H industry delivered positive results in 2017, somewhat stronger than in 2016. Operating Income increased in seven of the nine companies. After seeing an increase in bonuses for 2016, L/H companies saw bonuses increase again in 2017 from 264% to 300% of salary at median, and all but two companies had an increase in CEO bonuses over the prior year. The median bonus increase was 15% overall.
Despite some challenges in certain industry segments, the general direction of CEO bonuses was even more aligned with financial performance results among insurance companies in 2017 vs 2016.
Annual Incentive Plans
The financial metrics underlying annual incentive plans are often tied to short-term growth and profitability. Accordingly, the most common annual incentive financial metrics used by companies in our study are Operating Income (used by 83% of companies), followed by ROE (39%) and Revenue/ Premiums (39%). Approximately two-thirds of the companies in CAP’s sample include an assessment of individual performance in the determination of the CEO bonuses.
| Most Prevalent Annual Incentive Plan Metrics | |||
| Metric #1 | Metric #2 | Metric #3 | |
| Property & Casualty | Op. Income (67%) | Op. ROE (33%) | Combined Ratio (33%) |
| Life & Health | Op. Income (100%) | Revenue (56%) | Op. ROE (44%) |
| All Insurance | Op. Income (83%) | Op. ROE (39%) | Revenue/Premiums (39%) |
Insurance companies can experience a great deal of volatility in their financial results from year to year, impacted by interest rates, catastrophic events, and regulatory changes, among other things. Further, gains/losses from various insurance products are realized over differing time periods and investments are longer term in nature.
Incentive plan payouts are generally driven by the degree to which financial results meet pre-established goals. To date, however, companies have employed various approaches to mitigate some of the volatility in financial results and ensure that incentives reflect results controllable by, and reflective of, management actions and decisions. A few select companies use budgeted CATs or a protective “collar” around CATs or investments to determine incentive plan results, and others use discretionary funding to allow for consideration of external factors.
In the future we expect to see greater use of performance measurement around what we classify as strategic objectives. These may include new business, strategic investments/ acquisitions, customer service, technology improvements/ capabilities, as well as diversity and risk management. Companies incorporate these criteria through an individual performance assessment and resulting award modification, or in some cases, by funding a small award component based on strategic or individual performance results.
In particular, we believe that innovation/digital capabilities and the customer experience, will increasingly be a part, albeit small, of incentive decisions. Measuring results and defining success in these areas is challenging, yet most companies are already having discussions around these critical issues.
Long-term Incentive Plans
A strong majority of insurance companies use long-term performance-based incentive plans. These performance plans account for at least 50% of the overall executive LTI program for all but one company, and on average they account for 62% of the CEO’s LTI program. Almost all companies use a 3-year performance period.
| CEO LTI Mix | Other NEOs LTI Mix | |||||
| Stock Options | RS/RSU | Performance Plan | Stock Options | RS/RSU | Performance Plan | |
| Property & Casualty | 19% | 14% | 66% | 19% | 16% | 65% |
| Life & Health | 19% | 23% | 58% | 23% | 21% | 57% |
| All Insurance | 19% | 19% | 62% | 21% | 18% | 61% |
The most commonly used metrics in long-term performance plans are Return on Equity (67%) and Relative TSR (56%), and the combination of ROE and Relative TSR is used by 39% of companies. The use of a relative metric (most often TSR) in conjunction with an absolute financial metric helps provide balance and can offset issues associated with setting three-year goals in a volatile industry.
| Most Prevalent Long-Term Incentive Plan Metrics | |||
| Metric #1 | Metric #2 | Metric #3 | |
| Property & Casualty | TSR (56%) | OI ROE (44%) | Book Value (44%) |
| Life & Health | OI ROE (89%) | TSR (56%) | Op. Income (33%) |
| All Insurance | OI ROE (67%) | TSR (56%) | Op. Income; Book Value (28%) |
To date, we have not seen individual or ‘strategic’ performance considerations impact LTI award grant levels or payouts, as they do for many companies in the annual incentive plan.
Conclusion
We expect the insurance industry will continue to see improvements in performance in the near future. Insurance companies should benefit from the rising interest rates, a faster-growing economy, and a more business-friendly regulatory environment, including the recent developments around the DOL fiduciary rule.
The insurance industry is competitive however, and companies will increasingly need to compete not only on pricing and customer service, but also on the ability to tailor product offerings and delivery methods for the new generation of consumers. Consumers are becoming more tech savvy and may purchase many of their products and services online. Companies will need to focus on new methods of consumer outreach and improving their digital platforms.
While we expect the industry overall to continue to grow, some companies will struggle and some will thrive depending on their abilities to react to the shift in consumer demographics and demand preferences, to reach even greater operational efficiencies, and to respond to the need for digitalization. While most Compensation Committees strive for simplicity in pay programs, we expect companies to increasingly incorporate progress in key strategic areas in the annual incentive program given their importance. We also expect companies to continue to spend great effort on the goal setting process given the inherent volatility in the industry.
Additional Information – New CEO Pay Ratio Disclosure
Seventeen of the companies in CAP’s sample were required to disclose the ratio of their CEO pay to that of the median employee in 2018. The reported CEO pay ratios among CAP’s sample ranged from 84:1 to 301:1 with a median ratio of 178:1. Given company business models and the flexibility that companies have in the methodology/assumptions used to calculate the ratio, comparisons of ratios between companies are less meaningful. To date, institutional investors and proxy advisory firms have not used disclosed CEO pay ratios to inform their voting decisions. We may see some year-over-year comparisons in the second year of disclosure.
For questions or more information, please contact:
Melissa Burek Partner [email protected] 212-921-9354
Kyle Eastman Associate [email protected] 212-921-9370
Roman Beleuta Senior Associate [email protected] 646-532-5932
Joanna Czyzewski Associate [email protected] 646-486-9746
Kyle Clemenza provided research assistance for this report.
CAP’s Insurance Industry Sample
P&C Companies
- Allstate Corporation
- American International Group, Inc.
- Assurant, Inc.
- Chubb Limited
- CNA Financial Corporation
- Hartford Financial Services Group
- Progressive Corp.
- Travelers Companies, Inc
- XL Group plc
Life & Health Companies
- Aflac Incorporated
- Genworth Financial, Inc
- Lincoln National Corporation
- Manulife Financial Corporation
- MetLife, Inc.
- Principal Financial Group Inc.
- Prudential Financial, Inc.
- Torchmark Corporation
- Unum Group


