Video available through American Banker, subscription required
2020 was a challenging year for banks. The impact of COVID on the economy as well as changes to accounting for loan loss provisions were evident in weaker financial and stock price performance in 2020 for many banks and yet CEO compensation increased. Learn from experienced executive compensation consultants about the challenges Compensation Committees faced in 2020, why pay levels increased relative to 2019, what were common COVID-related compensation changes, and what changes were made for the 2021 incentive plan design. Also, hear about if and how banks are linking executive compensation to diversity and inclusion metrics given the increased focus on ESG. The compensation consultants will share findings from their 2020 compensation study, lessons learned from 2020, and best practices for 2021 and beyond.
Compensation Advisory Partners (CAP) examined 2019 CEO compensation levels and pay and governance practices among 40 companies in the regional bank industry. The banks were stratified into three groups based on FY’19 asset size: $1B – $5B in assets (“small banks”; n=13), $5B – $10B in assets (“medium banks”; n=13) and $10B – $20B in assets (“large banks”; n=14). This report discusses both the similarities and differences in compensation levels, incentive plan design and governance practices between the three groups. We also highlight current issues facing the banking industry in 2020 and as we head into 2021.
Highlights
- Total Pay Mix: As banks increase in size, a higher percentage of CEO total pay shifts from fixed compensation to at-risk or variable compensation
- 2019 Financial Performance: Banks performed well in 2019 resulting in annual incentive payouts around target for all three groups; however, CEO annual incentives were lower than in 2018 as 2019 financial performance lagged 2018 growth levels
- Annual Incentive Plan Metrics: For all banks, the most prevalent metrics generally include Efficiency Ratio, Asset Quality, Return on Assets (ROA), Earnings Per Share (EPS), Return on Equity (ROE), and Net Income with smaller banks also factoring in Loan and Deposit levels more frequently
- Long-Term Incentive Plan Metrics: For all banks, relative Total Shareholder Return (TSR), EPS, ROA and ROE are frequently used together. Medium and large banks are more likely to measure performance on both an absolute and relative basis
- Stock Ownership Guidelines: All large banks have policies in place for executives compared to less than three-fourths of small and medium banks
- Clawback Policy: Across all banks in our study, over 80 percent have a policy that extends beyond Sarbanes-Oxley requirements. More of the large banks have a policy in place compared to the small and medium banks
- Looking Ahead: The impact of COVID-19 on incentive plans and the 2020 presidential election is creating a lot of uncertainty as banks close out 2020 and prepare for 2021. Additionally, diversity and inclusion will continue to gain attention and is a topic increasingly discussed at the Compensation Committee and Board level
Chief Executive Officer (CEO) Actual Pay Levels and Mix
Similar to our findings in prior year studies, CEOs at the larger banks have higher pay levels and more of their total pay delivered in at-risk or variable compensation, such as annual or long-term incentives. Conversely, executives at smaller banks are often paid more fixed compensation or base salary. For banks, asset size is a strong indicator of complexity as larger banks have more branches, products, and services offerings, corresponding to greater challenges and risks for management.

Specifically, 52 percent of compensation was fixed at the small banks compared to 43 and 32 percent at the medium and large banks, respectively. Larger banks also grant more compensation in the form of equity, which is tied to either multi-year vesting and/or performance criteria. These equity grants make up 32 percent of medium bank pay for CEOs and 40 percent at the large banks in the sample. By comparison, small banks only grant 21 percent of their compensation in these long-term equity vehicles.
2019 Performance and Pay Outcomes
Performance Results
Financial performance showed strong growth in 2019. Comparing 2018 to 2019, 2018 was a better year for the banks, which can be attributed, in part, to three interest rate cuts in 2019 (first rate cuts since 2008), creating pressure on net interest margins. Small banks had the strongest performance year among the three groups in 2019 with the majority performing in line with analyst expectations. Large banks had the weakest performance year among the three groups as more than half of the large banks underperformed against analyst expectations. ROE increased for only the small banks and one-year TSR was strong for all groups, significantly outpacing 1-year 2018 TSR. Strong 2019 TSR was consistent with the upward TSR trend seen in the overall market and super regional and Wall Street banks.
|
Metric |
Median Percent Change Year Ended December 31, 2019 |
||
|
Asset Size |
|||
|
$1B – $5B |
$5B – $10B |
$10B – $20B |
|
|
EPS |
+15.1% |
+7.8% |
+4.6% |
|
Net Income |
+16.6% |
+11.6% |
+5.9% |
|
Pre-tax Operating Income |
+16.9% |
+10.5% |
+10.0% |
|
Return on Equity |
+28 bps |
-3 bps |
-81 bps |
|
1-Year TSR at 12/31/19 |
+27.4% |
+24.9% |
+24.7% |
|
1-Year TSR at 12/31/18 |
-10.5% |
-16.4% |
-16.4% |
bps – Basis points
Source: S&P Capital IQ Financial Database
CEO Annual Incentive Payouts
Overall, the small banks had the strongest year of the three groups in 2019 based on the financials reviewed. This performance was ultimately rewarded by annual incentive plans, as seen in CEO annual incentive payouts. Small banks had the highest annual incentive payouts as a percentage of target, 109 percent, and only four banks in the small bank group paid annual incentives at or below target, compared to seven banks each in the medium and large bank sample. Annual incentive payouts across all groups declined from 2018 levels, where all three groups generally paid out above target.
|
CEO Payout as % of Target |
Asset Size |
||
|
Summary Statistics |
$1B – $5B |
$5B – $10B |
$10B – $20B |
|
75th percentile |
119% |
100% |
121% |
|
Median |
109% |
100% |
103% |
|
25th percentile |
92% |
95% |
95% |
Total Pay Changes
CEO actual total compensation (base salary, annual incentive payouts, and long-term incentives) increased in 2019. The largest increases were at the large and small banks (9.6% and 5.2%, respectively) which was driven by a combination of base salary increases and larger long-term equity grants. While annual incentives were paid at target for medium banks, 2019 bonus opportunity increases led to a 14.6% year over year increase in value. The increase in long-term incentives was likely due to strong performance in 2018, as long-term incentives are generally granted in the first quarter (early 2019) and based on prior year (2018) performance. Large banks performed stronger in 2018 compared to the small and medium banks, which may explain the larger year-over-year increase in long-term incentives.
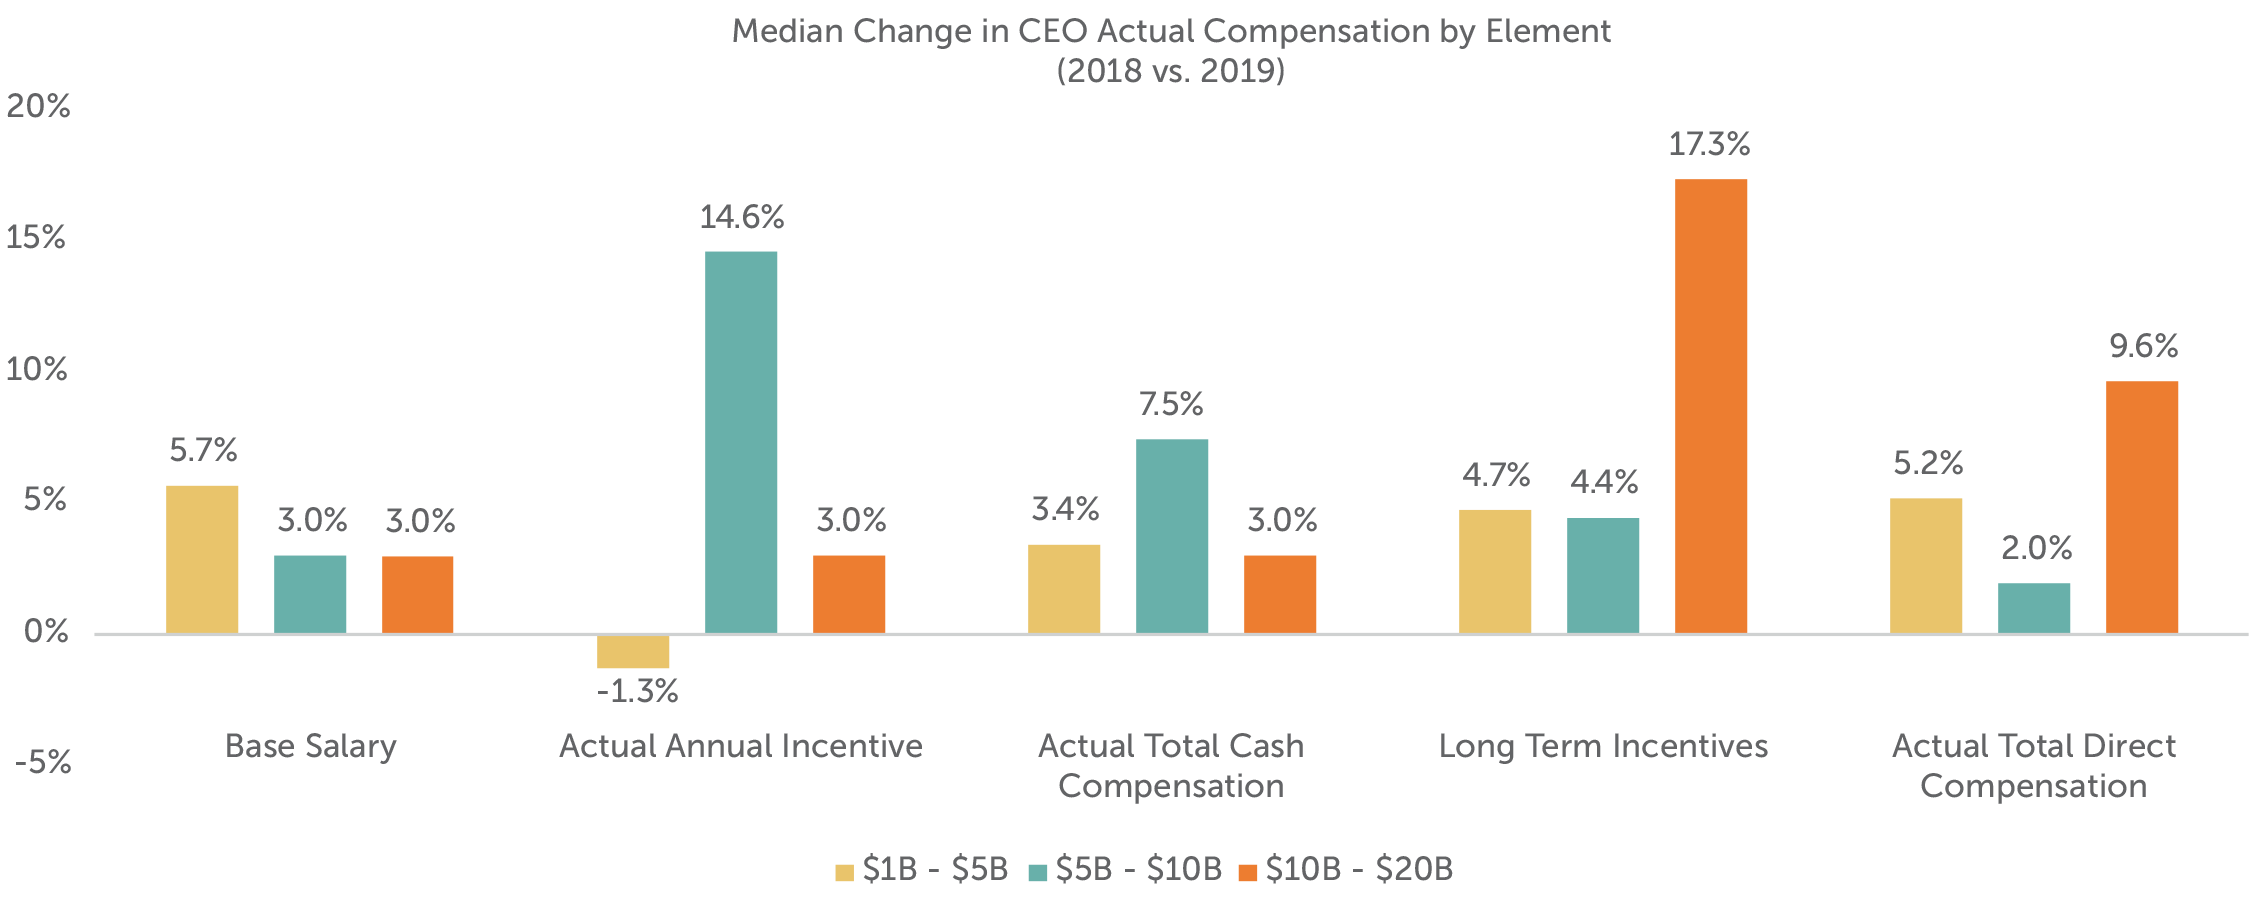
Note: Excludes companies where there was a change in CEO
Pay Practices
Annual Incentive Plans
The most common annual incentive plan approach is a “goal attainment” plan where actual financial achievement is compared to pre-established goals made at the beginning of the fiscal year. The banks in our sample typically utilize several corporate metrics when determining their annual incentive payout. Approximately 75 percent of the small, medium, and large banks use three or more weighted financial metrics. Efficiency Ratio, Asset Quality (i.e., non-performing assets, non-performing loan ratio), ROA, EPS, ROE and Net Income are the most prevalent metrics used at these banks. Returns (ROA or ROE), EPS and Net Income were typically weighted more (approximately 30-40 percent of the total plan) than Efficiency Ratio and Asset Quality metrics (approximately 15-20 percent of the total plan). The small banks differ from the medium and large banks in that they more frequently use Loan or Deposit measures in their plans, with these metrics accounting for no more than 20 percent of the total plan.

Smaller banks also tend to use and assign higher weightings to individual performance. In all cases they represent 20-50 percent of the total plan as a standalone weighted metric. These individual measures are prevalent at 46 percent of the small banks studied compared to 14-15 percent of the medium and large banks; however, the medium and large banks are more likely to incorporate strategic goals such as digital strategies, community presence or customer satisfaction.
Long-term Incentive (LTI) Plans
The most typical long-term incentives used across industries, including the banking industry, include stock options, time-vested stock (restricted stock (RS) or restricted stock units (RSUs)) and performance-vested stock. Most medium and large banks use a portfolio approach in their long-term incentive plan, with approximately two-thirds of these banks granting two or three LTI vehicles. The small bank sample more frequently either uses a single LTI vehicle (38%) or has no long-term incentive plan (15%). The LTI mix seen between the three groupings is fairly consistent, with stock options continuing to be the least utilized LTI vehicle, on average about 8 percent of the overall LTI mix. Time-vested restricted stock typically makes up about 30 percent to 40 percent of the LTI mix among these banks, with performance plans making up the bulk (about 50-65%) of LTIs in the total sample.

Performance plans are typically granted annually and have overlapping 3-year performance periods. Payouts can fluctuate based on achievement of performance measures, and the upside is normally limited to 150 percent to 200 percent of the target level. Over three-quarters of companies in each asset grouping (that utilize performance plans) measure performance against two or more metrics. The most prevalent metrics used are relative TSR, Returns, EPS, and Asset Quality for all three groupings, and it is common that two of these measures are paired together to determine all, or the majority of, the payout. Asset Quality is a fairly prevalent metric among medium sized banks (used by a third of the companies).
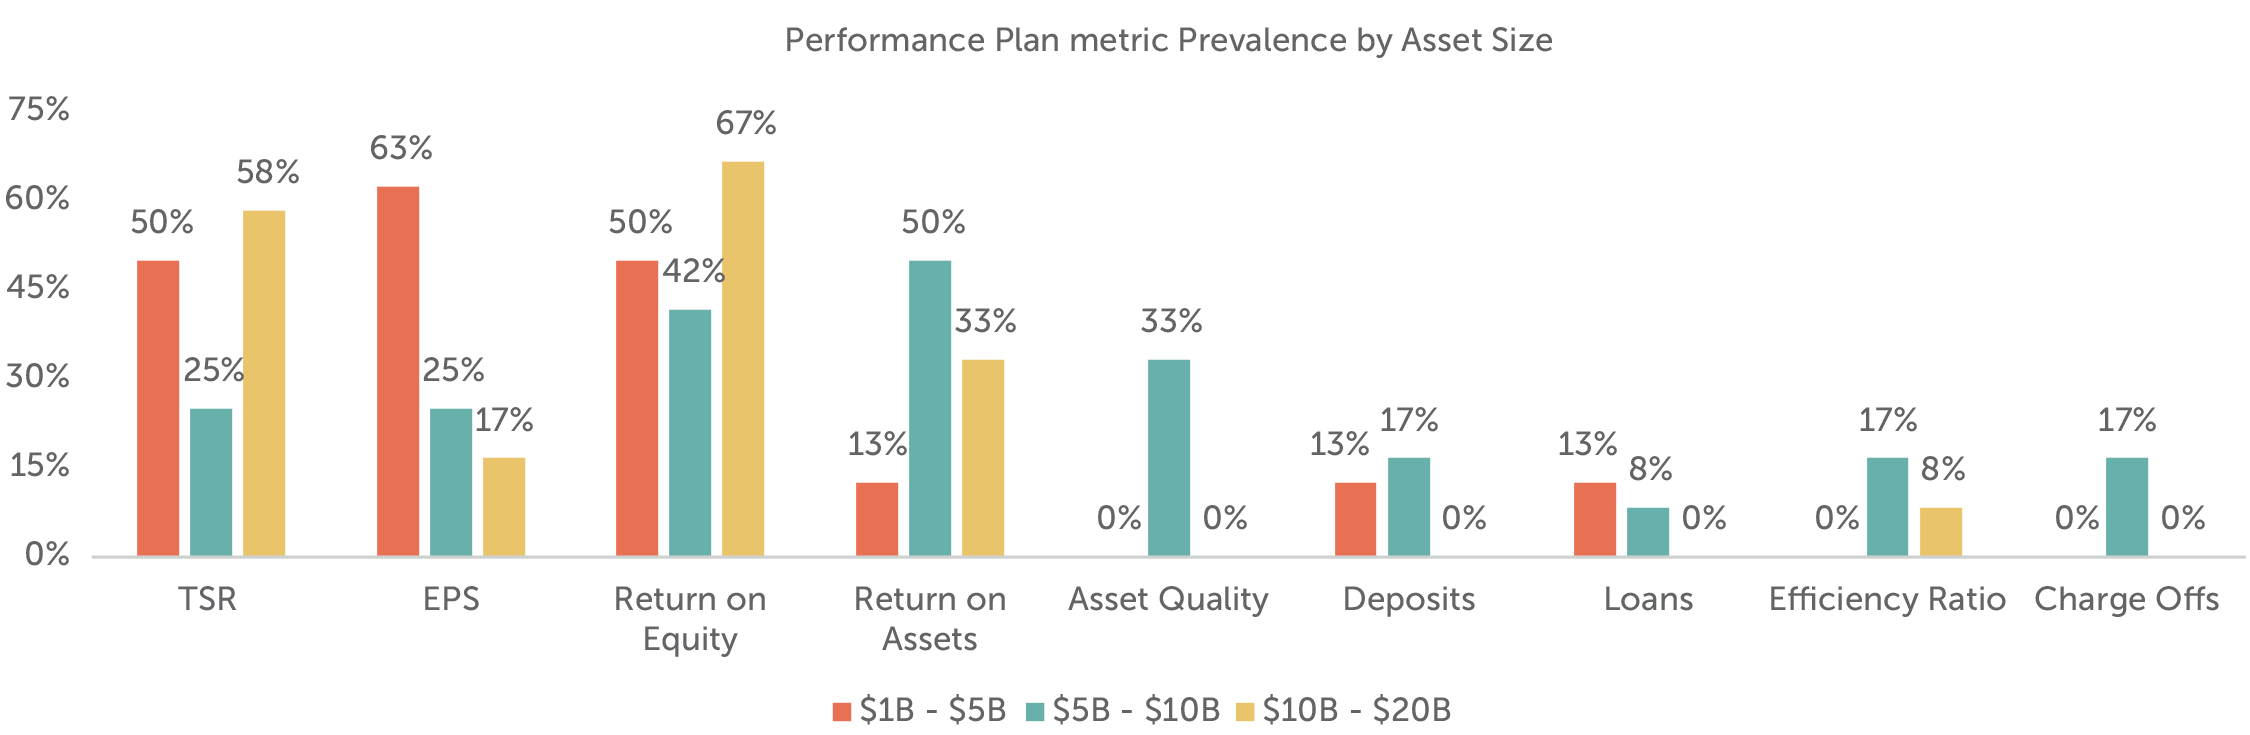
As banks increase in size, it becomes more likely that both absolute and relative comparisons are made when determining payouts; 42 percent of the large and medium banks look at performance on both an absolute and relative basis compared with 12 percent of small banks. These smaller banks may be challenged in setting 3-year goals, and, therefore, rely more heavily on relative performance.
|
Asset Size |
Performance Plan Measures |
||
|
Measurement Type(s) |
|||
|
Absolute |
Relative |
Both |
|
|
$1B – $5B |
25% |
63% |
12% |
|
$5B – $10B |
33% |
25% |
42% |
|
$10B – $20B |
16% |
42% |
42% |
TSR is almost exclusively measured on a relative basis, often measured against either the company-defined peer group or an industry index. In our sample of banks, relative TSR is more commonly installed as a weighted metric and only 5 percent of all banks use it as a modifier of the calculated payout. Other common relative metrics include Returns, EPS and Loan or Deposit growth.
Governance Practices
Stock Ownership Guidelines
The prevalence of stock ownership guidelines among the different asset groupings varies by group. All of the large banks have stock ownership guidelines in place for the named executive officers (NEOs) compared to 69 percent at the medium banks and 54 percent at the small banks. The larger banks grant a larger portion of long-term incentives in equity; therefore, it should not be surprising that executives must meet a required ownership guideline.
|
Asset Size |
Stock Ownership Guidelines |
|
|
CEO |
Other NEOs |
|
|
$1B – $5B |
62% |
54% |
|
$5B – $10B |
69% |
69% |
|
$10B – $20B |
100% |
100% |
Clawbacks
The proposed rules under the Dodd-Frank Act require companies to adopt policies that would claw back incentive compensation paid to current and former executives based on inaccurate financial results. Despite the rules being proposed in 2015 and not being finalized to date, many companies have adopted policies that are similar to the anticipated rules. Among our sample of banks, 83 percent of banks across all asset sizes have a clawback policy in place. The prevalence is greatest among the large banks.
|
Asset Size |
Clawback Policy |
|
Percent of Companies |
|
|
$1B – $5B |
77% |
|
$5B – $10B |
77% |
|
$10B – $20B |
93% |
Approximately 50 percent of the banks across all asset sizes have clawback triggers for financial restatement regardless of fraud or misconduct and 36 percent of banks can recoup incentive compensation due to fraud, misconduct, or material inaccurate financials beyond a financial restatement.
It is common for organizations to adopt stronger governance protocols such as stock ownership guidelines and clawback policies as they increase in size and may be more closely scrutinized by investors, regulators, and proxy advisory firms.
Looking Ahead
Impact of COVID-19 on Incentive Plans
Many banks set their 2020 incentive plan goals early in the year, before the onset of the COVID-19 pandemic in the U.S. As the second half of 2020 continues and the true economic impact of COVID-19 is felt globally, CAP expects some banks to use discretion to adjust 2020 annual incentive payouts, widen or change goals for outstanding performance-vested LTI goals and modify the 2021 annual incentive and LTI design. Most banks are waiting until year end to make specific decisions on any potential adjustments to incentives, as companies will try to quantify the COVID-19 related impact and address elements that were outside of management’s control (i.e., zero interest rate environment). Further, with stock prices down over 30 percent to date, equity worth less today compared to the grant date fair value, and annual and long-term performance plans projected to pay out well below target, Compensation Committees may feel the pressure to adjust incentive plan payouts or award retention bonuses in order to motivate and retain key talent.
Diversity and Inclusion Metrics in Incentive Plans
Diversity and inclusion is a topic that is increasingly being discussed among Board members and Compensation Committees specifically. With a growing focus on increasing diversity in the industry, the natural question is whether such initiatives should be included in compensation decision making. One large bank in our sample considers the achievement of certain diversity and inclusion targets as part of its individual assessment. While currently a minority practice to include diversity and inclusion measures in incentive plans, a discussion around each banks' diversity and inclusion statistics is increasingly becoming an agenda topic at Board meetings.
Given today’s climate, CAP expects an increase in the number of companies measuring the progress of diversity though the approach may vary between a quantitative metric or a more qualitative assessment. Compensation Committees have the flexibility to tailor goals that will impact payouts to the executives most responsible for this progress. The inclusion of diversity and inclusion progress in incentive compensation plans could highlight the importance of a company’s commitment to these objectives.
2020 Presidential Election
The banking industry has generally benefited from the policies of the current administration and reduced level of regulations. Two recent pieces of legislation have had a positive impact on the banking industry’s financial performance.
- 2017 Tax Cuts and Jobs Act: Meaningful benefit for corporations due to the reduced corporate tax rate
- 2020 Coronavirus Aid, Relief, and Economic Security Act: Benefited banks from fee income related to the Paycheck Protection Program loans
By contrast, the Democratic candidate Joe Biden plans to raise taxes and stiffen oversight of the banking industry. Given the uncertainty regarding taxes and regulation, banks financials may be impacted with an increase in taxes and heavier regulation in 2021 and beyond.
Conclusion
Compensation program practices have remained steady among our sample of banks. We expect to see changes in 2020 and beyond given the pandemic and focus on diversity and inclusion. As was the case after the 2008/2009 financial crisis, the ability to adjust and adapt to a changing environment is critical to the success of banks in attracting, motivating, and retaining key talent. While employee retention will be a key objective for management and Compensation Committees, banks must balance rewarding employees for their extraordinary efforts in response to the pandemic with pay for performance alignment and the shareholder experience. Further, given the heightened focus on diversity and inclusion and public commitments to diversity, companies are committing resources for initiatives aimed at promoting a diverse and inclusive workplace. We expect banks in our study to continue their efforts to make progress on the diversity and inclusion front.
For questions or more information, please contact:
Kelly Malafis Partner [email protected] 212-921-9357
Shaun Bisman Principal [email protected] 212-921-9365
Chris Callegari Senior Analyst [email protected] 646-486-9747
Stefanie Kushner and Felipe Cambeiro provided research assistance for this report.
Regional Banks in CAP’s Study (n=40)
Small Banks ($1B – $5B in assets)
- Bridge Bancorp, Inc.
- Capital City Bank Group, Inc.
- Central Valley Community Bancorp
- CNB Financial Corporation
- Evans Bancorp, Inc.
- Farmers National Banc Corp.
- First Business Financial Services, Inc.
- First Financial Northwest, Inc.
- German American Bancorp, Inc.
- Heritage Commerce Corp
- Independent Bank Corporation
- National Bankshares, Inc.
- Sierra Bancorp
Medium Banks ($5B – $10B in assets)
- 1st Source Corporation
- Amerant Bancorp Inc.
- Banc of California, Inc.
- Boston Private Financial Holdings, Inc.
- Brookline Bancorp, Inc.
- First Busey Corporation
- First Commonwealth Financial Corporation
- First Foundation Inc.
- Lakeland Bancorp, Inc.
- Park National Corporation
- Seacoast Banking Corporation of Florida
- Univest Financial Corporation
- Westamerica Bancorporation
Large Banks ($10B – $20B in assets)
- Ameris Bancorp
- Atlantic Union Bankshares Corporation
- BancorpSouth Bank
- Bank of Hawaii Corporation
- Berkshire Hills Bancorp, Inc.
- Cadence Bancorporation
- Community Bank System, Inc.
- First Merchants Corporation
- First Midwest Bancorp, Inc.
- Glacier Bancorp, Inc.
- Great Western Bancorp, Inc.
- Old National Bancorp
- Trustmark Corporation
- United Bankshares, Inc.
Compensation Advisory Partners (CAP) assessed human capital actions taken by companies in the Financials sector in response to the COVID-19 pandemic. Key findings include:
- The Financials sector was moderately impacted by the COVID-19 pandemic, with 27% of companies in the S&P Composite 1500 Index taking human capital actions.
- Banks, which often have retail operations, reported the most actions (35%) – many of which were positive for employees, such as expanded time off and healthcare benefits, and one-time bonuses and additional pay for on-site workers
- The five most prevalent human capital actions by Financial Sector are expanded benefits programs, one-time bonuses for non-executives, additional payments for on-site employees (non-executives), reducing CEO base salary, and guaranteed pay continuity for non-executives
- Executive salaries were reduced, particularly in Diversified Financials and Insurance:
- Median salary reductions were 30 percent for chief executive officers (CEOs), while median salary reductions for other executives were 20 percent.
- For boards of directors, pay was cut by a median of 28 percent.
The PDF of the report provides additional data for the Financials sector.
The human capital actions that CAP is tracking include pay cuts; changes to annual and long-term incentives; furloughs; workforce reductions; suspended 401K matches; enhanced health and welfare benefits; additional pay for frontline workers; pay continuity; and workforce expansions. CAP will continue to monitor corporate public announcements of COVID-19 actions.
Compensation Advisory Partners (CAP) examined executive compensation levels and design practices at 12 publicly traded, U.S. investment banks. The 12 companies in the study are independent, advisory-focused investment banks, and they have a revenue range of $100 million to $7.7 billion. As an additional reference point for comparison purposes, CAP also reviewed executive compensation levels and practices at three large, diversified financial institutions (“Wall Street Banks”) with significant investment banking operations. Revenue at the Wall Street Banks ranged from $35.5 billion to $110.0 billion.1 CAP also assessed the impact of the COVID-19 pandemic on the investment banks' performance and pay programs.
Key Takeaways:
- The COVID-19 pandemic has stifled mergers and acquisitions activity – both in the United States and globally – since early March. The outlook for the rest of 2020 remains uncertain.
- The investment banking industry’s approach to incentive compensation is significantly different than standard practice in most other industries. It is important to understand the investment banking pay model to effectively evaluate market data.
- Median pay levels for chief executive officers (CEOs) decreased 6.5 percent, in line with the modest decrease in operating margin among these companies from 2018 to 2019. Pay levels for chief financial officers (CFOs) increased 7.8 percent because of incumbent changes, while pay levels for other named executive officers (NEOs) decreased 5.6 percent.
- The median compensation and benefits ratio increased by 4 percentage points, from 59.9% to 63.9%
The Impact of COVID-19 on the Investment Banking Industry
The pandemic jolted the global economy and derailed mergers and acquisitions activity. Barron’s recently reported that second-quarter mergers-and-acquisitions deal value was down 83 percent in the United States and 52 percent globally. Of note, results are not down in all business areas at investment banks. For example, 2020 has been a busy year for restructuring groups and in trading operations.
Compensation and benefits are the largest expense category for investment banks, and the biggest component of compensation is annual year-end bonuses. This variable cost structure provides investment banks with more flexibility than companies in other industries to better understand (i.e., wait and see) the full-year impact of the pandemic before taking broad-based employment actions, such as potential reductions in headcount.
In response to COVID-19, two investment banks announced pay cuts at the executive level, although one action was disclosed as being volunteered by the CEO. To date, the remaining employment actions in response to COVID-19 were positive, such as increased paid time off and new virtual health benefits. Two investment banks announced plans to honor analyst and associate employment offers, either now or in 2021. The bank that proposed 2021 start dates offered a deferral bonus for new hires.
|
Publicly Disclosed COVID-19 Actions |
Specific Companies |
|
Executive Compensation Reduction |
Greenhill, Piper Sandler |
|
Enhanced Employee Benefits |
Goldman, JPMorgan Chase, Stifel |
|
Honor Employment Offers |
Evercore, Stifel |
|
Employee Salary Continuation |
Raymond James |
|
Reduced Dividends and/or Suspended Share Buybacks |
Goldman, Moelis, Piper Sandler, Raymond James, |
Results during the remainder of 2020 will be significantly impacted by the course of the pandemic, the execution of backlogged deals and the appetite for new deals, whether opportunistic or strategic. Currently, consensus analyst estimates project more than a 25 percent decline in profits and a one percent decrease in revenue, at median, among these investment banks from 2019 to 2020. Should these projections materialize, they will trigger a corresponding decrease in year-end incentive pools. Targeted headcount reductions would also be likely, with variation by firm.
A Unique Industry
From economic, performance and compensation perspectives, independent investment banks stand apart from general industry and other financial services firms. The unique aspects of the industry are important to understand when looking at executive compensation levels and practices.
Human Capital Focus. The investment banking industry has a strong human capital focus: The industry’s most valuable assets are its people. Most individuals in the industry are highly educated, trained and compensated. A firm’s success depends on its ability to attract, reward, and retain highly skilled bankers with strong business networks and deal-execution skills. Given the industry’s human capital focus, the largest expense category is compensation and benefits.
Year-to-Year Results. Like most professional services firms, investment banks focus heavily on year-to-year financial metrics, such as revenue growth, operating margin, and profitability. The industry tends to be cyclical and sensitive to overall economic conditions. In addition, a firm’s results for the year can be skewed by factors such as a large deal closing in January instead of prior to December 31.
A key metric in the evaluation of most senior, non-corporate investment-banking professionals is annual revenue generation. Long-range planning is largely limited to senior corporate executives, and firm investments often generate returns more quickly than in capital-intensive industries.
The Investment Banking Pay Model. Investment banks approach executive compensation in a manner that is distinct from general industry norms. At investment banks, each year a total incentive is determined based on an often-discretionary review of prior-year performance. The total incentive is then delivered to executives as a mix of annual cash bonuses and deferred, long-term incentive compensation. Of the investment banks in CAP’s study, all but one use this investment banking pay model for top executives, as do all three Wall Street Banks.
The investment banking pay model contrasts with the broadly used, traditional compensation model where annual and long-term incentive components are separate and determined independently. In most other industries, the annual cash incentive is often determined in a structured, formulaic manner, and the annual long-term incentive grant value is largely market-based, with the target grant value being typically independent of prior-year performance.
While executive incentive awards in the investment banking industry tend to be more discretionary in nature when juxtaposed with the more formulaic approach used in general industry, the investment banks do base their year-to-year incentive decisions on specific criteria, such as revenue and profitability. In fact, several of the investment banks in the study disclosed information about their incentive decision-making processes, which can be thought of as following a “structured discretion” approach.
2019 Industry Performance
The investment banks in CAP’s study reported mixed operating results for 2019. Revenue increased 2.5 percent, and pre-tax operating income increased 5.2 percent. Notably, operating margins decreased 3.0 percent, while return on equity (ROE) was flat. Total shareholder return (TSR) – which quantifies stock price appreciation and dividends – was up 17.5 percent during 2019, buoyed by a strong stock market.
Investment Bank Industry Peers: Financial Summary
|
Metric |
Median Percent Change |
|
|
Year Ended December 31, 2019 |
Year Ended December 31, 2018 |
|
|
Revenue |
+2.5% |
+14.8% |
|
Pre-tax Operating Income |
+5.2% |
+33.3% |
|
Operating Margin |
-3.0% |
+2.5% |
|
Return on Equity (ROE) |
-0.7% |
+3.5% |
|
1-Year TSR |
17.5% |
-19.8% |
|
3-Year TSR (compound annual growth rate, or CAGR) |
+5.7% |
+5.7% |
Source: S&P Capital IQ financial database
In addition to financial and market-based performance measures, investment banks also track and report a human-capital metric, the compensation and benefits ratio. This ratio expresses compensation and benefits expenses as a percentage of revenue. The median compensation and benefits ratio among CAP’s investment banking sample increased by 4 percentage points for full year 2019 versus full year 2018. The increased compensation and benefits ratio reflects the industry’s modest revenue growth being outpaced by human capital costs.

Source: S&P Capital IQ financial database
As expected, the compensation and benefits ratio is higher for the investment banks in the study relative to the Wall Street Banks. The Wall Street Banks have a more diversified workforce in terms of employee roles and pay levels.
Named Executive Officer (NEO) Compensation
CAP analyzed 2018 and 2019 pay levels for the five NEOs disclosed in proxy statements by each of the investment banks. We assessed compensation by position for the CEO and CFO, and as a group for the remaining NEOs. From 2018 to 2019, base salaries were flat across all NEO roles. Base salaries are often not increased on an annual basis for senior leadership roles at investment banks.
Incentive pay, which includes annual bonuses and long-term incentives, decreased 7.1 percent from 2018 to 2019, at median, for CEOs and 6.3 percent for other NEOs. Similarly, total direct compensation decreased 6.5 percent, at median, for CEOs and 5.6 percent for other NEOs. These pay decreases are significant as they include a decrease in the grant-date value of long-term incentives, the largest component of compensation. The investment banking pay model resulted in incentive awards aligned with financial results.
In contrast, incentive pay increased 8.4 percent from 2018 to 2019, at median, for the CFO role, and total direct compensation increased 7.8 percent. The increase in CFO incentive pay for 2019 can be primarily attributed to incumbent changes and recognition of contribution to successful completion of a merger/acquisition.
2018 to 2019 Changes in Executive Compensation
|
Compensation Component |
Median Percent Change |
||
|
CEO |
CFO |
Other NEOs |
|
|
Base Salary |
No Change |
No Change |
No Change |
|
Incentive Pay |
-7.1% |
+8.4% |
-6.3% |
|
Total Direct Compensation |
-6.5% |
+7.8% |
-5.6% |
Pay Mix and Incentive Compensation
As shown in the pay-mix charts that follow, the investment banking industry places significant emphasis on performance-based, variable incentive compensation. Annual CEO compensation was 89 percent performance-based in 2019, on average. CFO compensation was 79 percent performance-based, and other NEO compensation was 85 percent performance-based. Annual incentives represented 42 percent of total compensation for investment banking CFOs and other NEOs. In contrast, CEO compensation focuses more heavily on long-term incentives, with the grant-date value of long-term incentive awards making up 58 percent of total compensation.

Investment banks deliver incentive compensation using a mix of cash and deferred equity vehicles, such as restricted stock, restricted stock units (RSUs) and performance share units (PSUs). The long-term incentive component adds a retention hook by deferring payment of a portion of annual incentive pay, most typically for three years. It also provides a link to the company’s long-term shareholder value creation. A significant portion of compensation for investment banking NEOs is deferred and delivered through restricted stock, RSUs and PSUs. Approximately two-thirds of incentive pay is deferred for CEOs, while about half of incentive pay is deferred for CFOs and other NEOs.
The investment banks in this study have been gradually shifting their mix of long-term incentive vehicles to include PSUs. Most CEOs in the study group now receive annual PSU awards, with prospective, generally three-year performance requirements. Among the CEOs who receive PSUs, close to half of long-term incentive compensation is provided through these awards. The most common performance metrics associated with PSUs in the investment banking industry are TSR and return measures, such as return on equity (ROE), followed by revenue growth and operating margin. Performance-based long-term incentive vehicles such as PSUs, with prospective multi-year goals, are favored by Institutional Shareholder Services (ISS) and Glass Lewis, the two most prominent proxy advisory firms.
Specific to 2020, while the full economic impact of the COVID-19 pandemic will not be known for quite some time, compensation committees should evaluate their “in flight” PSU awards. As of July 2020, the stock prices for the investment banks studied are now near, equal to, or above where they were before the COVID-19 pandemic. In contrast to the shareholder experience—recognizing that two of the investment banks temporarily reduced dividend payments—in-flight PSU awards that have absolute performance goals are now projected to pay out below target or not at all. Compensation committees should consider whether this reflects the intended pay-and-performance alignment.
Compensation should be used as a management tool to support business strategy. Accordingly, PSU performance goals are often based on financial metrics, such as ROE, revenue growth, or operating margin, that are aligned with the companies’ business plans. Also, many companies’ compensation plans try to correct for events that are outside management’s control. The pandemic disrupted many companies’ annual and long-term business plans. Compensation committees may want to evaluate their in-flight PSU awards and consider improvements that better align pay and performance. Adjustments to consider include relative performance measures instead of absolute measures, the implementation of pre-defined or discretionary adjustments to the calculation of metrics so that management is not penalized for events outside its control, among other alternatives.
Equity Overhang
CAP also analyzed equity overhang, which is a measure of potential shareholder dilution. Median equity overhang for the investment banks was 31 percent, up from 28 percent last year. Notably, the median equity overhang among the investment banks studied exceeds ISS “excessive dilution” thresholds. The ISS thresholds do not consider industry-specific factors, such as investment banking’s human-capital focus and the partnership model from which these public companies emerged. In contrast, the average equity overhang for the Wall Street banks was 11 percent.

ISS uses its Equity Plan Scorecard (EPSC) model to determine its shareholder vote recommendation for new share requests for equity and incentive compensation plans. The EPSC includes certain “overriding” factors, one of which is “excessive” dilution. This factor, which applies to S&P 500 and Russell 3000 EPSC models only, will be triggered by ISS when the company’s equity compensation program is estimated to dilute shareholders’ holdings by more than 20% (S&P 500 model) or 25% (Russell 3000 model). This overriding factor may warrant an ISS “against” vote recommendation, despite an acceptable overall EPSC score. All but one of the investment banks in the study are in the Russell 3000, while only two of the companies are in the S&P 500. All three Wall Street banks are in both indices.
Two-thirds of the investment banks studied have equity overhang levels that would exceed the ISS “overriding” factor threshold. This indicates that, for a majority of publicly traded investment banks, ISS would likely recommend that shareholders vote against a new share request, no matter what the plan features are or what the benefits of maintaining an ongoing equity compensation plan are to various stakeholders, including the company, employees and shareholders. The ISS “overriding” factor threshold does not make sense for the investment banking industry and exemplifies why industry-specific understanding is important when designing and evaluating compensation programs.
When publicly traded investment banks seek shareholder approval for new share requests, shareholder outreach is advisable, and the resolution should include information that makes a strong case for the share request. Also, setting internal expectations for the likely (low, but passing) level of shareholder support is important. For example, among non-S&P 500, Russell 3000 investment banks, median shareholder support for such new share requests during the past three years was 68 percent. ISS recommended that shareholders vote against all but one of the proposals, but each time the proposals passed with majority shareholder support (albeit, with lower support than broader market norms).
Equity Run Rate
CAP also analyzed the equity run rates for the investment banks. The equity run rate measures shareholder dilution from equity grants made in a particular fiscal year. In recent years, the median annual gross run rate for the investment banks has ranged from 3.2 percent to 4.5 percent. The three-year average gross burn rate is 4.3 percent at median.
Given its human-capital focus and approach to incentive compensation, this industry often focuses more on the net run rate, which takes into account forfeitures and repurchases, than on the gross run rate used in most industries. For example, the net run rate is frequently the only version of run rate discussed in new share request proposals in this industry. Among the investment banks studied, the median net run rate has ranged from approximately -3.0 percent to -0.2 percent in recent years, with a three-year average net run rate of -1.0 percent, at median. In this industry, buybacks are often viewed as a tool used to limit or net-out annual shareholder dilution from compensation programs.
Peer Groups for Compensation Benchmarking
CAP assessed the size and composition of the peer groups used by investment banks for compensation benchmarking purposes. Publicly traded companies generally disclose the peer groups they use for compensation benchmarking purposes in their annual proxy statements. Relative to most other industries, the peer groups used by the investment banks are smaller and more industry focused.
Among the investment banks studied, the median peer group size is 12 companies, while the 75th percentile is 13 companies. The peer group size for the Wall Street banks is even smaller, with an average of 6 companies. In contrast, a recent Equilar and CAP study of 500 companies across different industries found the median peer group size to be 17 companies.
The investment banking peer groups are smaller than those used in most other industries because the executive compensation programs in this industry are unique (see “Investment Banking Pay Model” above), and companies choose to compare themselves mostly with publicly traded direct competitors – of which a limited number exist. This is very different than how peer groups are approached in many other industries where companies are screened more broadly for size and other operating metrics. In the 500-company general industry sample noted above, only 8 percent of companies maintained a peer group where at least 75 percent of constituent companies were from the same industry classification, and only 30 percent of companies maintained a peer group where 100 percent of constituent companies were from the same industry sector classification.
CEO Pay Ratio
The CEO pay ratio, which most public companies are required to report annually in the proxy statement, is the ratio of CEO compensation to that of the median employee. For the investment banks, CEO compensation in 2019 was 40 times the compensation of the median employee at their companies. This is significantly less than the median CEO pay ratio among Russell 3000 companies, which was 80 times the compensation of the median employee. The lower CEO pay ratio at investment banks is driven by much higher median employee pay relative to general industry.
CEO Pay Ratio – Investment Banks and Russell 3000
|
Investment Banks |
Russell 3000 |
|
|
2019 Median CEO Pay Ratio |
40x |
80x |
|
2019 Median CEO Pay |
$7,478,814 |
$5,627,449 |
|
2019 Median CEO Pay Change |
-8.3% |
n/a |
|
2019 Median Employee Pay |
$185,719 |
$66,237 |
|
2019 Median Employee Pay Change |
6.2% |
n/a |
Note: 2019 median CEO pay is calculated using the Securities and Exchange Commission’s proxy disclosure rules. This differs from the way investment banks view annual pay and pay changes.
The average CEO pay ratio for the three Wall Street Banks was 282 times in 2019, much higher than both the investment bank and the Russell 3000 pay ratios. Among the Wall Street Banks, CEO pay averaged $30 million, and the average median employee pay was nearly $105,000. CEO pay at the Wall Street Banks reflects the size and complexity of the organizations, and the lower median employee pay reflects the greater variety of business lines and employee roles.
Conclusion and Looking Ahead
During 2019, the investment banks in CAP’s study rewarded executives commensurately with operating performance outcomes. Looking ahead, we expect to see an increasing prevalence of PSU awards – with prospective, pre-defined, multi-year performance goals – for corporate leaders at public investment banks. We have seen the industry heighten its focus on gender pay equity and representation by women in the management ranks; this trend will continue.
The industry outlook for the rest of 2020 remains uncertain and depends on the course of the pandemic, the execution of backlogged deals and the appetite for new deals, whether opportunistic or strategic. Unless business results significantly improve during the balance of the year, 2020 incentive funding will be down, likely double digits for advisory and, to a lesser extent, for underwriting.
Even during economic downturns, top talent will be sought. Companies can choose to compete or fall behind. Given the industry emphasis on year-end incentives, further cost-cutting and headcount reductions will be increasingly likely — especially if a quick recovery is not the consensus expectation — with variation by firm and across different business lines and areas of industry focus and expertise.
Lastly, designing an effective executive compensation program in investment banking requires real-time industry insights, deviation from the market practices that are common in other industries, and a compensation-focused shareholder communication strategy that specifically addresses industry-specific distinctions.
For questions or more information, please contact:
Bonnie Schindler Principal [email protected] 847-636-8919
Matt Vnuk Partner [email protected] 212-921-9364
Zaina Jabri, Stefanie Kushner and Brooke Warhurst provided research assistance for this report.
Appendices
Key Terms Defined
|
Compensation and Benefits Ratio |
Compensation and benefits expense as a percent of revenue. |
|
Equity Dilution or Overhang |
Represents maximum potential dilution from equity-based compensation (i.e., the sum of all outstanding or available shares/units under equity plans divided by the sum of the company’s common shares outstanding and all outstanding or available shares/units under equity plans). |
|
Equity Run Rate (also called “Burn Rate”) |
Represents equity grants (including full-value shares and stock options) made during the year divided by the company’s average common shares outstanding. |
|
Investment Bank Compensation Model |
Reflects an often highly discretionary compensation structure where all / most incentive compensation is based on prior-year performance and then split between immediate cash and equity awards with prospective vesting requirements. |
|
ISS Excessive Dilution Threshold |
ISS policy to vote against new share requests when the company’s equity compensation program is estimated to dilute shareholders’ holdings by more than 20 percent (S&P 500 company) or 25 percent (non-S&P 500, Russell 3000 company). |
|
Net Run Rate (also called “Net Burn Rate”) |
Represents equity grants (including full-value shares/units and stock options) made during the year minus forfeitures and repurchases divided by average common shares outstanding. |
|
Operating Margin |
Measures how much profit a company makes on each dollar of revenue. The calculation is operating income, or earnings before interest and taxes, as a percent of revenue. |
|
Total Direct Compensation (TDC) |
The sum of base salary, annual incentive (cash bonus), and long-term incentives, such as restricted stock, stock options, and cash- or share-based performance plans. |
|
Total Shareholder Return (TSR) |
TSR measures the change in stock price over time, with dividends assumed to be reinvested at the time they are paid. |
|
Traditional Compensation Model |
Reflects a compensation structure where annual and long-term incentive components are separate and determined independently. The annual cash incentive is determined in a structured, formulaic manner, and the annual long-term incentive grant value is largely market-based, with the target grant value being typically independent of prior-year performance. |
1 When summary statistics are reported in this study, medians are used for the 12 public investment banks, while averages are used for the three Wall Street Banks.
Investment Banks
- Cowen Inc.
- Evercore Inc.
- Greenhill & Co., Inc.
- Houlihan Lokey, Inc.
- Jefferies Financial Group Inc.
- JMP Group LLC
- Lazard Ltd
- Moelis & Company
- Piper Sandler Companies
- PJT Partners Inc.
- Raymond James Financial, Inc.
- Stifel Financial Corp.
Selected Wall Street Banks
- The Goldman Sachs Group, Inc.
- JPMorgan Chase & Co.
- Morgan Stanley
Compensation Advisory Partners (CAP) conducted a study of executive compensation levels and design practices in the banking industry. The study includes 18 U.S. banks with greater than $50 billion in assets across three different groups: Money Center banks (n=4), Custody banks (n=3), and Super Regional banks (n=11). This report summarizes the findings of CAP’s study and identifies other hot topics in executive compensation affecting the banking industry.
Key Takeaways
- Pay and performance: 2019 financial performance results were generally flat relative to 2018. Despite flat operating results, one- and three-year total shareholder return (TSR) were strong for the period that ended December 31, 2019. Chief executive officer (CEO) compensation increased modestly by two percent at median, generally aligning with flat financial performance.
- Compensation program design: In recent years, executive incentive plan design among banks in this group has been stable. Earnings per share (EPS) is the most common short-term incentive metric and return on tangible common equity (ROTCE) is the most common long-term incentive metric. Stock options continue to be less common among banks than among companies in other industries with only 6 of 18 granting them for 2019.
- Looking ahead: For compensation and human resources committees of the board, a key focus for the second half of 2020 and beyond will be evaluating the impact of the COVID-19 pandemic on executive incentive plans. Many banks in CAP’s study use discretionary annual incentive plans and relative incentive metrics in long-term performance plans, allowing for greater flexibility and requiring fewer adjustments to manage the unplanned impact of the pandemic. Additionally, CAP expects companies and committees to continue to focus on diversity and inclusion and gender pay equity.
2019 Pay and Performance Outcomes
2019 financial results were generally flat relative to 2018 for the banks in CAP’s study. EPS growth was positive, but significantly lower than 2018. Revenue, operating income, and net income were flat after considerable increases in 2018. Banks saw significant growth in 2018 due in part to the 2017 Tax Cuts and Jobs Act. Banks faced a more challenging economic backdrop in 2019 with low interest rates and pressure on net interest margins. 2019 EPS results for the banks in CAP’s study tended to be below analyst expectations set at the beginning of the year primarily due to the low interest rate environment. EPS results for the Money Center banks were less impacted because these businesses are more diverse. Despite flat operating results, one- and three-year TSR were strong for the period that ended December 31, 2019. The chart below summarizes median performance results for the banks in CAP’s study:
|
Metric |
Median Percent Change |
|
|
Year Ended December 31, 2018 |
Year Ended December 31, 2019 |
|
|
EPS |
+34.8% |
+6.1% |
|
Net Income |
+29.8% |
-1.5% |
|
Pre-tax Operating Income |
+ 12.8% |
-0.6% |
|
Revenue |
+5.3% |
+1.2% |
|
1-Year TSR |
-17.6% |
+33.5% |
|
3-Year TSR (Cumulative) |
+24.1% |
+25.5% |
Source: S&P Capital IQ Financial Database.
In 2019, total direct compensation, including base salary, annual cash bonus, and awarded long-term incentives, among CEOs increased two percent versus 2018 at median. This is a smaller increase than in 2018 when total direct compensation for CEOs increased seven percent at median. 2019 annual cash bonuses were mixed among this group and resulted in no change at median, indicating that 2019 cash bonuses were aligned with relatively flat operating performance. The chart below summarizes median changes in CEO pay for the group:
|
Element |
Median Percent Change for CEOs |
|
|
Year Ended December 31, 2018 |
Year Ended December 31, 2019 |
|
|
Base Salary |
No Change |
No Change |
|
Annual Cash Bonus |
+7.0% |
No Change |
|
Awarded Long-term Incentive |
+5.6% |
+4.2% |
|
Awarded Total Incentive |
+8.0% |
+2.7% |
|
Total Direct Compensation |
+6.8% |
+2.4% |
Note: Excludes companies where there was a change in CEO.
Compensation and benefits expense increased approximately three to four percent at median on an absolute basis in 2018 and 2019 but stayed relatively flat as a percentage of revenue. Compensation and benefits expense increased slightly as a percentage of net income in 2019 after declining significantly from 2017 to 2018 due to the change in tax rate under the 2017 Tax Cuts and Jobs Act.

Executive Incentive Compensation Program Design
Incentive Compensation Model
The banking industry is different from other industries in that some banks determine a total incentive award based on annual performance and then allocate the total incentive between annual cash bonus and long-term incentive awards (e.g., the total incentive award for the year is delivered 40 percent through an annual cash bonus and 60 percent through long-term incentives). Among the banks in CAP’s study, 39 percent use this approach, including most Money Center and custody banks and several Super Regional banks. The remaining banks make separate decisions for the annual cash bonus and long-term incentive awards, which is consistent with general industry practice.
Short-term Incentive Plan
Half of the companies in CAP’s study have primarily discretionary short-term incentive plans. This practice is more prevalent in the banking industry than in other industries.
The other half of companies maintain more formulaic short-term incentive plans, often referred to as goal attainment plans, that pay out, at least in part, based on financial results relative to pre-established “threshold,” “target,” and “maximum” goals. These plans most often provide for a payout of 200 percent of target for “maximum” performance or better, though several companies provide maximum opportunities of 150 percent of target, and one company provides a maximum opportunity of greater than 200 percent of target.
EPS is the most common financial metric across these short-term plans. Companies also use the Efficiency Ratio, return on assets (ROA), and return on equity (ROE), but they are less common in short-term plans. Most companies measure annual performance against absolute performance goals; however, several companies include a relative performance component.

Note: Percentages do not add to 100 percent due to some companies using multiple metrics.
Long-Term Incentive Plan
Long-term incentive programs among companies in CAP’s study are most often composed of time-based restricted stock or units, and long-term performance plans (e.g., performance share units). Only 33 percent of banks in the study use stock options, making them less common among this group than in the broader market. Companies tend to weight long-term performance plans as at least 50 percent of the target total long-term incentive award. All of the banks in the study that use stock options are super regional banks. None of the money center or custody banks use stock options. Of the companies in the study, 11 percent use long-term performance plans as their only long-term incentive vehicle. The chart below outlines the average long-term incentive mix across companies in CAP’s study:

Note: Two companies use long-term performance plans as their only long-term incentive vehicle and one company uses a long-term performance plan and stock options.
Of the banks in CAP’s study, 83 percent use return on equity (ROE) or a variant of that measure as a metric in their long-term performance plans. Variants of ROE include return on tangible common equity (ROTCE) and return on common equity (ROCE). ROTCE is the most common of these variants. EPS and relative TSR are also common long-term performance plan metrics.
78 percent of companies use at least one relative metric in their long-term performance plans. Specifically, all Super Regional banks use relative metrics in their long-term performance plans. In other industries, relative metrics are typically limited to TSR; however, the banks in CAP’s study also use relative financial measures, including relative ROE variants, EPS growth, and ROA. This is likely due to the significant degree of comparability between the Super Regional banks in CAP’s study.
Note: Percentages do not add to 100 percent due to some companies using multiple metrics.
Among banks, long-term performance plans most often have maximum payout opportunities of 150 percent of target. In the broader market, most long-term performance plans have maximum payout opportunities of 200 percent of target. Maximum opportunities tend to be lower at banks due, in part, to regulatory guidance to limit upside leverage in incentive plans to avoid encouraging imprudent risk-taking.
Looking Ahead to the Rest of 2020 and Beyond—Hot Topics in Executive Compensation
COVID-19 Pandemic: Impact and Response
The COVID-19 pandemic has impacted businesses globally. Companies in some industries have been severely impacted and have had to resort to furloughs and wage reductions to cut costs and preserve cash. Most U.S. banks have avoided such actions. Instead, U.S. banks have taken positive employee actions such as, providing additional compensation for in-person workers and additional paid sick leave or other health benefits.
Although banks have avoided cutting employee-related costs to date, bank financial results are expected to be adversely impacted by COVID-19 in 2020. Though some banks may have benefited from fee income related to Paycheck Protection Program loans, we expect the negative impact of a challenging economic environment and zero-interest-rate environment to outweigh any benefits. This could impact payouts on in-progress annual and long-term incentive plan cycles. CAP conducted a survey in the first half of 2020 to get a sense of whether companies intend to take action to address the impact of COVID-19 on incentive plans. Several of the banks in CAP’s study participated in the survey and nearly all responded that it was too early to determine if or what action would be taken. CAP expects that companies will have better insight into the extent of the impact of COVID-19 on incentive plan outcomes and whether action is warranted when second quarter results are available.
Companies with formulaic annual incentive plans and absolute incentive plan metrics will likely have to make the most significant adjustments to address the impact of COVID-19, which was unplanned and not in management’s control. Discretionary short-term incentive plans and relative metrics will likely not require action. Given that 50% of the banks in CAP’s study use discretionary annual incentive plans and 78% use at least one relative metric in their long-term performance plan, this group may not have to make as many adjustments as companies in other industries.
Diversity and Inclusion and Gender Pay Equity
In 2019 and the first half of 2020, board human resources committees continued to focus on diversity and inclusion, and gender pay equity at companies across industries. Financial services firms are often the focus of discussions on these topics in the media, among regulators, and among institutional investors.
In 2020, Arjuna Capital, an institutional investor that engages companies on gender pay equity, published the third edition of its gender pay equity scorecard, which grades companies on disclosure of gender pay gaps and commitments to address pay inequity. Several of the banks in CAP’s study are included in the scorecard. Notably, Citigroup was one of only three companies to receive the highest grade of “A.” Citigroup voluntarily published its global gender pay gap and U.S. minority pay gap in both 2019 and 2020. Additionally, 22 percent of companies in CAP’s analysis included shareholder proposals in their 2020 proxy statements requesting that the banks report the median gender pay gap. These proposals failed to receive majority support from shareholders.
In June 2019, Congresswomen Maxine Waters, Chairwoman of the House Financial Services Committee, and Joyce Beatty, Chairwoman of the Diversity and Inclusion Subcommittee, sent a letter to 44 bank holding companies with assets of greater than $50 billion, requesting information about each institution’s diversity and inclusion data and policies. In February 2020, the House Financial Services Committee published their findings in a report titled, “Diversity and Inclusion: Holding America’s Large Banks Accountable.” The report found that the demographics of bank employees reflect the U.S. population; however, senior management teams and boards of directors are mostly white and male. Additionally, the report stated that not all institutions responded fully to each of the questions in the letter.
Though these disclosures are not mandatory, CAP expects that investors and regulators will continue to call for transparency around diversity and inclusion policies and gender pay equity in the banking industry and broader market. As these calls for transparency put pressure on banks to “get this right,” Citigroup and Wells Fargo have publicly stated diversity goals and are considering progress on these goals as part of the compensation decision process for top executives.
Conclusion
Compensation programs among the banks in CAP’s study continue to effectively tie pay outcomes to performance. In recent years, incentive plan designs among these banks have generally been stable.
However, the second half of 2020 holds a great deal of uncertainty. The full extent of the COVID-19 pandemic’s duration and economic impact is still unknown, the low interest rate environment may inhibit growth, and the 2020 election may have a significant impact on the regulatory environment. CAP expects this uncertainty will likely result in decreases in 2020 CEO compensation and could result in changes to executive incentive plan designs in the second half of 2020 or early 2021. We also expect banks in our study to continue their efforts to make progress on the diversity and inclusion front.
For questions or more information, please contact:
Eric Hosken Partner
[email protected] 212-921-9363
Michael Bonner Senior Associate
[email protected] 646-486-9744
Chris Callegari Senior Analyst
[email protected] 646-486-9747
Stefanie Kushner provided research assistance for this report.
Banks in CAP’s Study (n=18)
Money Center Banks
- Bank of America Corporation
- Citigroup, Inc.
- JPMorgan Chase & Co.
- Wells Fargo & Company
Custody Banks
- The Bank of New York Mellon Corporation
- Northern Trust Corporation
- State Street Corporation
Super Regional Banks
- Citizens Financial Group, Inc.
- Comerica, Inc.
- Fifth Third Bancorp
- Huntington Bancshares, Inc.
- KeyCorp
- M&T Bank Corporation
- The PNC Financial Services Group, Inc.
- Regions Financial Corporation
- Truist Financial Corporation
- U.S. Bancorp
- Zions Bancorporation
Compensation Advisory Partners (CAP) examined 2018 executive pay levels and pay practices among 43 companies in the regional bank industry. The companies were stratified into three groups based on asset size: $1B – $5B in assets (“small banks”; n=14), $5B – $10B in assets (“medium banks”; n=15) and $10B – $20B in assets (“large banks”; n=14). This report discusses both the similarities and differences in compensation levels and practices between the three groups.
Highlights
- As banks increase in size, a higher percentage of total pay shifts from fixed compensation to at-risk or variable compensation
- 2018 was a strong financial performance year with annual incentive payouts to Chief Executive Officers (CEOs) above target for all groups reviewed
- The ratio of CEO pay relative to other Named Executive Officers (NEOs) increases as banks increase in asset size
- For all banks, the most prevalent metrics generally include Asset Quality, Efficiency Ratio, Return on Assets (ROA), Return on Equity (ROE), Earnings Per Share (EPS), and Net Income in their annual incentive plans with smaller banks also factoring in Loan and Deposit levels more frequently
- For long-term performance plans, relative Total Shareholder Return (TSR), ROA, ROE and EPS are frequently used together. Larger banks also incorporate other metrics more often on both a relative and absolute basis
- A well-designed compensation program that is aligned to the bank’s business strategy is necessary to garner shareholder support and to attract and retain talent
CEO Target Pay Levels and Mix
Unsurprisingly, CEO total target compensation is correlated with bank size. This is seen across industries, as larger organizations are generally more complex and, therefore, leading these companies usually comes with greater management challenges and risks. For banks, larger asset sizes generally mean the institution has more customers and branches, and/or the bank offers more products and services. Higher pay levels also correlate with a larger portion of pay that is at-risk or variable, and comes with a higher level of scrutiny from investors and regulators. Executives are often paid more fixed compensation, on average, at smaller banking institutions and more variable compensation at larger banks.

This is evident when looking at the percentage of target compensation that CEOs received during the last fiscal year, where 53 percent of compensation was fixed at the small banks compared to 40 percent at the medium banks and only one-third at the large banks. Larger banks also grant more compensation in the form of equity, which is tied to either multi-year vesting and/or performance criteria. These equity grants make up approximately one-third of medium bank target pay for CEOs and roughly 40 percent at the large banks in the sample. By comparison, smaller banks only grant 25 percent of their compensation, on average, in these long-term equity vehicles. Additionally, we found that not all small banks grant equity on an annual basis.
2018 Performance and Pay Outcomes
Performance Results
Financial performance appeared strong in 2018 when compared with 2017, which can be attributed, in part, to the reduction in the corporate tax rate under the Tax Cuts and Jobs Act in 2017. This reduced tax rate magnified year-over-year changes in after-tax metrics such as EPS and Net Income, with banks of all sizes performing very well. Pre-tax Operating Income and ROE results were also strong for all groups. TSR, on a one-year basis, was generally down for the year ending December 31, 2018; however, this was consistent with the downward trend seen in the overall market and super regional and Wall Street banks at the end of 2018.
| Metric | Median Percent Change Year Ended December 31, 2018 | ||
| Asset Size | |||
| $1B – $5B | $5B – $10B | $10B – $20B | |
| EPS | +37.4% | +29.5% | +58.7% |
| Net Income | +52.0% | +43.1% | +71.3% |
| Pre-tax Operating Income | +14.2% | +10.3% | +14.1% |
| Return on Equity | +171 bps | +134 bps | +251 bps |
| 1-Year TSR | -10.1% | -18.8% | -16.4% |
Bps – Basis points
Source: S&P Capital IQ Financial Database
CEO Annual Incentive Payouts
Overall, the large banks had the best performance of the three groups in 2018 based on the financials reviewed, followed by the small banks. This performance was ultimately rewarded by annual incentive plans, as seen in CEO annual incentive payouts. Large banks had the highest annual incentive payouts as a percentage of target, 127 percent, at median, and only one bank in the large bank group paid an annual incentive below target.
| Summary Statistics | CEO Payout as Percent of Target | ||
| Asset Size | |||
| $1B – $5B | $5B – $10B | $10B – $20B | |
| 75th percentile | 142% | 124% | 147% |
| Median | 117% | 100% | 127% |
| 25th percentile | 94% | 76% | 114% |
Total Pay Changes
CEO actual total compensation (base salary, actual annual incentive and long-term incentives) also increased in 2018. The largest increase was at the large banks (9%) which was driven by a combination of higher annual incentive payouts and larger long-term equity grants. Long-term incentive (LTI) levels were flat year-over-year, at median, at both the small and medium sized banks. The actual total direct compensation increases seen at these groups (7% and 5%, respectively) were driven primarily by higher annual incentive payouts in 2018 compared to 2017. Base salaries increased modestly (3% to 3.5%), at median, for each group.

Other Executive Pay / Roles
In addition to CEO pay, companies are required to disclose compensation for the Chief Financial Officer (CFO) and the next three highest paid other executives or NEOs in their Summary Compensation Tables (at smaller companies, sometimes only one other executive besides CEO and CFO is disclosed). The positions and roles that these other NEOs have vary somewhat based on the size of the bank. NEO positions that are commonly seen across these three groups include President, Chief Operating Officer, Chief Credit Officer, Chief Lending Officer, various Bank Leaders, and Chief Risk Officer. The small and medium sized banks more frequently have Chief Credit Officers and Chief Lending Officers in their NEO group whereas the larger banks in our sample more frequently have General Counsels, Chief Administrative and Chief Information Officer positions. Differences in NEO composition among our three sample groups may be indicative of each bank’s stage in their evolution and each bank’s critical areas of oversight.
The CFOs at the small and medium banks were paid approximately half of what the companies’ CEOs took home, at median, compared to 40 percent at median for the large banks. When looking at the median for average other NEO compensation, smaller bank NEOs are compensated the highest as a percent of CEO pay at 50 percent. This median compensation figure for other NEOs trends downward for medium banks (44%) and large banks (36%).
| Asset Size | Percent of CEO Total Direct Compensation | |||
| CFO | All Other NEOs | |||
| Median | Range | Median | Range | |
| $1B – $5B | 51% | 31% – 66% | 49% | 30% – 60% |
| $5B – $10B | 49% | 38% – 71% | 44% | 31% – 67% |
| $10B – $20B | 40% | 23% – 61% | 36% | 22% – 61% |
Pay Practices
Annual Incentive Plans
The most common annual incentive plan approach is a “goal attainment” plan where actual financial achievement is compared to pre-established goals made at the beginning of the fiscal year. The banks in our sample typically utilize several corporate metrics when determining their annual incentive payout. Approximately 80 percent of the medium and large banks use three or more weighted financial metrics compared to 85 percent of the small banks. Return measures (ROE, ROA, etc.), Efficiency Ratio, Asset Quality, EPS, and Net Income are the most prevalent metrics used at these banks; however, Returns, EPS and Net Income were typically weighted more than Efficiency Ratio and Asset Quality metrics. The small banks differ from the medium and large banks in that they more frequently use Loan or Deposit measures in their plans, with these metrics usually accounting for no more than 20 percent of the total plan.

Smaller banks also tend to use and assign higher weightings to individual and strategic measures. These individual and strategic measures are prevalent at 54 percent of the small banks studied compared to 46 percent and 35 percent at the medium and large banks, respectively. These individual and strategic measures can often vary year to year due to shifting priorities of different initiatives at the bank. Diversity and inclusion measures are making headlines (i.e., Citigroup included in its scorecard for senior executives), though it is still a minority practice to formally include these types of metrics in incentive plans. These priorities are likely being discussed at all banks, and it will be interesting to see if and how these measures are incorporated in the future when determining compensation.
Long-term Incentive Plans
The most typical long-term incentives used across industries, including the banking industry, include stock options, time-vested stock (restricted stock (RS) or restricted stock units (RSUs)) and performance-vested stock. Most medium and large banks use a portfolio approach in their long-term incentive plan, with approximately three-fourths of these banks granting two or three LTI vehicles. Small banks more frequently either use a single LTI vehicle (43%) or have no long-term incentive plan (14%). The LTI mix seen between the three groups is fairly consistent, with stock options continuing to be the least utilized LTI vehicle, on average about 10 percent of the overall LTI mix. Time-vested restricted stock typically makes up about 30 percent to 40 percent of the LTI mix among these banks, with performance plans making up the bulk (55% to 60%) of LTIs in the total sample.

Performance plans are typically granted annually and have overlapping 3-year performance periods. Payouts can fluctuate based on achievement of performance measures, and the upside is normally limited to 150 percent to 200 percent of the target level. Over three-quarters of companies in each asset group measure performance for their performance plan against two or more metrics. The most prevalent metrics used are relative TSR, Returns and EPS for all three groups, and it is common that two of these measures are paired together to determine all or the majority of the payout. As banks increase in size, it becomes more likely that both absolute and relative comparisons are made when determining payouts; 54 percent of the large banks look at performance on both an absolute and relative basis compared with 36 percent of medium sized banks and 12 percent of small banks.
| Asset Size | Performance Plan Measures | ||
| Measurement Type(s) | |||
| Absolute Only | Relative Only | Both | |
| $1B – $5B | 44% | 44% | 12% |
| $5B – $10B | 43% | 21% | 36% |
| $10B – $20B | 23% | 23% | 54% |
TSR is almost exclusively measured on a relative basis, often measured against either the company-defined peer group or an industry index. Relative TSR is more commonly installed as a weighted metric and can also be used as a final modifier of the calculated payout, typically by 20 percent to 25 percent. For banks with a performance plan, relative TSR is more commonly used at the larger banks (62%) than at the small banks (56%) and medium sized banks (43%).

Incentive Plan Metric Best Practices
It is important for banks to select performance metrics and set targets in their annual and long-term incentive plans that support each organization’s business strategy and priorities for the performance period being assessed.
There is generally a negative perception when a company uses the same measure in both its short- and long-term incentive programs. Despite the different time horizons for measurement, the concern stems from the possibility of excessive risk taking to influence one particular outcome. Looking at only banks with both annual and long-term incentive plans, it is more common for the small and medium sized banks to have the same metric in both their short- and long-term incentive plans. Two-thirds of both the small and medium banks have overlapping metrics compared to less than half (46%) of banks in the largest group. This difference may be driven by the increased external scrutiny on companies as they grow in size.
Incentive plan goal setting and adjustments are also an area of focus from both proxy advisory firms and investors. When targets are set lower than the prior year target and actual results, and adjustments are made to GAAP metrics, the concern is that goals are not challenging, or adjustments are made to overly insulate management from external factors that may have impacted results.
When selecting incentive plan performance measures, alignment with what the bank is trying to achieve is important, and if the decision is made to use the same metrics across incentive plans, it is important to discuss the supporting rationale in the company’s disclosures. Further, banks should disclose the process for determining specific goals and the incentive range, explain if performance goals are lower than the previous year, and describe and provide rationale for adjustments to GAAP measures.
Conclusion
While size may be an indicator of compensation levels and fixed versus variable pay, it is important for banks of all asset levels to continue to tie pay outcomes to performance. As banks review their incentive plan design, they should consider how industry related drivers, such as interest rate movements, deposit betas, ratio of fee to non-fee income, and credit cycles, should be incorporated in performance metric selection. In today’s competitive environment, a well-designed compensation program that is aligned to the bank’s business strategy is necessary to garner shareholder support and to attract and retain talent.
For questions or more information, please contact:
Kelly Malafis
Partner
[email protected]
212-921-9357
Ryan Colucci
Senior Associate
[email protected]
646-486-9745
Shaun Bisman
Principal
[email protected]
212-921-9365
Whitney Cook
Senior Analyst
[email protected]
646-486-9748
Regional Banks in CAP’s Study (n=43)
Small Banks (n=14)
($1B – $5B in assets)
- Bridge Bancorp, Inc.
- Capital City Bank Group, Inc.
- Central Valley Community Bancorp
- CNB Financial Corporation
- Evans Bancorp, Inc.
- Farmers National Banc Corp.
- First Business Financial Services, Inc.
- First Financial Northwest, Inc.
- German American Bancorp, Inc.
- Heritage Commerce Corp
- Independent Bank Corporation
- National Bankshares, Inc.
- Old Line Bancshares, Inc.
- Sierra Bancorp
Medium Banks (n=15)
($5B – $10B in assets)
- 1st Source Corporation
- Amerant Bancorp Inc.
- Banc of California, Inc.
- Boston Private Financial Holdings, Inc.
- Brookline Bancorp, Inc.
- First Busey Corporation
- First Commonwealth Financial Corporation
- First Foundation Inc.
- Lakeland Bancorp, Inc.
- LegacyTexas Financial Group, Inc.
- Opus Bank
- Park National Corporation
- Seacoast Banking Corporation of Florida
- Univest Financial Corporation
- Westamerica Bancorporation
Large Banks (n=14)
($10B – $20B in assets)
- Ameris Bancorp
- Atlantic Union Bankshares Corporation
- BancorpSouth Bank
- Bank of Hawaii Corporation
- Berkshire Hills Bancorp, Inc.
- Cadence Bancorporation
- Community Bank System, Inc.
- First Merchants Corporation
- First Midwest Bancorp, Inc.
- Glacier Bancorp, Inc.
- Great Western Bancorp, Inc.
- Old National Bancorp
- Trustmark Corporation
- United Bankshares, Inc.
Compensation Advisory Partners (CAP) examined executive compensation levels and design practices at 12 publicly traded, U.S. investment banks. The 12 companies in the study have a revenue range of $139 million to $7.2 billion. The broad revenue range enabled CAP to focus on independent, advisory-focused investment banks and to have a sufficient sample for the study. As an additional reference point for comparison purposes, CAP also reviewed executive compensation levels and practices at three large, diversified financial institutions (“Wall Street Banks”) with significant investment banking operations. Revenue at the Wall Street Banks ranged from $35.9 billion to $104.0 billion.1
Key Takeaways
- The investment banking pay model and the industry’s approach to incentive compensation are distinct from general industry practices, and are important to understand when evaluating market data.
- Median pay levels for Chief Executive Officers (CEOs) increased 11 percent from 2017 to 2018, which reflects strong 2018 operating results. Pay levels for Chief Financial Officers (CFOs) increased five percent, while pay levels for other Named Executive Officers (NEOs) increased 11 percent.
- Two-thirds of the investment banks studied now grant performance share units (PSUs) to their CEOs as part of annual incentive compensation awards. CAP expects a continued increase in the prevalence of PSU awards.
- For the investment banks that grant PSUs to their CEOs, the grant value of PSU awards represents approximately one-half of the total value of the deferred, long-term portion of incentive compensation.
A Unique Industry
From economic, performance and compensation perspectives, independent investment banks stand apart from general industry and other financial services firms. The unique aspects of the industry are important to understand when looking at their executive compensation levels and practices.
Human Capital Focus. The investment banking industry has a strong human capital focus: The industry’s assets are its people. Most individuals in the industry are highly educated, trained and compensated. A firm’s success depends on its ability to attract, retain and reward highly skilled bankers with strong business networks and deal-execution skills. Given the industry’s human capital focus, the largest expense category for investment banks is compensation and benefits.
Year-to-Year Results. Like most professional services firms, investment banks focus heavily on year-to-year financial metrics, such as revenue growth, operating margin and overall profitability. The industry tends to be cyclical and highly sensitive to overall economic conditions. In addition, a firm’s results for the year can be skewed by factors such as a large deal closing in January instead of prior to December 31.
A key metric in the evaluation of most senior, non-corporate investment-banking professionals is annual revenue generation. Long-range planning is largely limited to senior corporate executives, and firm investments often generate returns more quickly than in capital-intensive industries.
The Investment Banking Pay Model. Investment banks approach executive compensation in a manner that is distinct from general industry norms. At investment banks, each year a total incentive is determined based on an often highly discretionary review of prior-year performance. The total incentive is then delivered to executives as a mix of annual cash incentive compensation and deferred, long-term incentive compensation. Of the investment banks in CAP’s study, 92 percent use this investment banking pay model for top executives, as do all three Wall Street Banks.
The investment banking pay model contrasts with the broadly used, traditional compensation model where annual incentive and long-term incentive components are separate and determined independently. In most other industries, the annual cash incentive is often determined in a highly structured, formulaic manner, and the annual long-term incentive grant target value is largely market-based, with the grant value being typically independent of prior-year performance.
While executive incentive awards in the investment banking industry tend to be more discretionary in nature when juxtaposed with the more formulaic approach used in general industry, the investment banks do base their year-to-year incentive decisions on specific criteria, such as revenue and profitability. In fact, several of the investment banks in the study disclosed information about their incentive decision-making processes, which can be thought of as following a “structured discretion” approach.
2018 Industry Performance
The investment banks in CAP’s study reported strong operating results for 2018. Revenue increased 14.9 percent, and pre-tax operating income increased 39.7 percent. Despite this, the investment banks’ total shareholder return (TSR) – which takes into account stock price changes and dividends – was down 19.8 percent during 2018, driven by steep declines in the fourth quarter.
The following table summarizes financial and market results for CAP’s investment banking sample for 2018 and 2017:
|
Metric |
Median Percent Change |
|
|
Year Ended December 31, 2018 |
Year Ended December 31, 2017 |
|
|
Revenue |
+14.9% |
+13.4% |
|
Pre-tax Operating Income |
+39.7% |
+14.3% |
|
Operating Margin |
+2.4% |
+0.1% |
|
Return on Equity (ROE) |
+4.5% |
-1.4% |
|
1-Year TSR |
-19.8% |
+25.6% |
|
3-Year TSR (compound annual growth rate, or CAGR) |
+5.7% |
+6.3% |
Source: S&P Capital IQ financial database
In addition to the traditional financial and market-based performance measures, investment banks track and report a human-capital metric called the compensation and benefits ratio. The ratio reflects compensation and benefits expenses as a percentage of revenue. The compensation and benefits ratio among CAP’s investment banking sample declined by 9.3 percentage points for full year 2018 versus full year 2017. This decrease was driven by the year-over-year change in revenue (+14.9 percent), which outpaced changes in compensation and benefits costs.2

Source: S&P Capital IQ financial database
The compensation and benefits ratio is higher for the investment banks in the study relative to the Wall Street Banks. The Wall Street Banks have multiple business lines in addition to investment banking, and have a more diversified workforce in terms of employee roles and pay levels.
Named Executive Officer (NEO) Compensation
CAP analyzed 2017 and 2018 pay levels for the five NEOs disclosed in the proxy statements for each of the investment banks. While base salaries were flat from 2017 to 2018, total compensation was up year-over-year, reflective of an industry focused on linking pay outcomes with performance outcomes.
|
Compensation Component |
Median Percent Change Year Ended December 31, 2018 |
||
|
CEO |
CFO |
Other NEOs (avg.) |
|
|
Base Salary |
No Change |
No Change |
No Change |
|
Incentive Pay |
+11.8% |
+5.1% |
+12.2% |
|
Total Direct Compensation |
+11.4% |
+4.9% |
+11.1% |
The year-over-year pay increase for the CEO and other NEOs was approximately 11 percent, which reflects the industry’s strong 2018 operating performance. The pay increase for the CFO was smaller, at approximately five percent, which is in part reflective of a smaller portion of annual pay being variable for this role, as discussed further below.
Pay Mix and Incentive Compensation
As shown in the pay-mix charts that follow, the investment banking industry places significant emphasis on performance-based, variable incentive compensation. On average, performance-based, variable incentive compensation represents 92 percent of annual pay for CEOs of the investment banks. The other NEOs have a pay mix that is similar to that of CEOs, with 90 percent of annual pay delivered through variable incentive compensation. In contrast, CFOs at investment banks have a slightly less variable pay mix, with about 80 percent delivered through variable incentive compensation and 20 percent delivered in salary.

Investment banks deliver incentive compensation using a mix of cash and deferred equity vehicles, such as restricted stock, restricted stock units and performance share units (PSUs). The long-term incentive component adds a retention hook by deferring payment of a portion of annual incentive pay. It also provides a link to the company’s long-term shareholder value creation. Among the investment banks in the study, approximately two-thirds of CEO incentive pay and approximately one-half of incentive pay for other NEOs have been deferred over at least three years, most often through restricted stock/units but also through performance share units (PSUs).
A notable change within the investment banking industry has been taking place in terms of long-term incentive vehicle prevalence. PSUs have been increasing in prevalence among study companies. In fact, a majority of CEOs of the investment banks now receive annual PSU awards, with prospective, generally three-year performance requirements. Among the CEOs who receive PSUs, approximately half of long-term incentive compensation is provided through these awards. The most common performance metrics associated with PSU use in the investment banking industry are TSR and return measures, such as return on equity (ROE), followed by revenue growth and operating margin.
While investment banks will continue to focus on prior-year performance in making incentive pay decisions, CAP believes that the use of PSUs for top corporate executives will continue to increase at the investment banks in the study. Investors and proxy advisors (i.e., Institutional Shareholder Services, or ISS, and Glass Lewis) encourage the use of PSU programs with prospective multi-year goals.
Equity Overhang
CAP analyzed equity overhang, which is a measure of shareholder dilution. Median equity overhang for the investment banks is 28.0 percent, which exceeds ISS “excessive dilution” thresholds but should be considered within the context of the industry’s human capital focus and the partnership model from which these public companies emerged. The average equity overhang for the Wall Street banks is 13.6 percent.3

ISS uses its Equity Plan Scorecard (EPSC) model to determine the shareholder vote recommendation for new share requests for equity and incentive compensation plans. The EPSC includes certain “overriding” factors, one of which is “excessive” dilution. This factor, which applies to S&P 500 and Russell 3000 EPSC models only, will be triggered by ISS when the company’s equity compensation program is estimated to dilute shareholders’ holdings by more than 20 percent (S&P 500 model) or 25 percent (Russell 3000 model). This overriding factor may warrant an ISS “against” vote recommendation despite an above-threshold EPSC score. All but one of the investment banks in the study are in the Russell 3000, while only two of the companies are in the S&P 500. All three Wall Street banks are in both indices.
Two-thirds of the investment banks have equity overhang levels that would exceed the ISS “overriding” factor threshold. This indicates that, for a majority of publicly traded investment banks, ISS would be likely to recommend that shareholders vote against a new share request no matter what the plan features are or what the benefits of maintaining an ongoing equity compensation plan are to various stakeholders, including the company, employees and shareholders. The ISS “overriding” factor threshold does not make sense for the investment banking industry and exemplifies why industry-specific understanding is important when designing and evaluating compensation programs.
When publicly traded investment banks seek shareholder approval for new share requests, shareholder outreach is advisable, and the resolution should include information that makes a strong case for the share request. Also, setting internal expectations for a likely level of shareholder support is important. For example, among non-S&P 500, Russell 3000 investment banks, median shareholder support for such new share requests during the past three years was approximately 66 percent. ISS recommended that shareholders vote against the proposals, but each time the proposals passed with majority shareholder support (albeit, with lower support than broader market norms, in part driven by proxy advisor policies that do not take into account industry-specific considerations).
Equity Run Rate
CAP also analyzed the equity run rates for the investment banks. Equity run rates measure shareholder dilution from equity grants made in a particular year. In recent years, the median annual gross run rate for the investment banks has ranged from about four percent to 7.5 percent.
Given its human capital focus and approach to incentive compensation, this industry often focuses more on the net run rate, which takes into account forfeitures and repurchases, than on the gross run rate used in most industries. For example, the net run rate is frequently the only version of run rate discussed in new share request proposals in this industry. Among the investment banks, the median net run rate has ranged from approximately -1.3 percent to 2.3 percent in recent years. In this industry, buybacks are often viewed as a tool used to limit or net-out annual shareholder dilution from compensation programs.
Peer Groups for Compensation Benchmarking
CAP assessed the size and composition of the peer groups used by the investment banks for compensation benchmarking purposes. Publicly traded companies generally disclose the peer groups they use for compensation benchmarking purposes in their annual proxy statements. Relative to other industries, the peer groups used by the investment banks are smaller and more industry focused.
Among the investment banks studied, the median peer group size is 11 companies, while the 75th percentile is 14 companies. The peer group size for the Wall Street banks is even smaller, with an average of six companies. In contrast, a recent Equilar and CAP study of 500 companies across different industries found the median peer group size to be 17 companies.
The investment banking peer groups are smaller than those used in other industries because the executive compensation programs in this industry are unique, and companies choose to compare themselves mostly with publicly traded direct competitors – of which a limited number exist. This is very different than how peer groups are approached in many other industries where companies are screened more broadly for size and other operating metrics. In the 500-company general industry sample noted above, only eight percent of companies maintained a peer group where at least 75 percent of constituent companies were from the same industry classification, and only 30 percent of companies maintained a peer group where 100 percent of constituent companies were from the same industry sector classification. In addition, only 54 percent of companies maintained a peer group where at least 75 percent of constituent companies were from the same, broader industry sector classification.
Moreover, when developing or validating a peer group used for executive compensation benchmarking, it is typical practice to use quantitative screens for size and/or other operating metrics. Oftentimes, potential peers with less than one-half or more than two times the revenue of the company are eliminated. However, the investment banks studied do not generally use such narrow size screens when developing or validating their compensation benchmarking peer group.
CEO Pay Ratio
In 2017, most publicly traded companies were required to begin reporting in their annual proxy statement the CEO Pay Ratio, which is the ratio of CEO compensation to that of the median employee. For the investment banks, CEO compensation in 2018 was 42 times the compensation of the median employee at the company. This is significantly less than the median CEO pay ratio among Russell 3000 companies as shown in the following table. The lower CEO pay ratio at investment banks is driven by higher median employee pay relative to general industry.
|
Investment Banks |
Russell 3000 |
|
|
2018 Median CEO Pay Ratio |
42x |
78x |
|
2018 Median CEO Pay |
$5,389,867 |
$5,422,777 |
|
Change from 2017 |
+7% |
— |
|
2018 Median Employee Pay |
$179,011 |
$61,782 |
|
Change from 2017 |
+9% |
— |
The average CEO pay ratio for the three Wall Street Banks was 243x in 2018, much higher than both the 42x and the 78x shown above. Among the Wall Street Banks, average CEO pay was approximately $20 million and average median employee pay was nearly $120,000. CEO pay at the Wall Street Banks reflects the size and complexity of the organizations, and the lower median employee pay reflects the greater variety of business lines and employee roles.
Conclusion and Looking Ahead
During 2018, the investment banks in CAP’s study rewarded executives commensurately with operating performance outcomes. PSU awards, with prospective, pre-defined multi-year performance goals, are now a significant part of incentive compensation awards for CEOs at the majority of the investment banks in the study. Looking ahead, we expect to see an increasing prevalence of PSU awards for corporate leaders at public investment banks. We also expect to see many companies within this industry enhancing their compensation-related shareholder communication, proxy-based and otherwise. Lastly, we have seen the industry heighten its focus on gender pay equity and representation by women in the management ranks; we expect this trend to continue.
The market for talent among independent, advisory-focused investment banks is highly competitive. Companies can choose to compete or fall behind. Doing so effectively – according to internal and external stakeholders – requires real-time industry insight, deviating from market practices that are common in other industries, and a compensation-related shareholder communication strategy that specifically addresses important industry-specific distinctions.
For questions or more information, please contact:
Bonnie Schindler Principal
[email protected] 847-636-8919
Matt Vnuk Principal
[email protected] 212-921-9364
Whitney Cook and Brooke Warhurst provided research assistance for this report.
Appendices
Key Terms Defined
|
Compensation & Benefits Ratio |
Compensation and benefits expense as a percent of revenue. |
|
Equity Dilution or Overhang |
Represents maximum potential dilution (i.e., the sum of all outstanding or available shares under equity plans divided by the sum of the company’s common shares outstanding and all outstanding or available shares under equity plans). |
|
Equity Run Rate (also called “Burn Rate”) |
Represents equity grants (including full-value shares and stock options) made during the year divided by the company’s average common shares outstanding. |
|
Investment Bank Compensation Model |
Reflects an often highly discretionary review of prior-year performance. The total incentive is then delivered to executives as a mix of annual cash incentive compensation and deferred, long-term incentive compensation. |
|
ISS Excessive Dilution Threshold |
ISS policy to vote against new share requests when the company’s equity compensation program is estimated to dilute shareholders’ holdings by more than 20 percent (S&P 500 company) or 25 percent (non-S&P 500, Russell 3000 company). |
|
Net Run Rate (also called “Net Burn Rate”) |
Represents equity grants (including full-value shares and stock options) made during the year minus forfeitures and repurchases divided by average common shares outstanding. |
|
Operating Margin |
Measures how much profit a company makes on each dollar of revenue. The calculation is operating income, or earnings before interest and taxes, as a percentage of revenue. |
|
Total Direct Compensation (TDC) |
The sum of base salary; annual incentives and bonuses; and long-term incentives, such as restricted stock, stock options, and cash- and share-based performance plans. |
|
Total Shareholder Return (TSR) |
TSR measures the change in stock price over a period of time, with dividends assumed to be reinvested at the time they are paid. |
|
Traditional Compensation Model |
Reflects a compensation structure where annual incentive and long-term incentive components are separate and determined independently. This is the typical pay model across industries. |
1 When summary statistics are reported in this study, medians are used for the 12 public investment banks, while averages are used for the three Wall Street Banks.
2 When summary statistics are reported in this study, medians are used for the 12 public investment banks, while averages are used for the three Wall Street Banks.
3 When summary statistics are reported in this study, medians are used for the 12 public investment banks, while averages are used for the three Wall Street Banks.
Investment Banks
- Cowen Inc.
- Evercore Inc.
- Greenhill & Co., Inc.
- Houlihan Lokey, Inc.
- Jefferies Financial Group Inc.
- JMP Group LLC
- Lazard Ltd
- Moelis & Company
- Piper Jaffray Companies
- PJT Partners Inc.
- Raymond James Financial, Inc.
- Stifel Financial Corp.
Selected Wall Street Banks
- The Goldman Sachs Group, Inc.
- JPMorgan Chase & Co.
- Morgan Stanley


