Competitive benchmarking is a critical step in the development of executive compensation programs. Companies typically define their pay philosophies, benchmark competitive pay and practices, design incentive programs and then set pay levels accordingly. Until recently, competitive benchmarking was one of the least contentious steps in the whole process.
Those days are over. Recent corporate governance reports criticized sloppy competitive pay benchmarking practices. One issue with competitive benchmarking is the fact that nearly all companies position executive compensation at median or above. In this case, the competitive data artificially escalates year after year. Second, many governance experts believe that compensation committees have relied too heavily on benchmarking studies and have failed to apply good judgment to the numbers.
Despite the recent backlash, executive compensation benchmarking remains a useful tool when it is carefully executed and balanced with other reference points. Some of the most common—and avoidable—benchmarking pitfalls we see:
- Selection of the screening criteria that will produce an appropriate benchmarking peer group
A variety of criteria can be considered, including industry, size, business economics, business focus, business strategy, common pool for management talent, historical performance and geography. Identification of the critical screening criteria will lead to relevant peer group selection.
- Review and selection of compensation surveys
Just as selecting peers is critical, so is the choosing the appropriate published surveys. Several factors should be considered, including the participation of direct peer or comparison firms, the availability of necessary data (for example, salary, bonus and long-term incentives) and the presence of relevant data cuts. It’s also important to review survey methodology to ensure consistency of approach when multiple surveys are used (three sources per position is ideal).
- Blending proxy and survey data
Several pitfalls can arise when combining proxy and survey data: overweighting proxy data for some positions, using survey or proxy data that are outliers relative to other data sources, and overweighting sources with a small sample size. Look for large enough sample sizes and consistent data and assess whether the data you review is reasonable as part of your assessment.
- Actual versus target bonuses
When analyzing competitive bonus levels, it is important to consider whether the competitive data is reporting target or actual bonus levels. If your company is lagging the industry, target bonus levels may be preferable for the analysis. Your company may provide a competitive target opportunity, but actual payouts are lagging, as they should, because of performance.
For companies challenged by these and other pitfalls or those who do not want to rely entirely on benchmarking to set their executive pay levels, other analyses can be conducted:
- Reviewing internal equity to ensure relative pay levels are reasonable
- Taking performance into account when determining executive pay levels
- Using wealth-accumulation analysis to assess the richness of executive compensation practices
While these analyses are quantitative and number-driven, they too depend heavily on subjectivity and judgment. Selecting the benchmarking approach that’s right for your organization requires an understanding of various resources and methodologies available and the application of them in the context of your business. Despite recent criticisms, competitive pay benchmarking continues to be a useful tool, although it is admittedly an imperfect one.
The full article entitled “The Devil is in the Details: Analytical Pitfalls in Executive Compensation Benchmarking”, written by Bonnie Schindler, appears in the recently published book Survey Best Practices: A Collection of Articles from WorldatWork.
Notable Findings
Total Board Compensation
At median, non-employee director compensation increased three percent in 2012, to $257K, after a six percent increase in 2011 and a flat period in 2010. Year-over-year, median Total Board Compensation increased from $250,000 to $257,0003.
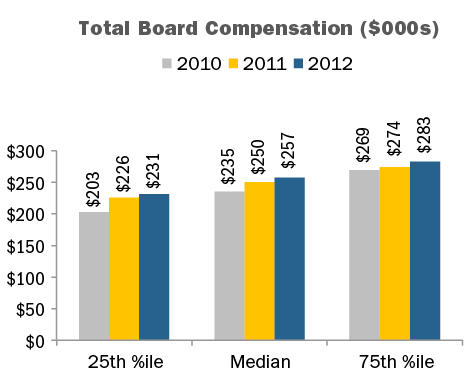
In line with emerging practices, large companies are relying on annual retainers to compensate outside directors. Use of Board meeting fees remained a minority practice in 2012, with only 18 percent of companies paying board meeting fees. This is similar to 2011 and 2010, where 19 percent and 23 percent of companies provided meeting fees, respectively.
Pay Mix
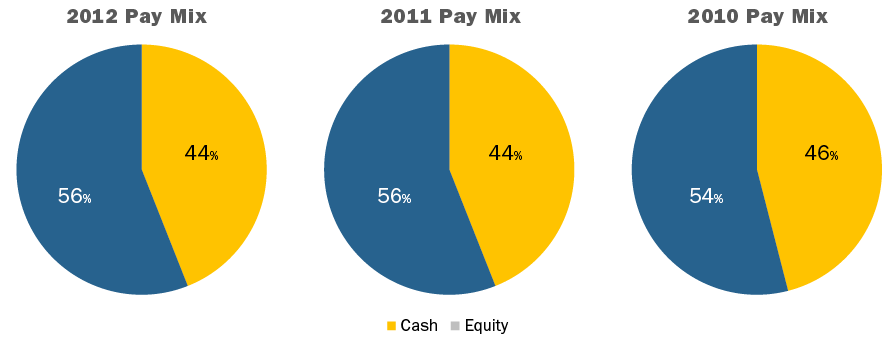
The mix of cash and equity paid to outside directors was generally consistent between 2010 and 2012. On average, the majority of compensation delivered to directors continues to be in the form of equity.
Equity Compensation
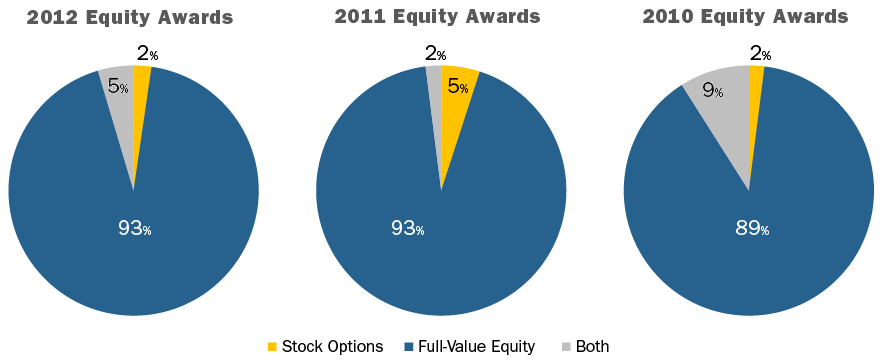
Full-value share equity, including restricted stock units, restricted stock, deferred stock units and outright awards of common stock, continues to be by far the most common form of equity delivered to non-employee directors, with only seven percent of companies using stock options as part of the director compensation package.
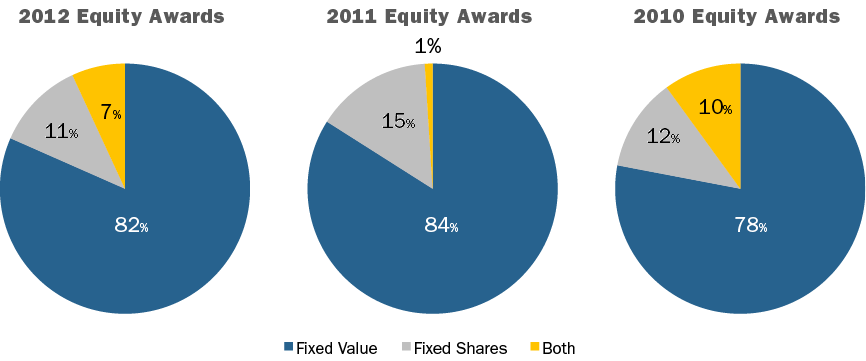
In the recent years, equity awards denominated as a fixed value increased in prevalence, as opposed to awards based on a fixed number of shares.
CAP Perspective: Over the next few years, we expect the following changes in director compensation to take place: 1) low-to-mid single-digit annual increases in Total Board Compensation; 2) more companies moving to fixed retainer pay structures with a component in cash and a component in equity as opposed to paying meeting fees; and 3) a continued emphasis on full-value equity awards. Delivering a majority of compensation in the form of equity coupled with stock ownership / retention requirements creates strong alignment with long-term shareholders and is considered a best practice.
Committee Compensation
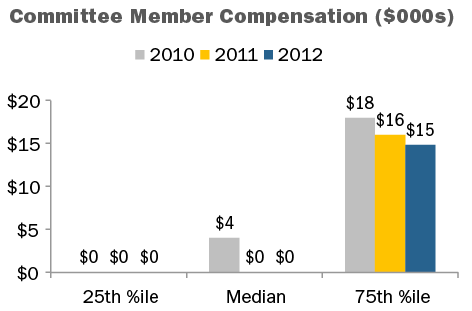
Companies have de-emphasized committee member compensation, instead focusing on overall Board compensation. Our research found that just over 50 percent of companies pay no committee-specific fees to members of any of the three major committees4, similar to 2011 and up from just over one-third in 2010. Since a slight majority of companies do not pay separate fees for committee service, at median committee member compensation is now $05. Among companies that do pay separate fees for committee service, median committee member compensation is $16K.
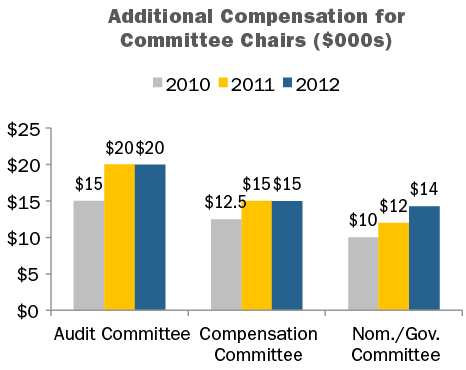
From 2011 to 2012, median additional compensation for committee Chairs remained flat for the Audit and Compensation committees, and increased +17 percent for the Nominating / Governance Committee. Relatively flat year-over-year changes may be associated with a better understanding of the time requirement of the leadership role versus that of a committee member.
CAP Perspective: We expect the trend away from committee member fees to continue, at a slow-to-moderate pace, with the value being rolled into Board cash or equity retainers.
Serving as a committee Chair is generally viewed as a Board leadership role, with additional time requirements, responsibilities, and reputational risk; as a result, additional compensation is often provided for the role.
Near-term, we expect a differential to continue between the additional compensation paid to the Chair of the three major board committees.
Lead/Presiding Directors and Non-Executive Chairmen of the Board
During 2012, the prevalence of providing additional compensation for Lead/Presiding Directors and non-Executive Board Chairs increased to nearly 80 percent, up from approximately 70 percent in 2011 and 65 percent in 2010. In terms of additional compensation for the role, median pay was unchanged at $25,000 in from 2010 to 2012 for Lead/Presiding Directors, and increased slightly for non-Executive Chairs.
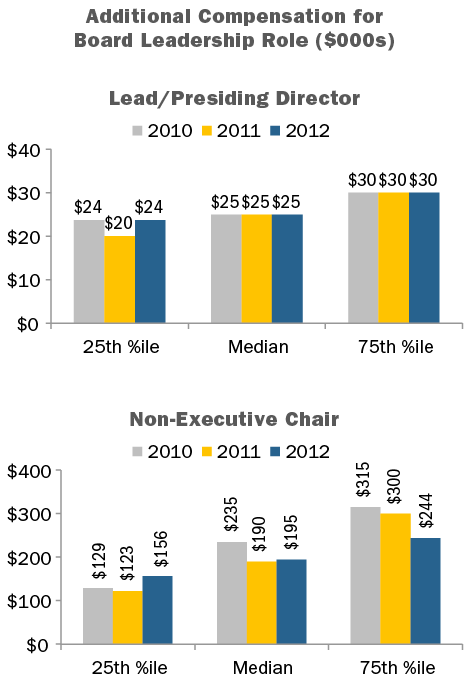
CAP Perspective: While not all non-executive Board leaders receive additional pay for the role, prevalence of additional compensation for these roles is expected to continue to increase over time. The differential in pay between Lead/Presiding directors and non-Executive Chairs is in line with the typical responsibilities of each position.
Conclusion
With the increased scrutiny Boards are under and the time commitment required, in the last five years we have seen a relatively significant increase in non-employee director compensation, though at this point we have hit more of a “steady state” and expect more modest pay level changes going forward. In terms of practices, pay programs have continued a trend towards simplification, as director compensation has become viewed more as an “advisory fee” than an “attendance fee.”
It continues to be important to comprehensively evaluate director pay programs on a regular basis or risk falling behind the curve in terms of desired market positioning and best in class program design. When programs are evaluated, the process and practices listed below should be considered.
|
Best in Class Director Compensation PROCESS |
|
|
Best in Class Director Compensation PRACTICES |
|
1 Analysis includes public Fortune 100 companies (excludes privately held companies).
2 Research assistance for this report was provided by Alex Stahl, Kevin Scott, Armando Rivera and Ryan Colucci.
3 Total Board Compensation reflects all cash and equity compensation for Board and committee service, excluding compensation for additional leadership roles such as committee Chairman, Lead/Presiding director, or non-executive Chairman of the Board.
4 Audit, Compensation and Nominating / Governance committees.
5 Reflects all compensation for committee member service (excludes additional fees for leadership roles), across all Board committees.
The SEC’s proposed rule requires companies to disclose in their registration statements, proxy statements and other annual reports where compensation is mentioned, the following three items: 1.) The annual total compensation of its median employee, 2.) The annual total compensation of the CEO, and 3.) The ratio of the two amounts above. While this calculation seems like straightforward arithmetic, it may prove to be difficult for many companies, especially those whose operations are complex and global.
- Employees Included. As a first step in the process of identifying the median employee, companies must incorporate all employees including full-time, part-time, temporary, non-US employees, and employees of a subsidiary, all of which have been employed on the last day of the fiscal year.
- Identifying the Median Employee: The proposed rule does not specify methodologies for identifying the median employee, aside from the requirement that all employees be considered. Instead, the proposed rule allows companies to choose a methodology for identifying the median employee in a way that is logical and appropriate for the company’s size and structure. Companies can, depending on their complexity, use the median employee of the full-employee population, or rely on statistical sampling to estimate what the median employee earns.
- Determining Compensation of the Median Employee. One of the greatest challenges in calculating the CEO pay ratio was identifying pay for employees in a consistent manner in order to calculate median pay. The proposed rule has provided wide latitude to companies in using alternative definitions of pay for purposes of estimating the median paid employee (e.g., total direct compensation, total cash compensation, W-2 compensation). However, the SEC is more stringent about annualizing pay. While companies may annualize compensation for workers hired mid-year, they would not be permitted to make full-time equivalent adjustments for part-time workers.
- Calculating the Ratio. Once the median employee is identified, compensation for that employee has to be determined. The Dodd-Frank Act requires that employee total compensation would be calculated using the same methodology as required for named executive officers, a requirement that is not currently applied to non-executive employees. A key advantage of the proposed rule is that this more complicated pay calculation only needs to be done for the employee identified as “the median employee”.
CAP Comments: While some commentators hoped that the rule would apply to only U.S. employees or only full-time employees, the proposed rule includes the total employee population. This will make the determination of the median employee more complicated for global employers. In addition, it may create challenges for investors in interpreting the ratio or comparing across companies, as the ratio will vary based on the number of workers employed in low wage countries or the number of part-time or temporary workers employed.
CAP Comments: It is a positive sign that the SEC recognizes the complexity of determining the median employee. Unfortunately, compensation professionals will have to dedicate time and resources to understanding the potential approaches available to them and will likely have to pay external experts to conduct the analysis, particularly if they rely on statistical sampling.
CAP Comments: The latitude provided should simplify calculating pay in a way that facilitates identifying the median employee. The downside of the proposal is that differences in approach may make comparisons of the ratio across companies less meaningful. The limitations on annualizing compensation will result in less favorable CEO pay ratios for companies employing temporary or part-time workers.
CAP Comments: This calculation should be relatively straightforward as the greatest complexity is in identifying the median employee.
Additional aspects to this regulation would require companies to disclose methodologies, estimates and assumptions used in the calculation. As provided by the JOBS Act, the proposed rule would not apply to emerging growth companies, nor would it apply to smaller reporting companies or foreign private issuers.
Implementation Time-frame
Following this proposal, there will be a 60 day public comment period. Companies would be required to report the pay ratio with respect to compensation for its first fiscal year beginning after the effective date. Depending on the effective date of the final rule (2013 vs. 2014), fiscal year companies will first have to report the ratio in their 2015 or 2016 proxy statement, covering pay for the 2014 or 2015 fiscal year.
Overall Comments
The intent of this legislation is to raise awareness around the disparity between pay levels for top executives and the typical worker. However, from our perspective the primary outcome of the rule is an additional burden on companies to comply with this law. Companies will need to spend time and resources collecting and compiling compensation records and will likely require the assistance of technical and legal advisors to establish and implement the approach to identify the median employee. In the cost-benefit analysis section of the proposal, the SEC struggled to identify any quantifiable benefits of the rule, while the costs of compliance are fairly obvious.
The CEO pay ratio will be challenging to interpret. The ratio may vary across companies due to corporate structure and business decisions, rather than the pay philosophy of the company. For example, companies in industries that depend on part-time and seasonal workers will have a pay ratio that looks less egalitarian than a company with only a full-time workforce, regardless of whether each company pays a competitive and market-based wage to each class of employees. Moreover, for companies with concentrations of employees in one or more developing countries, this ratio will exaggerate the difference between executive and employee pay, not to mention the additional administrative responsibilities necessary to convert workers’ wages abroad to US dollars. In contrast, a company that has outsourced all of its low paid administrative functions to India or China, may have a better CEO pay ratio than a company that completes these tasks in-house. While we expect that most investors will ignore the CEO pay ratio, there will likely be reporting of the ratio in the press. Companies should also monitor whether ISS and Glass-Lewis take interest in the pay ratio. While our sense is that the CEO pay ratio is not a primary concern of institutional investors, the shareholder advisory firms are active in finding new areas of executive pay to target for criticism.
Conclusion
Starting now, the SEC will review comments received within the 60 day window, and comments are already being submitted. While it is unknown how such comments will be received and/or incorporated by the SEC, it is important to be thinking ahead to future disclosure and the necessary changes corporate human resources professionals will need to make to comply with the new rule.
Many groups as well as factions within congress lobbied to have this provision of Dodd-Frank removed as the resources required to implement it are anticipated to outweigh the benefits of the additional disclosure. While there has been limited information released from the SEC, it is likely that the guidance will be somewhat less onerous than originally expected, possibly only requiring companies to compare CEO compensation to a sample of employees as opposed to the entire population. More questions than answers still remain, including when the disclosure will be effective. However, as soon as preliminary guidance is released, we will send a comprehensive CAPFlash on the guidance.
Last year, the study showed an increase in compensation for both CEOs and CFOs, but at much lower levels than the prior year. This leveling off of pay was partially driven by a stabilizing economy and increased confidence in goal setting, leading to less volatility in corporate performance results in incentive plans. To determine if this trend is continuing, we conducted a similar study in 2013 using a sample set of 62 US public companies. The study analyzes executive pay data disclosed by companies with revenues ranging from $1 to $145 billion, with median revenues of $9 billion. Only companies with the same CEO and CFO incumbents from 2010 to 2012 were included in order to focus on year-over-year changes for an individual incumbent. Similar to our methodology in prior years, financial services firms were excluded from the study, as this industry’s compensation practices continue to evolve in the years post the financial crisis.
Our findings, summarized below, indicate that overall, increases in total compensation levels for both CEOs and CFOs slowed in 2011-2012 compared to double-digit pay increases in the 2009-2010 period and mid-single-digit increases in the 2010-2011 period. This dramatic slowdown suggests that the halting economic recovery is having an impact. Percentage pay increases in all three years were higher for CFOs compared to CEOs, driven by slightly higher increases in long-term compensation and smaller decreases in annual bonus. The slower rate of growth in CEO compensation may be driven by the continued focus on CEO pay by shareholders and proxy advisory firms and the increased demand for pay and performance alignment. On an absolute basis, CFO pay continues to be approximately one-third of CEO pay.
Study Results
Salaries
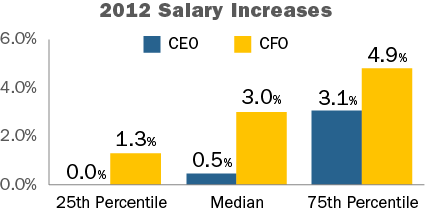
In 2012, approximately 85% of CFOs received salary increases. The median increase was 3.0% and the 75th percentile increase was 4.9%. In comparison, only 53% of CEOs received salary increases and the increases were smaller — 0.5% at median and 3.1% at the 75th percentile. The prevalence of salary increases for CFOs remained similar to last year with about 85% of incumbents receiving a salary increase. Among CEOs, approximately 55% received a salary increase, similar to 2010.
|
Salary Increase Prevalence |
||||||
|
|
2009 – 2010 |
2010 – 2011 |
2011 – 2012 |
|||
|
|
No Increase |
Increase |
No Increase |
Increase |
No Increase |
Increase |
|
CEO |
43.8% |
56.3% |
34.4% |
65.6% |
46.8% |
53.2% |
|
CFO |
25.0% |
75.0% |
12.5% |
87.5% |
14.5% |
85.5% |
Actual Pay Levels
Overall, actual total direct compensation (salary plus actual annual incentive plus the grant date value of long-term incentives) for CEOs and CFOs leveled off in 2011-2012. These lower, single-digit changes in pay levels are consistent with the increased focus on pay for performance we have seen over the last few years. They also likely reflect the slow pace of economic recovery. At the median, salary increases were higher for CFOs than CEOs in 2011-2012. Bonus levels decreased for both CEOs and CFOs and long-term incentives increased modestly (2%) for CFOs and remained flat (0%) for CEOs.
|
Median Percentage Change in Pay Components |
||||||
|
|
2009 – 2010 |
2010 – 2011 |
2011 – 2012 |
|||
|
Pay Components |
CEO |
CFO |
CEO |
CFO |
CEO |
CFO |
|
Salary |
1.0% |
3.7% |
1.8% |
3.5% |
0.5% |
3.0% |
|
Actual Bonus |
19.0% |
22.7% |
0.0% |
3.5% |
-2.8% |
-1.2% |
|
Long-Term Incentives |
10.1% |
14.8% |
10.0% |
10.3% |
0.0% |
2.0% |
|
Actual Total Direct Comp. |
14.4% |
20.0% |
3.6% |
7.5% |
-0.3% |
1.4% |
|
Financial Performance (Median Levels) |
|||
|
Year |
Total Shareholder Return (as of 12/31) |
1-Year Revenue Growth |
1-Year Net Income Growth |
|
2010 |
24% |
10% |
19% |
|
2011 |
5% |
9% |
13% |
|
2012 |
14% |
3% |
2% |
While movement in pay among CFOs and CEOs was directionally aligned, absolute CFO total direct compensation levels, on average, have been approximately 30% of CEO total direct compensation levels over the last three years.
Target Pay Mix
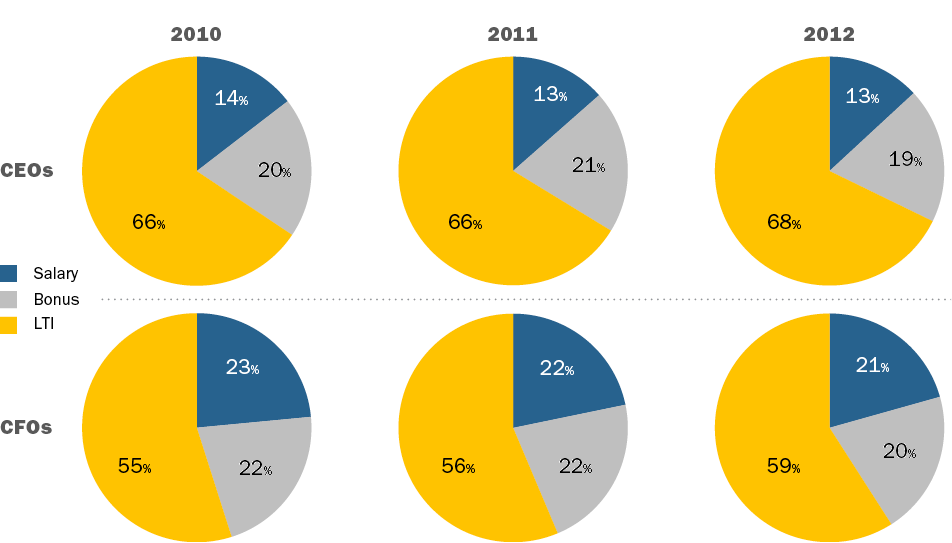
In terms of target compensation levels, the overall pay mix remained largely unchanged from 2010 to 2012, with a greater emphasis on at-risk pay for CEOs than for CFOs.
Long-Term Incentive (LTI) Vehicle Prevalence and Mix
The use of at least two long-term incentive vehicles continues to be the majority practice when awarding LTI to CEOs and CFOs. The role of stock options has remained steady in the overall mix with companies delivering about 30% of LTI using this vehicle. On average, performance-based LTI continues to comprise approximately 50% of LTI for CEOs and CFOs. Data shows that 80% of CFOs and 85% of CEOs received some form of performance-based awards as part of their LTI program in 2012.
|
Number of LTI Vehicles Used in 2012 |
||
|
|
% in Total |
|
|
CEO |
CFO |
|
|
1 |
24% |
17% |
|
2 |
47% |
53% |
|
3 |
27% |
28% |
|
Average |
2 |
2 |
|
LTI Mix |
||||||
|
2010 |
2011 |
2012 |
||||
|
Vehicle |
CEO |
CFO |
CEO |
CFO |
CEO |
CFO |
|
Stock Options |
33% |
30% |
32% |
32% |
30% |
32% |
|
Time Vested Restricted Stock |
20% |
23% |
17% |
22% |
16% |
20% |
|
Perf. Based LTI |
48% |
47% |
51% |
46% |
53% |
48% |
Conclusion
As companies and Boards focus on the alignment between pay and performance, and the economic recovery continues at a slow pace, it is not surprising that pay increases have slowed over the last 3 years. The rates of increases continue to be for higher CFOs compared to CEOs; however, the increases for both have slowed dramatically in 2011-2012. We expect future changes in compensation for these positions to continue to be closely linked to overall company performance, as well stock price performance, since the majority of pay for CEOs and CFOs is delivered through long-term incentives.
Key 1: Committee Composition
Composition of the board Compensation Committee is the first step toward achieving an effective Committee. Below are some tips to keep in mind when determining which Board members should be on the Compensation Committee:
- Compensation Committees are typically composed
of 3 – 5 board members with different, yet complementary backgrounds and skills - The Committee should have representation from an active senior executive, an academic, an industry expert, etc., as appropriate. If the Compensation Committee is composed of members with different backgrounds it will allow for more comprehensive and fully vetted discussions
- The Chair of the Committee should be a strong facilitator who pushes forth open discussion and is willing to hear opposing viewpoints, while being an effective communicator and consensus builder
- The Chair works to bring meetings to resolution and to conduct efficient meetings
Key 2: Planning
A second important factor for having an effective Compensation Committee is proper planning. Providing Committee members with a road map of what is going to happen at each meeting and throughout the year allows for a more thoughtful approach to topics. Some planning tips include:
- Annually review the Compensation Committee charter to ensure that the Committee complies with their responsibilities and to see if any changes are required based on regulatory and legislative changes, or evolving practices
- Review the annual calendar at the beginning of each fiscal/calendar year and highlight any key priorities for the year (e.g., long-term incentive plan re-design)
- Provide Committee member education on key and emerging topics on an ongoing basis so they can make informed decisions. Recent emerging topics include the risk assessment process, SEC disclosure rules, shareholder red flags, and the voting policies of the two main proxy advisory firms – Institutional Shareholder Services (“ISS”) and Glass Lewis
- Obtain views of shareholders on an ongoing basis; listen closely to shareholders to get ahead of any potential issues on an annual basis
- Educate new members to provide them with a background on the company’s historical pay practices and performance
Key 3: Establish Processes
Finally, another important factor for having an effective Compensation Committee is having proper and systematic processes for each Committee meeting. Effective Committee processes include:
- Set meeting dates with plenty of lead time to allow for well attended meetings by Committee members, management and external advisors
- Preview each meeting agenda with Committee Chair; establish time limits for topics
- Preview meeting materials well in advance of meetings to address all issues that may potentially arise
- Allow major decision points to be covered at two meetings to give the Committee time to preview and fully vet prior to final approval
- Ensure open and ongoing communication with management to have context for decision making
- Involve the Audit Committee and company Finance during the goal setting process for absolute performance plan goals in the annual incentive and long-term incentive plans
- Involve Legal in CD&A and proxy disclosure, potential filings related to any pay decisions and other technical issues
- Annually test effectiveness of pay plans relative to actual company and stock price performance as well as pre-established goals
- Monitor evolving regulatory, legislative and corporate governance practices by including the topic as an annual or biannual agenda item
- Conduct an executive session at each Committee meeting to ensure any concerns are addressed
- Schedule calls after each Committee meeting with Committee Chair, management and external advisors to debrief and confirm next steps
- Annually assess the performance of the Compensation Committee and its external advisors during the self-assessment process
In our experience, Compensation Committees that incorporate these three keys have more efficient meetings and are more effective in bringing tough decisions to resolution. While not all approaches will be the same, using a framework with similar characteristics often leads to more engaged Committee members and more organized meetings. In today’s environment, with Say on Pay and increased shareholder concerns, it is increasingly important to have a best-in-class Compensation Committee.
If a separate Chair role is desired, the position may be occupied by either an executive or a non-executive. An Executive Chair is frequently a founder or a recently retired CEO who continues on as Chair for a transition period. In a few cases, particularly where a high level of Board independence is necessary, an outsider is hired into the role. In contrast, a non-executive Chair is often a sitting member of the Board whose role is expanded.
At companies where the roles of Chair and CEO are combined, the Lead Director position has become common. In CAP’s annual survey of director compensation at the 100 largest U.S. public companies, the percentage of companies with a Lead Director increased from 38% to 47% in three years, from 2009 to 2011. The percentage of companies reporting a separate non-executive Chair has stayed more stable over the period, at approximately 20%. (In public companies where there is not an independent non-executive Chair or Lead Director, there will be an independent Presiding Director, at times a rotating position.)
When determining the appropriate Board leadership structure, directors must consider which structure will be optimal for their company and its culture. If a Lead Director or a separate Chair is elected, it is essential that the separate roles are clearly defined. This will allow the Board to work more effectively with the CEO and other members of the management team, as well as to best determine the appropriate compensation for the role.
Typical Responsibilities of Various Board Leadership Roles
Typical responsibilities are summarized below. As the typical responsibilities and related time commitment can vary substantially, so does the typical compensation for each role.
|
Role |
Responsibilities |
|
Executive Chair |
Provides counsel to the CEO on organization structure, financial structure and related topics Plays integral part in strengthening relationships with external stakeholders, including shareholders and regulatory bodies Develops and executes the company strategy with the CEO |
|
Non-Executive Chair |
Takes primary responsibility for shaping Board agendas, with input from the CEO Facilitates discussions between independent directors on key issues outside of Board meetings Has a critical role in succession planning May represent the organization to external stakeholders and employees (at the board’s discretion) Does not typically have a direct role in the company’s operations |
|
Lead Director |
Chairs executive sessions of the Board Works with the Chairman & CEO to set agendas for Board meetings Serves as liaison between the Board and the CEO Facilitates discussions between independent directors on key issues outside of Board meetings Does not typically represent the company to external stakeholders Does not typically have a role in the company’s operations |
Executive Chairman
The role of Executive Chair is often viewed as a transitional role. The role’s influence on the business can vary dramatically from company to company. As such, compensation practices vary widely across companies and will reflect each company’s specific circumstances, including:
- Balance of responsibilities between the CEO and the Executive Chair
- Time commitment/involvement (e.g., 1 vs. 3 days per week)
- Expected tenure of the Executive Chair
- Tenure and experience of the CEO
- Equity ownership – equity grants are less likely if the Executive Chair already has a large ownership stake or if the position is viewed as short-term in nature
- Founder vs. non-founder status
For an Executive Chair, compensation levels often reflect the individual’s prior pay package as CEO, as well as the compensation program and pay levels of the current CEO.
- Typical pay elements include base salary, annual bonus opportunity and long-term incentive awards
- Base salary levels may reflect the salary earned in the individual’s prior position. If the time commitment is reduced, a salary reduction may also apply
- Long-term incentive opportunities of an Executive Chair are normally lower than what the CEO receives
- Long-term incentive vehicles granted may vary from the company’s core executive compensation program, due in part to the expectation of a shorter tenure and less ability/time to impact long-term results
CAP consultants reviewed compensation data among 57 general industry companies with an Executive Chair, comparing Executive Chair pay to that of the CEO. We found that, at median, Executive Chair compensation (including salary, bonus and long-term incentives) was approximately 70% of the CEO’s compensation.
|
2012 Executive Chair Data |
Exec Chair Salary |
Exec Chair TCC |
Exec Chair TDC |
||||||
|
25th |
Median |
75th |
25th |
Median |
75th |
25th |
Median |
75th |
|
|
57 General Industry Cos. (Median Revenues of $2.4B) |
70% |
90% |
100% |
65% |
85% |
105% |
35% |
70% |
100% |
For reference, below is a breakout of the pay package for three recent, high profile Executive Chairs.
|
Recent Executive Chairman Compensation Packages at Large Organizations |
|||
|
Company |
Hewlett-Packard |
Kraft Foods Inc. |
Sara Lee |
|
Revenue |
$127.2B |
$54.3B |
$8.7B |
|
Executive Chairman |
Raymond J. Lane |
John T. Cahill |
Jan Bennink |
|
Date Hired as Executive Chairman |
September 2011 |
January 2012 |
January 2011 |
|
Previous Role |
Non-Executive Chair |
Outside / New Hire |
Non-Employee Director |
|
Base Salary |
None |
$0.75M |
$1.00M |
|
Target Bonus |
None |
$0.75M (100% of base) |
$1.75M (175% of base) |
|
Long-Term Incentives |
$8.44M (1) |
$4.50M |
$5.25M |
|
Target Total Direct Compensation (TDC) |
$8.44M |
$6.00M |
$8.00M |
|
TDC as a % of CEO |
46% |
97% |
129% |
|
LTI Award Vehicle LTI Grant Frequency (annual, one-time) |
20% Time-Based Stock Options 80% Performance-Based Stock Options One-Time(2) |
75% RSUs 25% Stock Options Not disclosed |
50% RSUs 50% Stock Options Not disclosed |
|
Vesting |
Time-Based: 3 Year Ratable Vesting Performance-Based: Requires 120-140% price appreciation |
3 Year Cliff Vesting (RS) 3 Year Ratable Vesting (SO) |
2 Year Cliff Vesting |
|
LTI Award Vehicles Different from Executive LTI Program |
Yes |
Yes |
Yes |
- Excludes fees as non-executive Chair, including $2.19M RSU award
- 1M stock options were awarded (200,000 options with 3-year ratable vesting; 400,000 options vest upon stock price appreciation of 120% from grant price; 400,000 options vest upon stock price appreciation of 140% from grant price).
Non-Executive Chairman / Lead Director Compensation
Compensation packages for non-executive Chairs and Lead Directors typically consist of the core compensation program for non-employee directors along with an additional stipend (or premium) that reflects the responsibilities and time commitment of the role. This approach appropriately recognizes the differential between a leadership position and other directors, with the magnitude of the premium reflecting the additional responsibilities.
CAP’s market data indicates that all companies with a non-executive Chair provide a premium for the role, and 69% of companies provide a pay premium for the Lead Director role.
Non-executive Chair pay is typically delivered in one of two ways:
- An additional retainer paid in cash or stock, in addition to the regular outside director pay program
- A separate fixed dollar amount provided in cash, stock or a combination, in lieu of the regular outside director pay program
As indicated below, the premium provided to a Lead Director is often much smaller than the premium provided to a non-executive Chair. Our data indicates that a non-executive Chair receives a median premium of +65% compared to a regular outside director’s package. For a Lead Director, the median premium is +10%.
|
Non-Executive Chairman and Lead Director Premium Compensation General Industry Companies with Median Revenues of $2.3B |
|||||
|
Leadership Position |
No of Cos. |
Prevalence of Cos. Providing Additional Compensation |
Multiple of Non-Employee Director Compensation (Median) Primary Reference |
Additional Premium – Median |
Additional Premium – Range |
|
Non-Executive Chairman |
42 |
100% |
1.65x |
$100,000 |
$20k – $577K |
|
Lead Director |
114 |
69% |
1.10x |
$20,000 |
$5K – $140K |
Conclusions
The structure and amount of compensation paid to Executive Chairs differ from non-executive Chairs and Lead Directors, a direct reflection of the roles, duties and time commitment required for each position.
Executive Chairs participate in the company’s executive compensation programs. Base salary, annual incentive and long-term incentives are commonly offered, yet pay programs are situation-specific and frequently transitional in nature. The Executive Chair’s expected tenure and perceived ability to influence longer term results are considerations that impact the amount and form of incentive compensation used.
As companies increasingly focus on improving Board independence, it will be important to evaluate whether or not separate Chair and CEO roles are appropriate. Companies should assess which organization structure makes sense given its unique circumstances. Companies anticipating a transition period due to executive turnover, the need to improve governance or a corporate transaction should re-assess the appropriate structure necessary to best navigate through turbulent times.