The SEC recently updated its regulatory agenda, impacting select compensation-related rulemaking that resulted from the 2010 Dodd-Frank Wall Street Reform and Consumer Protection Act (“Dodd-Frank”). As part of the update, the deadline to issue final CEO Pay Ratio rules, final Hedging Disclosure rules, and proposed Compensation Clawback rules was pushed back to April 2016 (from October 2015).
- Implication (Pay Ratio): if final rules are adopted in April 2016, companies with a December 31 fiscal year end are not expected to be required to comply with pay ratio rules/disclosure until publication of 2018 proxy statements
- Implication (Hedging Disclosure): if final rules are adopted in April 2016, companies with a December 31 fiscal year end are not expected to be required to comply with disclosure rules until publication of 2017 proxy statements. However, if the rule is released early, by the end of 2015, disclosure requirements could still be effective for 2016 proxy statements
- Implication (Compensation Clawback): No information regarding effective date(s) is currently available
These timeline changes reflect a new deadline, not the date rulemaking will be published, proposed or adopted.
We will provide additional updates as this issue continues to evolve.
On Wednesday April 29, the SEC held an open meeting and approved by a vote of 3-2 a staff proposal to amend Section 14(i) of the Securities Exchange Act of 1934 to expand disclosure requirements for executive compensation. The proposed amendment was added by Section 953(a) of the Dodd-Frank Wall Street Reform and Consumer Protection Act of 2010. The proposed rules will require clear disclosure of the relationship between executive compensation actually paid and company financial performance.
The SEC’s objectives – enhanced disclosure, more transparency, alignment of pay and performance – are praiseworthy, but some of the new rules are complex. CAP predicts that compliance will prove to be burdensome for most companies.
Highlights of the Proposed Rules
Publication of a New Table: The proposed rules add a new table to the current disclosure on executive compensation. This new table will include:
- Executive compensation actually paid for the principal executive officer and the average amount actually paid to the remaining named executive officers. For purposes of the table, compensation actually paid is total compensation as disclosed in the summary compensation table with adjustments to the amounts included for pensions and equity awards.
- The total executive compensation reported in the summary compensation table for the principal executive officer and an average of the reported amounts for the remaining named executive officers.
- The company’s total shareholder return (TSR) on an annual basis as presented in the existing stock performance graph. The definition of TSR is provided for the stock performance graph in Item 201(e) of Regulation S-K.
- The TSR of the companies in a peer group or index, using either the peer group identified by the company in its stock performance graph or in its compensation discussion and analysis.
CAP predicts that graphic representations, similar to the Stock Performance Graph, will be a popular approach.
Additional Disclosure: In addition to the new table, companies will be required to provide a clear explanation for the relationship between compensation actually paid and the company’s TSR performance. An explanation of the company’s TSR performance and the TSR performance of the peer group or index is also required. Companies will have the flexibility to provide this explanation as a narrative, in a graph or by using both.
Adjustments to Calculate Compensation Actually Paid: Companies will need to make two adjustments to total compensation reported in the summary compensation table to calculate compensation actually paid. The adjustments relate to equity award values and pension values. Companies will be required to disclose the adjustments to the compensation reported in the summary compensation table in a footnote.
First, the reported grant date value of equity will be subtracted from reported total compensation and the fair value of equity vesting in that year and re-valued on the date of vesting will be added to calculate compensation actually paid. Companies will need to disclose the vesting date valuation assumptions if they differ materially from the assumptions used for financial statements as of the grant date.
In the second adjustment, the reported change in pension value will be subtracted from reported total compensation and the change in pension value attributable to the actuarially determined service cost for services rendered by the executive during the applicable year will be added.
Time Period Covered: The disclosure will be required for the last five fiscal years, provided a company was subject to disclosure rules during this period.
Interactive Data Format Required: Companies will be required to tag the disclosure in an interactive data format using eXtensible Business Reporting Language, or XBRL.
Covered Companies: The proposed rules apply to all reporting companies, except that foreign private issuers, registered investment companies and emerging growth companies are exempt.
Transition Period: The proposed rules provide a phase-in for all companies. In the first year, companies will be required to provide the information for three years. The fourth and fifth years of disclosure will be added in each subsequent year’s annual proxy filing that requires this disclosure.
Rules for Smaller Reporting Companies: These companies are required to provide disclosure for only the last three fiscal years, rather than for five fiscal years. Smaller reporting companies will not be required to include peer group TSR, since they do not disclose either a stock performance graph or a compensation discussion and analysis. In addition, smaller reporting companies will not be required to make adjustments to pension amounts because they are subject to scaled compensation disclosure requirements that do not include disclosure of pension plans. The requirement to tag disclosure in an interactive data format will also be phased-in for smaller reporting companies, so that they will not be required to comply with the tagging requirement until the third annual filing in which the pay-versus-performance disclosure is provided. Initially, smaller reporting companies will provide the information for two years, adding an additional year in the next annual proxy or information statement.
Process: The proposed rules will be published on the SEC’s website and in the Federal Register. The comment period for the proposed rules will last for 60 days after publication in the Federal Register.
Adjustment to equity award values adds complexity and creates disconnects. By revaluing equity on the date of vesting, timing differences between the TSR calculation and the date(s) of vesting will occur. In addition, compensation actually paid will include tranches of different awards that happen to vest in a particular year so Board decision-making on pay and performance in the year of grant will be unclear.
CAP’s Initial Assessment of the Proposed Rules
We applaud the SEC’s attempt to improve disclosure and we agree that pay and performance alignment is critical to good governance and effective executive compensation programs. We also agree that some standardization is necessary. Our research indicates that approximately 15% to 20% of S&P 250 companies provide supplemental disclosure of either realized or realizable pay. Currently, there is no standard definition for either formulation of total compensation. Supplemental pay disclosure is frequently compared to TSR performance, but a consistent approach that can be compared across companies does not exist. The proposed rules impose a standard approach, but at what cost?
We are concerned that the proposed rules are too prescriptive and overly complex. Implementation will burden many companies. The proposed definition of compensation actually paid stands out as our biggest concern. The SEC proposal requires companies to re-value equity awards that vest in each year as of the date of vesting. This approach instantly creates timing differences between the stock prices used in the TSR calculation and the stock prices on the date(s) of equity award vesting. Vesting dates occur throughout the year, but occur most frequently in February – April for calendar year companies. As a result, the proposed approach allows for a re-valuation of equity awards at a more current stock price, but that stock price will likely not correlate with the fiscal year end stock price used in the TSR calculation. This is an obvious disconnect.
In addition, the re-valuation of equity awards for most companies will be composed of tranches of different awards that were granted in different years — likely spanning a three to five year period — that happen to vest in a single year. This approach contributes to confusion around the Board’s thinking on pay and performance alignment, rather than increasing clarity. Instead of focusing on the date of vesting, a better approach would be to re-value equity awards granted in a single year using a year-end stock price consistent with the TSR calculations.
Finally, to the extent that a company uses stock options, updating the assumptions used in option pricing models, such as Black-Scholes, to reflect the date of vesting will be time-consuming at best. This means that stock options will not only be re-valued at a new stock price, but that other assumptions, such as expected life, volatility, dividend yield and risk-free rates, must also be updated.
Two other aspects of the proposed rules contribute greatly to the compliance burden. First, the requirement to include compensation of the average of the remaining named executive officers in the new table in addition to the compensation of the CEO will be very complicated for companies to work through. Publication of this average based on equity grants made over a three to five year span to at least four executives for five years potentially requires dozens of calculations. The SEC should have limited the new disclosure to the CEO since that would greatly reduce the compliance burden and arguably allow for a simpler and more targeted explanation of the Board’s thinking. After all, the CEO normally sets the tone for the entire organization!
The second aspect of the proposed rules that increase the compliance burden is the decision to publish five years of information, rather than three years. Arguably longer time frames are positive when assessing TSR performance, but the summary compensation table shows three years of compensation. Most supplemental disclosure of realized and realizable pay out there today incorporates only three years of compensation and performance data. Even though the SEC provides transition relief, building out the new table to cover five years will be burdensome.
Adjustment to change in pension value is appropriate since it eliminates the impact of changes in assumptions for mortality and discount rates.
We will refine our initial assessment and provide more finely tuned comments back to the SEC during the public comment period. We would not be surprised if the SEC backs off on the date of vesting re-valuation of equity in favor of date of grant re-evaluation. Many will recall that when the proxy disclosure rules were initially proposed, equity award values reflected the amounts recognized for financial reporting purposes. After much public discussion and pushback, the SEC amended the disclosure rules in 2009 to incorporate the grant date fair value of equity awards.
More to come on these points in the next few months! We hope that the SEC achieves consensus on effective pay and performance disclosure before the 2016 proxy season begins.
Highlights
- Median increase of 15% in total compensation for CEOs delivered through both above target bonus payouts and higher long-term incentive awards (“LTI”)
- More companies are paying above target bonuses for 2014 performance. 72% of companies had a payout at or above target versus 40% and 46% of companies in 2013 and 2012, respectively
- Companies with higher bonus payouts demonstrated correspondingly higher levels of financial performance, including stronger top-line growth and greater profitability
- Companies continue to shift a greater portion of total LTI into a performance-based vehicle although time-based stock options and restricted stock remain prevalent
- Performance-based long-term vehicles represent the largest portion of LTI with many companies incorporating TSR as a metric
Total Compensation
Among Early Filers with CEOs who held their position for at least two years (37 companies), actual total compensation in 2014 increased 15% from 2013. The increase in total pay was delivered mostly through the annual and long-term incentive awards, with median increases of 18% and 14% increases year over year, respectively.
|
Compensation Element |
% Increase at Median |
|
Base Salary |
1.5% |
|
Annual Incentive |
18% |
|
Total Cash |
9% |
|
Long-Term Incentive (LTI) |
14% |
|
Total Compensation |
15% |
Base Salary
Among the Early Filers, companies continue to provide modest salary increases to the NEOs. Salary increases for incumbent CEOs ranged from 0 – 5%. Approximately 50% of companies did not increase their CEO's salary in 2014.
Annual Incentive Compensation
2014 was a strong financial year for the Early Filers, reflected in 8.8% EPS growth at median and 15% TSR for the year. This resulted in higher annual incentive payouts compared to both 2013 and 2012. 72% of companies had a payout at or above target versus 40% and 46% of companies in 2013 and 2012, respectively.
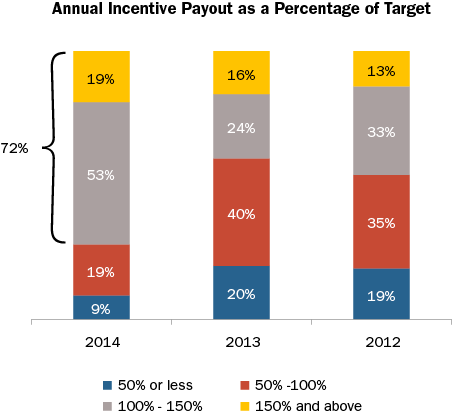
The companies that paid a bonus at or above target had stronger financial performance than both the S&P 500 and all Early Filers. Higher performance among companies with higher bonus payouts was evident in all three financial metrics examined, including Revenue growth, Pre-tax Income growth and EPS growth. For example, median EPS growth for these higher performers was 13.3% (versus 9.9% among the S&P 500 and 8.8% among all 50 Early Filers). Higher performance for companies with above target bonus payouts demonstrates that pay and performance is well-aligned. One-year TSR performance (as of February 2015) was similar across all groups.
|
Financial Metric |
Median 1-Yr Performance |
||
|
S&P 500 |
All Early Filers (n=50) |
Companies with at or above target payout (n=36) |
|
|
Revenue Growth |
5.2% |
5.7% |
6.4% |
|
Pre-Tax Income Growth |
8.3% |
6.2% |
9.7% |
|
EPS Growth |
9.9% |
8.8% |
13.3% |
|
TSR |
15.7% |
15.2% |
15.2% |
Median annual incentive payout as a percentage of target for all Early Filers was 111% in 2014 which was higher than the median in both 2013 and 2012.
|
Summary Statistics |
Annual Incentive Payout as a % of Target |
||
|
2014 |
2013 |
2012 |
|
|
75th Percentile |
136% |
116% |
130% |
|
Median |
111% |
94% |
100% |
|
25th Percentile |
99% |
75% |
72% |
Although 2014 was a strong year, companies are continually refining their annual incentive plan to ensure executive pay is aligned with performance. Among companies in our study, 34% made changes to the annual incentive plan with a majority of companies making changes to annual incentive metrics.
The chart below illustrates all changes companies made to their annual incentive plan:
|
Type of Change Reported |
Companies Reporting Changes (n = 17) |
|
|
# of Cos. |
% of Cos. |
|
|
Change in performance metrics used to fund awards |
12 |
71% |
|
Change in performance metric weighting / mix |
4 |
24% |
|
Increased target annual incentive award opportunity (CEO and/or CFO) |
4 |
24% |
|
Other |
4 |
24% |
Note: Percentages add to greater than 100% due to multiple changes by select companies.
Long-Term Incentive Compensation
The use of time-based LTI (stock options and restricted stock) continues to be prevalent, yet performance-based LTI continues to play the strongest role in the overall LTI mix.
Approximately 50% of companies in our study made changes to their overall LTI program. Most changes involved the mix of vehicles, which continues the recent trend of increasing performance-based LTI and reducing the reliance on time-based long-term incentives. The table below indicates all changes made by the Early Filers:
|
Type of Change Reported |
Companies Reporting Changes (n = 26) |
|
|
# of Cos. |
% of Cos. |
|
|
Mix of LTI award vehicles |
11 |
42% |
|
Increased or reduced LTI award target opportunity level (CEO and/or CFO) |
8 |
31% |
|
Performance plan metric |
7 |
27% |
|
Add or eliminate LTI vehicle |
7 |
27% |
|
Vesting/performance period |
4 |
15% |
|
Other |
2 |
8% |
Note: Percentages add to greater than 100% due to multiple changes by select companies.
Among the companies that changed their LTI mix, most increased the emphasis on performance-based LTI while reducing stock option use. The portion of LTI awarded in the form of time-based restricted stock remained relatively unchanged. Overall, nearly 90% of companies use performance-based LTI, 74% use stock options and 62% use time-based restricted stock.
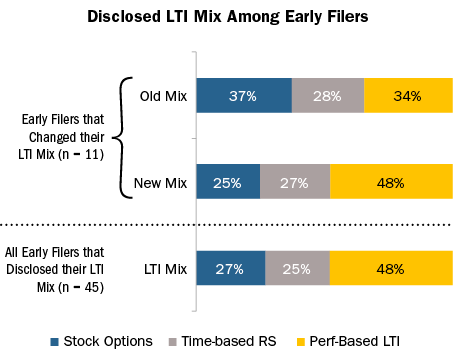
Among the Early Filers that grant performance-based LTI awards, approximately 60% use two or more metrics. The use of multiple metrics provides balance and rewards executives based on holistic performance.
Approximately two-third of companies use relative Total Shareholder Return ("TSR") as a performance metric. Companies incorporate TSR as a long-term incentive metric for multiple reasons including aligning with the shareholder experience, simplifying the goal-setting process and conforming to proxy advisory firms’ preference for TSR. Among the companies that use relative TSR as a standalone metric, it typically represents 25-50% of the total performance award. Some companies use financial performance (either absolute or relative) to fund the payout of the performance award and use relative TSR to modify the final payout, thereby incorporating it as an LTI metric but reducing its overall effect on payouts.
|
Weighting of TSR Metric in the LTI Plan (n = 28) |
Number of other LTI Metrics |
% of Companies |
|
25% |
1 – 2 |
11% |
|
50% |
1 |
29% |
|
Weighting not disclosed |
2 |
7% |
|
100% |
0 |
32% |
|
Modifier |
2 – 3 |
21% |
Say on Pay (SOP) Vote Results
In 2015, 98% of Early Filers that released SOP results this year received majority shareholder support; most companies (approximately 75%) received greater than 90% support. Compensation program design changes can and do improve Say on Pay results! Among the companies that made changes to either their annual or long-term incentive plan in 2014 (n = 29), 97% received majority shareholder support with approximately 70% receiving greater than 90% support. However, making a change to the incentive program design does not guarantee shareholder approval of the executive compensation program.
When fundamental problems with the compensation program exist – such as high pay levels or misalignment with performance – companies may fail the SOP vote. Additionally, poor SOP results can be attributed to shareholders expressing dissatisfaction with other aspects of the company’s business, its management or TSR performance.
Conclusion
2014 annual incentive payouts among the Early Filers were higher than 2013 which, when combined with the rise in LTI award levels, resulted in a 15% increase in total compensation. We saw a big increase in the number of companies with at or above target bonus payouts, as well as higher performance among these companies. Nearly 65% of companies use TSR as a long-term incentive metric, suggesting that companies are trying to enhance alignment between executive pay and shareholder experience.
Companies continue to make changes to their annual incentive and LTI plans, with a strong focus on enhancing the pay for performance relationship through modification of the annual incentive metrics and/or the long-term vehicle mix. Among companies that changed their LTI vehicle mix, they tended to increase the role of performance-based LTI. Our experience suggests these trends are consistent with the broader market practice. While changes to the incentive plan will likely lead to a favorable Say on Pay vote, companies should be aware of that other factors may affect the vote.
Key Takeaways
- Compensation Committees face intense scrutiny with respect to executive annual bonus payouts and their alignment with performance
- Over a multi-year period, executives tend to earn an annual incentive payout approximately 90% of the time
- As a general rule of thumb, based on analysis of the past 6 years, the degree of difficulty, or “stretch”, embedded in performance goals translates to:
- A 90% chance of achieving Threshold performance
- A 70% chance of achieving Target performance
- A 15% chance of achieving Maximum performance
- This pattern indicates that threshold and target performance goals are set at attainable levels, but maximum payouts commonly reflect rigorous goals and superior performance
- Annual incentive payouts have generally been aligned with financial performance over the past six years for the companies reviewed
Background
Goal setting is one of the most challenging aspects of the compensation process. Compensation Committees struggle with this critical activity and try to determine if they are “getting it right”. Goals tied to annual incentive compensation face scrutiny from both internal and external stakeholders, pressuring Committees to achieve a balance between the rigor and the attainability of their goals. Appropriate performance targets will motivate and retain executives while driving corporate performance and creating returns for shareholders.
Summary of Findings
Plan Design
Annual incentive plans can be categorized as either “Goal Attainment” plans or “Discretionary” plans. Goal attainment plans contain traditional performance and payout scales that consist of a pre-determined minimum, target and maximum level of performance and corresponding payouts. Discretionary annual incentive plans allow the Committee to determine payouts by using discretion and targets are not necessarily defined up front.
In this study, we found that 71% of the sample companies have goal attainments plans. Discretionary plans are most prevalent among Financial Services companies. Our analysis focuses on those companies with goal attainment plans.
|
Plan Type |
|||
|
Industry |
Sample Size |
Goal Attainment |
Discretionary |
|
Auto |
n= 7 |
100% |
0% |
|
Consumer Discretionary |
n= 10 |
90% |
10% |
|
Consumer Staples |
n= 11 |
91% |
9% |
|
Financial Services |
n= 12 |
17% |
83% |
|
Healthcare |
n= 10 |
100% |
0% |
|
Industrials |
n= 14 |
79% |
21% |
|
Insurance |
n= 11 |
45% |
55% |
|
IT |
n= 12 |
75% |
25% |
|
Pharma |
n= 10 |
60% |
40% |
|
Total |
n= 97 |
71% |
29% |
Performance Metrics
In most goal attainment plans, awards are earned based on corporate performance related to two or three metrics. While the metrics vary by industry, some of the most common metrics are revenue and profitability. These metrics are popular because they are indicators of financial health to the investment community. From an internal perspective, revenue and profitability are simple to understand and in the “line of sight” for most executives in that the correlation can be seen between actions/decisions and results. From an external perspective, most shareholders would support an above target payout for executives who are driving top-line growth while maintaining or expanding margins.
|
# of Metrics Used in Goal Attainment Plan |
||||
|
Industry |
1 Metric |
2 Metrics |
3 Metrics |
4+ Metrics |
|
Auto |
0% |
43% |
57% |
0% |
|
Consumer Discretionary |
33% |
22% |
45% |
0% |
|
Consumer Staples |
20% |
40% |
10% |
30% |
|
Financial Services |
0% |
50% |
50% |
0% |
|
Healthcare |
20% |
50% |
20% |
10% |
|
Industrials |
27% |
55% |
9% |
9% |
|
Insurance |
0% |
40% |
40% |
20% |
|
IT |
11% |
22% |
56% |
11% |
|
Pharma |
0% |
0% |
50% |
50% |
|
Total |
16% |
36% |
33% |
15% |
Pay and Performance Scales
At companies with goal attainment plans, Compensation Committees must annually approve minimum, target and maximum goals and corresponding payout levels, for each metric in the incentive plan. Among companies included in our research, the most prevalent payout scale awarded executives 50% of target for threshold performance and 200% of target for maximum performance. Companies most often structure payout scales so that executives will earn 100% of their target annual incentive award for target performance and the actual payout is interpolated between threshold and target and target and maximum.
Annual Incentive Plan Payouts Relative to Goals
All Companies
Based on CAP’s review of annual incentive payouts, companies achieve threshold performance goals 90% of time. Annual incentive payouts most often fall between target and maximum. Companies’ annual incentive plans pay at this level 48% of the time or approximately one out of every two years. Executives earn bonuses in the range of threshold to target about 20% of the time, roughly once in every five years. Approximately 10% of the time, companies do not achieve threshold and executives do not earn a bonus. Payouts for the total sample are distributed as indicated in the following charts:
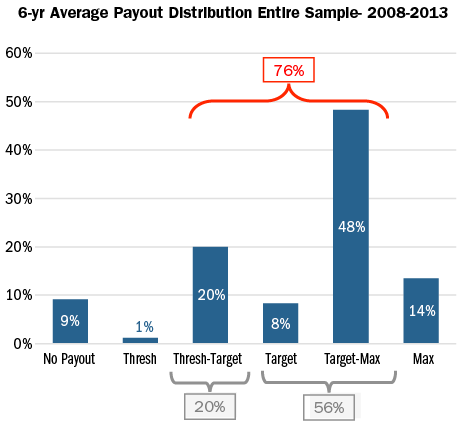
This analysis of the payout distribution is helpful in defining the degree of difficulty, or “stretch”, embedded in performance goals. Our analysis can be summarized with the following rule of thumb where Compensation Committees structure annual bonus performance goals with:
- A 90% chance of achieving Threshold performance
- A 70% chance of achieving Target performance
- A 15% chance of achieving Maximum performance
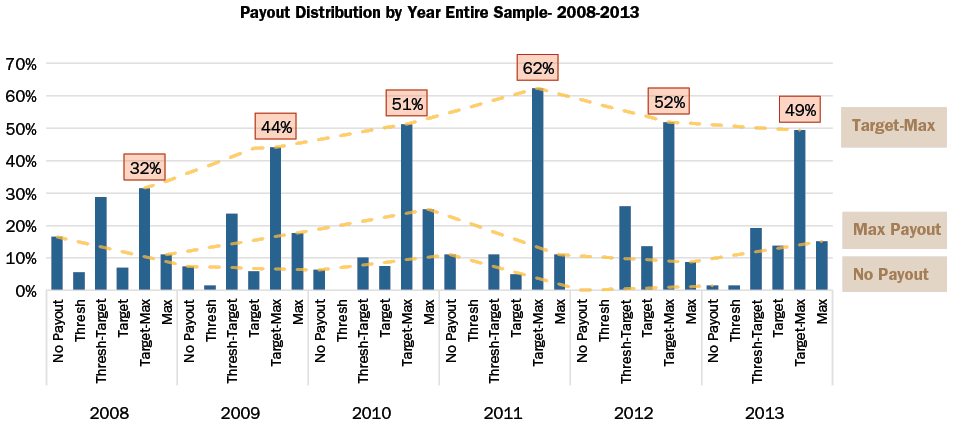
When the payout distributions are reviewed by year, the percentage of companies that paid target to maximum steadily increased from 2008-2011. This reflects an improvement in the overall economy since the financial crisis in 2008 as well as a greater ability to forecast performance in a more stable environment.
By Industry
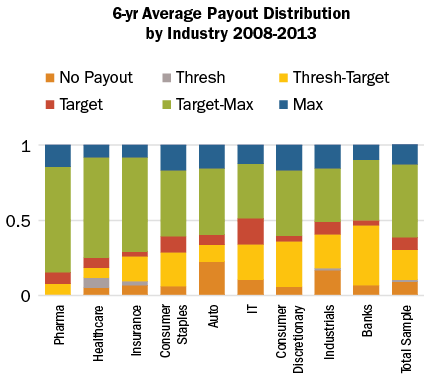
While historical payout levels vary by industry, all industries, on average, have most frequently paid bonuses between target and maximum. The Auto and Industrials industries are notable outliers in that executives received zero payouts once in every four years and once in every five years, respectively, likely indicative of industry dynamics and macro-economic conditions more than overly rigorous goal setting. Most cases when Auto companies did not pay annual incentives occurred in 2008, the peak of the financial crisis. Average payouts for each industry are distributed as indicated in the following chart:
Relative to Performance
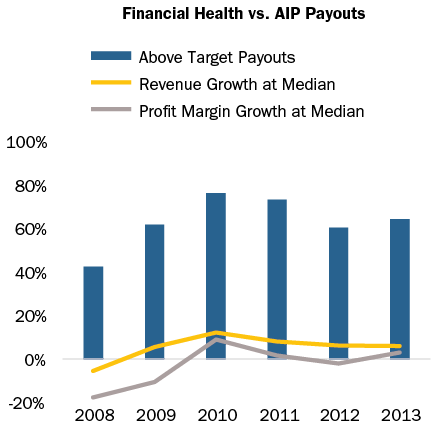
Over the past 6 years, the number of above target annual incentive payouts in a given year has generally tracked revenue growth and profit margin growth in the same year. In particular, payouts at Industrial and Pharmaceutical companies have aligned directionally with revenue and profit margin growth. This pay and performance relationship is key to aligning executives’ interests with those of shareholders. If the company exceeds anticipated performance, executives will earn above target payout levels without contest from internal or external stakeholders; however, if an executive is able to achieve extraordinary levels of pay without extraordinary performance, Committees risk facing opposition from shareholders and proxy advisory firms.
The chart below depicts the relationship between median revenue and profit margin growth and above target annual incentive payouts.
Conclusion
Threshold and target annual incentive performance goals are intended to be challenging but attainable. Maximum performance goals are meant to be attained only when executives achieve exceptional performance, exceeding internal/external expectations. Our study supports the formulation of a general rule of thumb, based on analysis of the past 6 years, where the degree of difficulty, or “stretch”, embedded in performance goals translates to:
- A 90% chance of achieving Threshold performance;
- A 70% chance of achieving Target performance; and
- A 15% chance of achieving Maximum performance.
This distribution indicates that Compensation Committees have built an appropriate degree of stretch into annual incentive plans overall.
We believe that when Committees set performance goals, they are influenced by prior year performance as well as economic and industry outlooks. Yet when measuring the directional trend over the past six years, we believe that Compensation Committees are adequately aligning internal performance goals with incentive payout objectives, and developing rational stretch above and below target — thus striking the right balance between the size and frequency of annual incentive payouts.
Methodology
Compensation Advisory Partners (“CAP”) reviewed the annual incentive plan designs of approximately 100 large companies representing a cross-section of industries. The companies included in this study have median revenues of $33 billion, a median market cap of $52 billion and a median 6-year total shareholder return of 9%, through year end 2013.
CAP analyzed the annual incentive plan payouts of the companies in the sample over the past 6 years to determine the distribution of incentive payments and the frequency with which executives typically achieve target payouts. In this analysis, CAP categorized actual bonus payments (as a percent of target) into one of six categories based on payout ranges as depicted in the following chart:
|
Payout Category |
Payout Range |
|
No Payout |
0% |
|
Threshold |
Up to 5% above Threshold |
|
Threshold – Target |
5% above Threshold to 5% below Target |
|
Target |
+/- 5% of Target |
|
Target – Max |
5% above Target to 5% below Max |
|
Max |
5% below Max to Max |
KEY TAKEAWAYS
- The use of performance-based long-term incentives (“LTI”) continues to be the prevailing practice, constituting more than 50% of the typical LTI program for Named Executive Officers (“NEO”)
- Companies have been re-examining the mix of components in their LTI program and actively increasing performance-based awards, while de-emphasizing stock options and time-based restricted stock
- While used to a lesser extent, stock options and time-based restricted stock continue to be part of the LTI program for many NEOs
- The most prevalent metrics used in performance-based LTI plans are return measures, such as ROI, Total Shareholder Return (“TSR”) and Earnings Per Share (“EPS”)
- Many companies have decided that the use of a two-pronged approach of measuring performance results against both internal goals and relative to the external market is a best practice
Compensation Advisory Partners (“CAP”) reviewed 2014 proxy disclosures for a 100 company subset of the Fortune 500 representing a cross-section of nine industry groups. The industry groups included: Automotive, Consumer Goods, Financial Services, Health Care, Insurance, Manufacturing, Pharmaceutical, Retail, and Technology. Our research examined changes in executive compensation practices in 2013, or indicated for 2014, and observations on current trends and pay program design. This CAPflash focuses on long-term incentive plan design and notable trends including changes made in 2013 or planned for 2014.
The companies included in this study have a median revenue size and market capitalization of $32B and $52B, respectively. The median total shareholder return was 43% for 2013.
TRENDS IN LONG-TERM INCENTIVE PLAN DESIGN
51% of companies in our study made changes to the LTI plan design in 2013 or for 2014. Companies continue to reduce the emphasis on time-based restricted stock and stock options and deliver a greater portion of LTI compensation in the form of performance-based equity or cash awards. Among companies that changed their LTI mix, most companies reduced the emphasis on stock options (71%) and/or increased the emphasis on performance-based LTI (67%). 33% of companies that changed the LTI mix reduced the emphasis on time-based restricted stock.
This continued shift towards performance-based LTI compensation reflects an effort by companies to respond to shareholder feedback and align executives’ pay with performance. Target Corporation, for example, responded to a number of shareholder comments calling for a greater link between pay and performance. In 2013, Target eliminated the use of stock options (which represented 75% of total LTI in 2012) in favor of a 100% performance-based LTI program.
The overarching priority for many companies is to use LTI vehicles that best align with their business strategy and unique shareholder value proposition. For example, Aetna, Inc. replaced performance-based market share units (“MSUs”) with time-based stock appreciation rights (“SARs”) in 2014. Aetna disclosed that the longer term nature (10 years) of SARs “…supports the Company’s long-term strategic focus to drive change in the healthcare industry and to create long-term shareholder value.” Another example is Pfizer, Inc. which grants 5- and 7-year Total Shareholder Return Units (“TSRUs”). Pfizer discloses that the value executives realize from TSRUs “…is consistent with the value received by Pfizer’s shareholders.”
The table below outlines the reported changes among companies in our study:
|
Type of Change Reported in CD&A |
2013 No. of Cos. |
% of Cos. |
|
|
2013 (n = 51) |
2012 (n = 55) |
||
|
Change in mix of LTI award vehicles |
21 |
41% |
44% |
|
Change in performance plan metric |
17 |
33% |
27% |
|
Add or eliminate LTI vehicle |
10 |
20% |
36% |
|
Change in LTI award target opportunity level |
7 |
14% |
13% |
|
Change in performance plan comparison/peer group |
2 |
4% |
5% |
|
Other |
10 |
20% |
20% |
Note: Percentages add to greater than 100% due to multiple changes by certain companies.
PREVALENCE OF LONG-TERM INCENTIVE VEHICLES
Over the past three years, the prevalence of stock options has declined slightly and the use of time-based restricted stock has been relatively flat. Companies tend to grant these vehicles as a supplement to performance-based LTI.
Below is the breakdown of the percentage of companies granting each LTI vehicle to NEOs from 2011-2013:
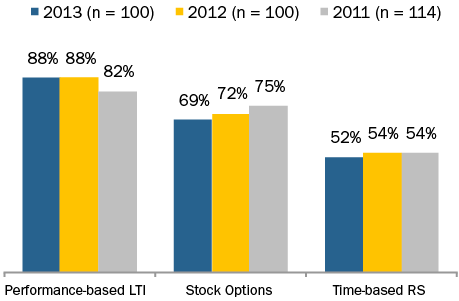
Note: Percentages add to greater than 100% because most companies grant a variety of vehicles.
Companies continue to use multiple vehicles to deliver LTI to executives. 51% of companies in our study deliver LTI in the form of two vehicles, 29% use three vehicles and 20% use only one vehicle. Among the companies that deliver LTI compensation through one vehicle, 60% grant only performance-based LTI.
LONG-TERM AWARD MIX
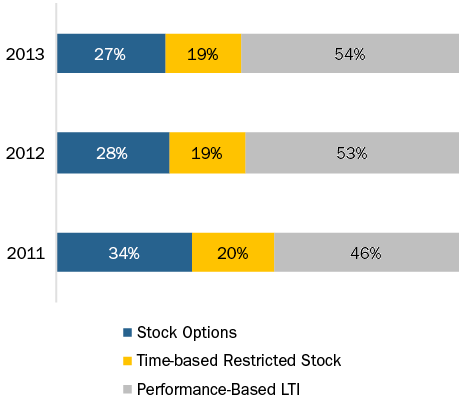
The average LTI mix in 2013 is generally consistent with 2012. Performance-based LTI continues to represent more than half of the LTI mix (approximately 55% of total LTI) while stock options represent approximately 25% and time-based restricted stock represents 20%.
The chart below depicts the average LTI mix for NEOs as disclosed in the CD&A:
PERFORMANCE-BASED LTI METRICS
Companies routinely reassess their LTI plan design, including the performance metrics used, to ensure that the design reflects the company’s business strategy and objectives to attract, incentivize and retain executives. Among performance-based LTI plans, the use of a return measure increased to 49% in 2013 (up from 41% in 2011) indicating that companies are trying to encourage operational efficiency, along with profitability and growth. Among the companies that use return measures, 47% use ROI or ROIC, 37% use ROE and 16% use ROA. TSR and EPS are also prevalent long-term incentive metrics, used by 42% and 36% of companies, respectively. In our study, most companies with performance-based LTI plans use two metrics.
Companies are also more likely to use LTI metrics that reflect key measures of success in their industry. The Automotive industry frequently uses Cash Flow as a metric, focusing executives on liquidity to manage the significant cash requirements associated with the industry. In the Pharmaceutical and Technology industries, where the success of a company’s pipeline and current product offerings is reflected in their stock price, TSR is used more frequently as a metric.
Overall, 49% of companies in our study measure performance relative to the external market (typically using TSR) and 89% measure performance against pre-established goals (typically internal financial metrics). Although the use of relative TSR has increased slightly since 2011, the use of absolute internal financial metrics is most prevalent. Approximately 92% of companies that use TSR, measure performance relative to a defined comparator group (54% use a defined peer group, 40% use a broader industry index and 6% use both) while nearly 95% of companies measure financial performance against pre-established goals based on the business plan.
In recent years, companies have moved away from using only absolute or relative performance measures and instead frequently use a two-pronged approach. In 2013, 37% of companies used both absolute and relative performance measures compared with 24% in 2011. The use of both absolute and relative performance measures allows companies to evaluate performance from a balanced perspective, considering both internal and external results.
The chart below displays the prevalence of LTI metrics for performance-based awards in 2011-2013:
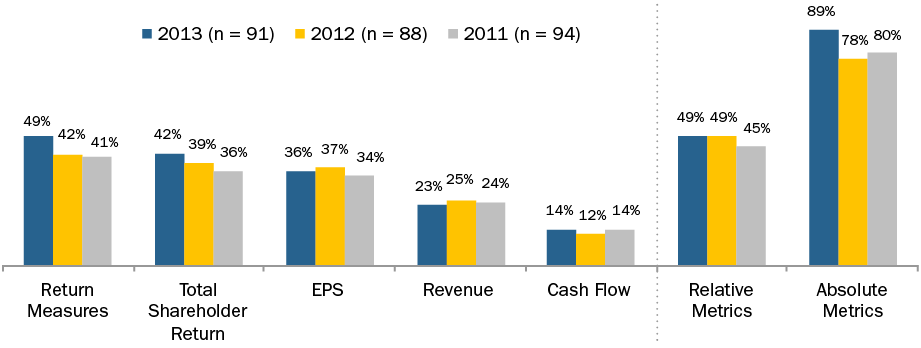
Note: Percentages add to greater than 100% due to multiple responses. Return measures reflect ROE, ROIC and ROA
CONCLUSIONS
The role played by performance-based LTI within LTI programs continues to grow. Performance-based LTI constitutes 54% of total LTI, on average, for NEOs. As performance-based LTI grows, the use of stock options and time-based restricted stock has been declining; however, these vehicles often have a role in a well-designed LTI program since stock option value depends on longer-term stock price appreciation and time-based restricted stock serves as an excellent retention vehicle.
The most commonly used metrics are return measures, such as ROI, as well as TSR and EPS. These metrics demonstrate that companies are attempting to use LTI to incentivize operational efficiency, profitability and growth. While most companies evaluate financial performance against internal goals, a growing number of companies have adopted a two-pronged approach to long-term performance measurement. These companies use internal financial goals and also incorporate a relative goal (typically TSR) to measure company performance in the context of the external market.
While most companies have already implemented changes that provide for a stronger link between executive pay and company performance, we expect to see companies continue to refine their performance-based LTI plans to support their business strategy. Additionally, we expect that setting meaningful long-term financial goals will continue to be a challenge for many companies leading some to incorporate relative performance metrics in the LTI program.
HIGHLIGHTS
- Companies rarely make wholesale changes to plans, but frequently revisit the performance metrics used
- Most companies use multiple measures to ensure the plan provides balance and aligns with overall business strategy
- Overall, 2013 annual incentive payouts were higher than in 2012 indicating stronger performance
Survey Sample
Compensation Advisory Partners (“CAP”) reviewed 2014 proxy disclosures at a sample of 100 companies among the Fortune 500 representing nine industry groups. Industry groups included: Automotive, Consumer Goods, Financial Services, Health Care, Insurance, Manufacturing, Pharmaceutical, Retail, and Technology. For the companies studied, the median revenue size and market capitalization was $32B and $52B, respectively. The median 2013 total shareholder return (TSR // change in stock price plus dividends) was 43%.
CHANGES IN ANNUAL INCENTIVE PLAN DESIGN
Overall, 34% of companies in CAP’s study changed their annual incentive plan design in 2013 or 2014. The most common changes were to the performance metrics used to fund awards (47% of the companies making a change) or to the weightings applicable to performance metrics (32%). Another frequent change was to increase the target award opportunities offered to Named Executive Officers; reductions in target awards were made much less frequently. These changes, as well as other modifications shown in the chart on the right, illustrate that companies continue to review and enhance the pay-for-performance relationship through changes to the annual incentive program.
|
Type of Change Reported in CD&A |
2013 No. of Cos. |
% of Cos. Reporting Changes |
||
|
2013 (n = 34) |
2012 (n = 37) |
2011 (n = 43) |
||
|
Change in performance metrics used to fund awards |
16 |
47% |
43% |
28% |
|
Change in performance metric weighting/mix |
11 |
32% |
35% |
42% |
|
Increased/Reduced target award opportunities (CEO and/or CFO) |
11 |
32% |
11% |
21% |
|
Other changes |
4 |
12% |
22% |
19% |
|
Change in maximum award payout |
3 |
9% |
8% |
12% |
Note: Due to multiple changes, does not add up to 100%.
Change in Performance Metrics
Among the companies that changed the annual incentive performance metrics, about one-half of companies modified plan metrics while maintaining the current number of metrics to better align pay with performance:
- Ten (10) companies kept the same number of metrics but replaced a metric in the incentive plan
- Four (4) companies reduced the number of metrics, and
- Two (2) companies added metrics to the current plan.
Several companies indicated that their rationale for changing annual incentive metrics was, in large part, to have a more holistic view of overall company performance and to better align incentives with their business strategy:
- AFLAC Inc: Added Operating Return On Equity (OROE) as a performance metric for senior vice presidents and above; this metric allows shareholders to evaluate AFLAC’s financial achievements relative to other organizations in terms of how effectively capital is used to generate earnings
- Danaher Corp: Added Return On Investment Capital (ROIC) in order to help validate the efficiency of earnings and complement the cash flow metric
- United Technologies Corp: Changed the earnings metric from EPS to Net Income since Net Income is not impacted by share repurchases
- Bristol-Myers Squibb: Replaced Adjusted Net Cash Flow from Operations with a metric for pipeline performance that consists of regulatory submissions and approvals and is a better indication of long-term growth potential.
Change in Target Bonus Opportunity
In 2013, median target bonus opportunities for CEOs increased (by 9 percentage points), while the opportunities for CFOs decreased (by 3 percentage points). Most notably, target bonus opportunity for CEOs in the Automotive, Insurance, and Retail industries increased by 10 percentage points year over year. However, the Technology industry experienced a significant decrease (21 percentage points) due to an increase in the base salary for Cisco’s CEO (from $375,000 to $1,100,000) and a decrease in the target opportunity for the new CEO at Intel (from 462.7% of base salary to 239.2%).
Median target bonus opportunity for CFOs in the Automotive industry experienced a decrease of 5 percentage points in 2013 largely due to the promotion of a new CFO at Goodyear (target opportunity decreased from 91% to 63% of base salary). Conversely, target bonus opportunity for CFOs in the Insurance industry increased (8 percentage points) in 2013; all other industries saw little movement to the target bonus opportunity.
|
Industry |
Median Target Bonus as a % of Salary |
|||||
|
CEO |
CFO |
|||||
|
2013 |
2012 |
2011 |
2013 |
2012 |
2011 |
|
|
Automotive |
135% |
125% |
130% |
85% |
90% |
88% |
|
Consumer Goods |
160% |
160% |
170% |
93% |
95% |
100% |
|
Financial Services |
n/m |
n/m |
n/m |
n/m |
n/m |
n/m |
|
Health Care |
150% |
145% |
145% |
100% |
101% |
100% |
|
Insurance |
210% |
200% |
200% |
133% |
125% |
120% |
|
Manufacturing |
157% |
154% |
156% |
100% |
97% |
95% |
|
Pharmaceutical |
150% |
150% |
150% |
98% |
97% |
91% |
|
Retail |
180% |
170% |
168% |
85% |
83% |
85% |
|
Technology |
210% |
231% |
200% |
130% |
131% |
121% |
|
Total Sample |
166% |
157% |
153% |
100% |
103% |
100% |
Note: Financial Services industry is excluded since most companies in our study do not disclose target bonus opportunities for the Named Executive Officers.
ANNUAL INCENTIVE PLAN DESIGN / PRACTICES
Award Leverage
Disclosure of the payout range (i.e., both threshold and maximum payout as a percentage of target) is a limited practice as most companies reviewed did not disclose a threshold level of performance required to receive a bonus payment. For the 37 companies that disclose a threshold bonus, 50% of target is the most common payout percentage. However, 20 companies disclose a minimum bonus payout of less than 50% of target; a majority of these companies provide a payout based on multiple plan metrics.
Approximately 75% of companies disclose the maximum bonus opportunity. A majority (60%) have a maximum bonus opportunity of 200% of target bonus. Ten (10) companies have a maximum bonus of 250% of target or higher. A majority of these companies are in the Consumer Goods, Pharmaceutical, and Technology industries.
|
Threshold as a % of Target (n=37) |
Maximum as a % of Target (n = 73) |
|||||
|
Range |
# of Cos. |
% of Cos. |
Range |
# of Cos. |
% of Cos. |
|
|
< 25% |
10 |
27% |
> 125% < 150% |
2 |
3% |
|
|
> 25% < 50% |
10 |
27% |
> 150% < 200% |
14 |
19% |
|
|
50% |
13 |
35% |
200% |
44 |
60% |
|
|
> 75% < 100% |
4 |
11% |
> 200% < 250% |
3 |
4% |
|
|
> 250% |
10 |
14% |
||||
Annual Incentive Plan Metrics
EPS, Revenue, Cash Flow and Operating Income are the most prevalent metrics used in annual incentive plans. Although EPS is the most common metric overall, it is the most common metric for only two industries (Financial Services and Healthcare). Revenue, the second most common metric, is the most prevalent in four industries (Consumer Goods, Pharmaceutical, Retail and Technology). Our findings suggest that EPS is used more broadly across industries while Revenue tends to be used in consumer-driven industries.
Most companies (approximately 70%) use more than one performance metric in the annual incentive plan. 25% of companies disclose using two (2) metrics in their annual incentive programs, 25% use three (3) metrics, and 21% of companies use four (4) or more metrics. Approximately 62% of these companies use a profit-based metric in combination with Revenue and/or Cash Flow.
The chart below shows the three (3) most metrics by industry in 2013:
|
Industry |
Metric #1 |
Metric #2 |
Metric #3 |
|
Automotive |
Cash Flow (45%) |
EBIT (45%) |
ROA (27%) |
|
Consumer Goods |
Revenue (67%) |
EPS (58%) |
Cash Flow (33%) |
|
Financial Services |
EPS (33%) |
ROE (17%) |
Op. Income (8%) |
|
Health Care |
EPS (40%) |
Op. Income (30%) |
EBIT (30%) |
|
Insurance |
Op. Income (46%) |
Op. ROE (23%) |
Op. EPS (15%) |
|
Manufacturing |
Cash Flow (30%) |
EPS (30%) |
Revenue (20%) |
|
Pharmaceutical |
Revenue (70%) |
EPS (70%) |
Pipeline/R&D (50%) |
|
Retail |
Revenue (40%) |
Op. Income (40%) |
EBIT (30%) |
|
Technology |
Revenue (58%) |
Cash Flow (50%) |
Op. Income (33%) |
Note: Percentages reflect the prevalence of companies disclosing the metric.
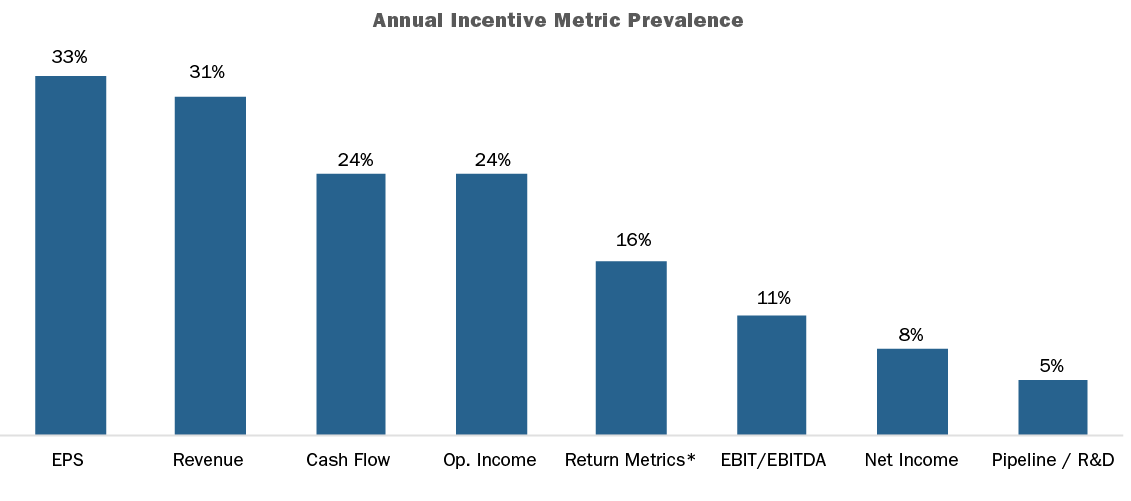
*Return metrics include: ROE, Op. ROE, ROA, and ROI/ROIC
2013 Actual Bonus Payout
Nearly all companies (98%) in our research awarded bonuses to their Named Executive Officers for 2013 performance. Overall, the median CEO bonus was 121% of target compared to 112% in 2012, indicating that 2013 performance was generally stronger than 2012. Most industries exceeded target bonus payouts by 11 – 65 percentage points. However, two industries (Retail and Technology) fell short of expectations by 22 and 12 percentage points, respectively.
Use of deferral mechanisms in the annual incentive plan is a limited practice and is more common in the Financial Services industry given regulations from the Federal Reserve. However, a few companies across industries also have a deferral policy in place. Companies typically defer annual incentive payment in the form of restricted stock/units.
|
Industry |
Actual Bonus as a % of Target Bonus – CEO |
||||||||
|
75th Percentile |
Median |
25th Percentile |
|||||||
|
2013 |
2012 |
2011 |
2013 |
2012 |
2011 |
2013 |
2012 |
2011 |
|
|
Automotive |
183% |
131% |
186% |
165% |
102% |
153% |
127% |
69% |
130% |
|
Consumer Goods |
133% |
137% |
149% |
112% |
103% |
132% |
70% |
94% |
78% |
|
Financial Services |
142% |
120% |
130% |
126% |
80% |
114% |
101% |
44% |
111% |
|
Health Care |
149% |
157% |
159% |
127% |
127% |
127% |
116% |
103% |
116% |
|
Insurance |
170% |
144% |
130% |
150% |
130% |
106% |
123% |
112% |
85% |
|
Manufacturing |
119% |
146% |
162% |
111% |
107% |
136% |
98% |
100% |
119% |
|
Pharmaceutical |
158% |
156% |
161% |
138% |
142% |
144% |
122% |
125% |
130% |
|
Retail |
119% |
136% |
147% |
78% |
117% |
129% |
68% |
79% |
112% |
|
Technology |
121% |
124% |
149% |
88% |
99% |
100% |
69% |
90% |
75% |
|
Total Sample |
151% |
144% |
156% |
121% |
112% |
133% |
96% |
93% |
105% |
Note: Most companies in the Financial Services industry does not disclose target bonus. Figures for the Financial Services industry reflects bonus as a percentage of 3-year average actual bonus.
Use of Discretion
Approximately 50% of companies in our research disclose the use of discretion in the annual incentive plan. Among these companies, approximately 40% allow only for downward adjustments of the final payout. Approximately 55% allow for both upward and downward adjustments by funding bonuses for Name Executive Officers at maximum based on a financial metric (this is unrelated to the final award allocation which may have additional performance requirements) to ensure compliance with Section162(m) of the Internal Revenue Code. This approach provides the Committee with the most flexibility in determining the bonus payout.
Conclusion
Given significant changes to the annual incentive plan design in recent years, companies rarely made wholesale changes to the overall plan design in 2013 or for 2014. Among the companies that made changes, most were focusing on refining the incentive metrics to ensure a more complete view of company performance and alignment with the overall business strategy. Despite these changes to the incentive metrics, EPS, Revenue, Cash Flow and Operating Income continue to be most common. While we would not expect to see extensive changes to the incentive plan design in the future, we anticipate that companies will continue to refine their metrics and the metric weightings as they continue to ensure executive pay is aligned with performance.
Highlights
- Companies continue to refine their existing stock ownership guidelines and stock retention requirements to demonstrate good governance and support shareholder alignment
- 98% of companies have one or both of these types of guidelines
- Median CEO stock ownership guideline has increased to 6x base salary from 5x since 2010
- Stock retention requirements have increased in prevalence since 2010, with 49% of companies using stand-alone stock retention requirements and/or stock retention requirements associated with a stock ownership guideline
Survey Sample
Compensation Advisory Partners (“CAP”) reviewed 2014 proxy disclosures at a sample of 100 companies among the Fortune 500, representing nine industry groups. Industry groups included: Automotive, Consumer Goods, Financial Services, Health Care, Insurance, Manufacturing, Pharmaceutical, Retail, and Technology. For the companies studied, the median revenue size and market capitalization was $32B and $52B, respectively. The median 2013 total shareholder return (TSR // change in stock price plus dividends) was 43%.
PREVALENCE OF STOCK OWNERSHIP GUIDELINES AND STOCK RETENTION REQUIREMENTS
The prevalence of stock ownership guidelines among companies reviewed is approximately 93%, showing a slight uptick since 2010, when approximately 89% of companies had stock ownership guidelines in place. Between 2010 and 2013, companies with both stock ownership guidelines and stock retention requirements increased to 44% from 22%, while the prevalence of having only stock retention requirements remained flat at 5%. The number of companies with no form of stock ownership guidelines or stock retention requirements decreased to 2% from 5%. Companies are demonstrating increased efforts toward good corporate governance by ensuring executives hold a meaningful amount of equity.
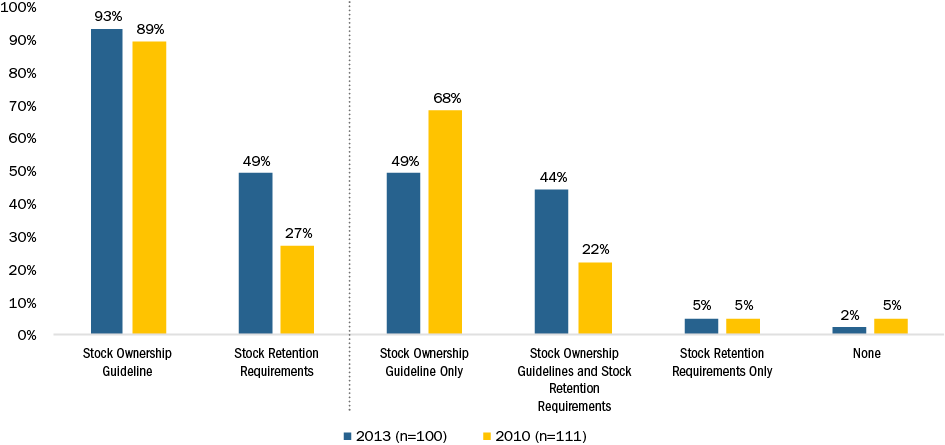
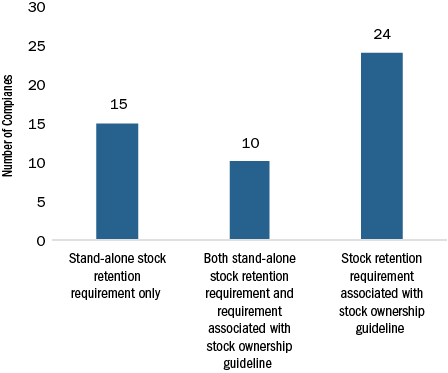
The most common stock retention requirement is to require executives to hold shares until a stock ownership guideline is achieved (34 companies). Implementation of stand-alone stock retention requirements that apply even after a stock ownership guideline has been achieved (25 companies) is a growing trend that we have seen over the last 3 years.
Prevalence of Different Forms of Stock Retention Requirements (n=49)
EXAMPLES OF STOCK RETENTION REQUIREMENTS
Stand-alone stock retention requirement only: AT&T
“Executive officers are required to hold 25% of the AT&T shares they receive (after taxes and exercise costs) from an incentive, equity, or option award granted to them after January 1, 2012, until one year after they leave the Company.”
Both stand-alone stock retention requirement and requirement associated with stock ownership guideline: Lincoln Financial Inc.
“If at any point the ownership guideline is not met with shares otherwise owned by the executive, the executive would be required to retain 50% of the net profit shares resulting from previously granted equity-based long-term incentive plan awards that are exercised or vest as applicable. Additionally, once an executive has met the minimum share ownership levels, they are also required to retain an amount equal to 25% of the net profit shares resulting from equity-based long-term incentive plan grants for five years from the date of exercise for stock options or the date of vesting for other awards.”
Stock retention requirement associated with stock ownership guideline: Gap, Inc.
“Executives not meeting the requirement must retain 50% of after-tax shares acquired through stock compensation programs until the requirement is reached.”
STOCK OWNERSHIP GUIDELINES
83% of companies express stock ownership guidelines as a multiple of salary and 13% express guidelines as a fixed number of shares. Fixed share guidelines tend to be more prevalent in the Financial Services (50%), Technology (33%), and Retail (33%) industries. Companies that use a fixed share approach generally have a volatile stock price, so locking in on a number of shares helps mitigate the potential challenges of meeting the stock ownership requirement.
|
CEO Stock Ownership Requirement Prevalence |
2013 (n = 93) |
2010 (n = 99) |
||
|
# of Cos |
% of Cos |
# of Cos |
% of Cos |
|
|
Multiple of Salary |
77 |
83% |
80 |
81% |
|
Fixed Shares |
12 |
13% |
15 |
15% |
|
Lesser Of Approach |
1 |
1% |
2 |
2% |
|
Other* |
3 |
3% |
2 |
2% |
*Other includes: Fixed Value, Multiple of Target Cash and Multiple of Notional Base
Stock ownership guidelines for CEOs have increased since 2010, with the median requirement increasing from 5x to 6x multiple of salary in 2013. The median fixed share guideline also increased to 250,000 shares compared with 150,000 shares in 2010. This suggests that companies may be increasing their fixed share guidelines to align with companies that have adopted higher multiples of salary. In 2013, the median stock ownership requirement value for the CEO is $7.7M compared with $6.7M in 2010, a significant increase of approximately 15%.
|
CEO Stock Ownership Requirement |
2013 (n = 100) |
2010 (n=99) |
||||
|
25th %ile |
50th %ile |
75th %ile |
25th %ile |
50th %ile |
75th %ile |
|
|
Multiple of Salary |
5x |
6x |
7x |
5x |
5x |
6x |
|
Fixed Shares |
125,000 |
250,000 |
500,000 |
100,000 |
150,000 |
300,000 |
|
Total Value |
$6.3M |
$7.7M |
$9.7M |
$5.4M |
$6.7M |
$8.6M |
Most companies require executives to achieve an ownership guideline requirement within 5 years. Thirteen companies (14%) disclosed a penalty for not achieving the required ownership level. The most common penalties for non-compliance include restrictions on selling shares (75% of companies), followed by reductions in future total compensation (25% of companies).
When determining which shares count towards ownership requirements, companies must consider whether to include unvested full-value shares, unexercised options or unearned performance shares. Of the companies reviewed, 69 out of 93 disclose the type of shares that count toward the guideline. Approximately 40% of companies count unvested restricted stock toward the requirement, (up from 33% in 2010) and less than 10% count unvested options or vested but unexercised options.
|
Shares Counting Toward Guideline Requirement |
2013 (n = 93) |
2010 (n = 99) |
||
|
# of Cos |
% of Cos |
# of Cos |
% of Cos |
|
|
Shares directly owned |
65 |
70% |
55 |
56% |
|
Shares in 401(k) plan |
37 |
40% |
33 |
33% |
|
Unvested restricted stock |
36 |
39% |
33 |
33% |
|
Shares indirectly owned |
32 |
34% |
29 |
29% |
|
Deferred compensation |
26 |
28% |
25 |
25% |
|
Vested but unexercised options |
7 |
8% |
6 |
6% |
|
Unvested options |
1 |
1% |
1 |
1% |
|
Not disclosed |
24 |
26% |
29 |
29% |
Note: Percentages add up to greater than 100% due to multiple types of equity counted by various companies.
Companies generally do not count unearned performance shares toward stock ownership guidelines. It is more common to included unvested restricted stock, as the eventual vesting of these shares is much more certain, since achievement of performance hurdles is not guaranteed.
STAND-ALONE STOCK RETENTION REQUIREMENTS
Companies with stock retention requirements most often require executives to hold net shares from option exercises, restricted stock share/unit vesting or performance share payouts. Requiring executives to hold net shares for one year post exercise or vest (64%) has remained the most prevalent holding period, increasing from 46% prevalence in 2010. Other companies require executives to hold shares for a 1 year period post-retirement (20%), while fewer companies require shares to be held until retirement (8%).
|
Period Subject |
2013 (n = 25) |
2010 (n = 24) |
||
|
# of Cos |
% of Cos |
# of Cos |
% of Cos |
|
|
1 year post exercise/vest |
16 |
64% |
11 |
46% |
|
2 years post exercise/vest |
0 |
0% |
1 |
4% |
|
Retirement |
2 |
8% |
8 |
33% |
|
Post-retirement |
5 |
20% |
1 |
4% |
|
Other |
2 |
8% |
4 |
17% |
|
Not disclosed |
0 |
0% |
1 |
4% |
Note: Holding requirement only for companies with stand-alone holding requirement. Percentages may add up to greater than 100% due to different holding periods for the CEO vs. other NEOs.
STOCK RETENTION SHAREHOLDER PROPOSALS
While companies may maintain stock ownership guidelines and/or stock retention requirements, they are not shielded from receiving shareholder proposals that require executives to hold a meaningful percentage of equity until requirement. Among the Russell 3000, 30 companies in 2014 and 46 companies in 2013 received shareholder stock retention proposals. In all cases, the proposals failed or were withdrawn. The median level of shareholder support for these proposals was less than 25%.
Disclosed Changes to Stock Ownership Guidelines and Stock Retention Requirements
22% of companies disclosed making a recent change to their stock ownership guidelines. Of those companies that modified their guidelines, the two most common changes were adopting a stock holding requirement (32%) and increasing the ownership guideline (27%).
|
Changes To Stock Ownership Guidelines and Stock Retention Requirements |
2013 (n = 22) |
2010 (n = 25) |
||
|
# of Cos |
% of Cos |
# of Cos |
% of Cos |
|
|
Added holding requirement |
7 |
32% |
6 |
24% |
|
Increased guideline requirement |
6 |
27% |
12 |
48% |
|
Newly adopted stock ownership guideline |
5 |
22% |
1 |
4% |
|
Changed fixed value / multiple approach |
2 |
9% |
n/a |
n/a |
|
Adopted mandatory holding of shares through retirement |
1 |
5% |
1 |
4% |
|
Extended participation |
1 |
5% |
n/a |
n/a |
|
Modified penalty for non-compliance |
n/a |
n/a |
5 |
20% |
SUMMARY
In 2014, companies continued to practice good governance by enhancing their stock ownership guidelines. Additionally, companies continue to implement stock retention requirements, albeit at a slower rate. Stock retention requirements most often serve as a supplement to existing stock ownership guidelines. Overall, we expect companies to continue to strengthen their stock ownership and stock retention requirements because these policies address issues important to both shareholders and proxy advisory groups, and align executives with shareholders.