For many years, common practice in U.S. public companies has been to combine the roles of chief executive officer (“CEO”) and chairman of the board (“COB”), typically assigning the COB title and responsibilities to the sitting CEO. More recently, due to increased focus on governance and risk management, companies frequently separate the two roles. In some cases, companies will transition outgoing CEOs to the COB role. The duties of a separate COB can vary a great deal between companies, and expectations for the role as well as time served in the role will impact compensation. This review focuses primarily on the transition from CEO to COB and highlights compensation practices and factors influencing pay.
Prevalence of COB Role
Based on a review of companies ranging from $1 billion to $20 billion in revenue, we found that approximately 10% of companies operate with an Executive Chair and 45% have a Non-Executive Chair. Among the 10% with an Executive Chair, approximately one-half are founders (or have significant ownership in the company, i.e., more than 15% of shares outstanding), and the majority were former CEOs. This fact pattern is a very rational and effective progression, providing a smooth transition and advantages to the new CEO, shareholders, and the company’s overall operating efficiency. In the case of Non-Executive chairs, it is more common for the role to be filled from outside the company or by a member of the board of directors.
The need for and role of a separate COB evolves for different reasons. The responsibilities and time commitment of this role can vary greatly by company. Many founders step out of the CEO role to reduce their time commitment, but continue on as COB for many years so they can oversee the results of the company and weigh in on the company’s performance and strategy. Alternatively, the board may ask an exiting CEO to stay on for a year to help with the transition to a new CEO and provide continuity to the organization. It may be that an exiting CEO stays on to oversee a major initiative that needs dedicated oversight. The role could evolve as a result of a spin-off from an existing public entity. While difficult to generalize, there are certain duties that may be a part of any separate COB role such as executive coaching and mentoring, succession planning, and long-term strategy development. The COB is most often an advisory role, with no oversight of daily operations. These responsibilities dictate the planned timing of the role itself, be it short or long-term service in the position.
Overall Pay Levels and Pay Practices for Chairman Role
Pay Levels
While there is variation in pay practices that we discuss below, our research shows that the following pay practices, expressed as a relationship between compensation of the Executive COB and CEO roles.
Pay Summary Stats
|
Scenario (at Median) |
Base |
Bonus |
LTI |
TDC |
|
CEO Transition to Chairman |
||||
|
Chair Role Pay as a Percentage of Pay while Serving as CEO |
~100% |
~100% |
~40% |
~50% |
|
Chair Role Pay as a % of New CEO Pay |
95 – 105% |
85 – 95% |
55 – 65% |
65 – 75% |
|
Chairman that is founder/significant shareholder |
||||
|
Chair Role Pay as a % Current CEO Pay |
~90% |
~85% |
~25% |
~60 |
The background of the incumbent assuming the COB role may create some variations to pay levels and practices. For example, Executive Chairs that are founders/significant owners of their company make about 35% more, at median, than non-founder Executive COBs.
Pay Practices
We frequently see the following pay practices:
- Since many COBs have transitioned from the CEO role and have accumulated a large equity stake, or are founders with significant equity ownership, equity compensation tends to account for a smaller portion of the compensation package when compared to current CEOs.
- More companies grant stock options or restricted stock with time-based vesting, instead of granting long-term performance-based compensation. We believe time-based vesting is appropriate because the Executive COB role is often more advisory in nature, rather than contributing to operational decisions that impact long-term financial performance. There may also be uncertainty associated with the length of the role.
- Equity awards may include a one-time grant or annual grants, depending on the estimated timeframe of the role. Vesting of equity awards is generally in installments over 3 or 4 years or vesting that aligns with the time in the role or the time that the Chair might remain an employee of the company.
- Executive COBs most often participate in the company’s bonus program, using the same corporate performance metrics that apply to the CEO. Individualized metrics are rarely used.
Transition of an Active CEO to an Executive COB Role
When a successful, long-tenured Chairman and CEO begins to plan for retirement, companies may strategically approach the succession process over time. Boards may keep the retiring CEO on as an employee of the company, as Executive COB, for a period of time. This period allows for a smooth succession of responsibilities. It may also mitigate uncertainty about new leadership. It is possible that a Lead Director, outside Board member, or other executive may fill the role of Executive (or Non-Executive) Chair, yet most often the role is filled by a retiring CEO.
Executive Chair Scenarios and Fact Patterns Influencing Compensation:
While pay practices vary, there are considerations to be made as it relates to compensation based on the expected timing that the Chairman role will exist or that the individual incumbent will be in the role. There are some patterns in the compensation structure if the role is shorter or longer- term.
|
Fact Pattern |
Practice |
|
Short Time Period of COB Role (1-year or less) |
|
|
Longer Time Period of COB Role (more than 1-year) |
|
|
Executive COB whot is a Founder/Significant Shareholder |
|
|
Consultant or Special / Senior Advisor |
|
|
Non-Executive COB – Executive COB, outside Director or New Hire transition |
|
Executive COB Role – Short Time Period (1 year or less)
When a CEO transitions to an Executive COB role, planned for a shorter period of time, the CEO often changes roles near the end of the fiscal year or near the annual shareholder meeting. There tends to be minimal adjustment to the base salary or annual incentive target for this period in the role. If the annual equity grant has not been made for the year, companies tend to reduce the value of the equity award and the form of the award may be modified. Companies differ on the treatment of outstanding equity awards. There are two potential scenarios:
- The company may allow outstanding equity to vest normally, according to the plan (retirement vesting if the executive is eligible), or
- The company provides some type of “enhanced-vesting” for the time that the retiring executive serves as chairman
If the transition is made after the annual equity grant, companies tend not to decrease the equity grant amount in the year of the change. Companies should consider which approach is most appropriate given the vesting period that remains, the type of outstanding award (e.g., 10-year option, 3-year performance award), the cumulative value that the COB may receive due to any enhancement, and potential shareholder reaction.
Executive COB Role – Longer Time Period (Greater than 1 year)
When the Executive COB role is expected to be greater than one year, adjustments are made to the level of pay and the forms of compensation used. Overall, base salary and annual incentive targets may be 85% to 95% of the current CEO’s pay levels. Equity may be decreased to 40% of what it was while serving as CEO, resulting in total direct compensation that is 65% and 75% of the compensation of the current CEO.
Equity awards tend to have time based vesting and are commonly not tied to longer term company performance. Vesting schedules may be modified, if necessary, to align with the expected timeframe of the Executive COB’s service. Companies often make annual equity awards, yet those that have clarity around expected timeframes may grant one-time awards intended to cover the entire time in the role.
A related benefit for CEOs in this situation may be the continued vesting of large outstanding equity grants that were received while serving as CEO. When award vesting follows the normal course, shareholders and proxy advisory services firms may view this more favorably than enhanced vesting arrangements that may be provided when the CEO retires sooner.
Non-Executive COB Role
Non-Executive COBs have a smaller time commitment. They tend not to have a specific strategic or operational oversight role, yet they do lead the board of directors. Non-Executive COBs often serve as the primary liaison between the board and the CEO and provide additional leadership and guidance. Most commonly, Non-Executive COBs participate in the regular compensation program for the company’s outside directors and receive a premium. When the premium is added to the regular board compensation, median Non-Executive COB compensation is approximately 1.6x – 1.8x the compensation paid to regular outside directors.
Conclusion
Pay for Executive COBs varies a great deal and depends on a company’s particular situation. However, when specific situations are examined closely, patterns do emerge. For example, our research indicates that a COB who is a founder or significant shareholder tends to get paid more than COBs who are not founders or significant shareholders. We also found that exiting CEOs who transition into a COB role for a short period of time may frequently receive preferable equity vesting treatment. General pay norms will help provide direction, but the responsibilities, time commitment, incumbent’s tenure with the company, ownership status, etc. should all be factored into the compensation program provided.
Case Studies
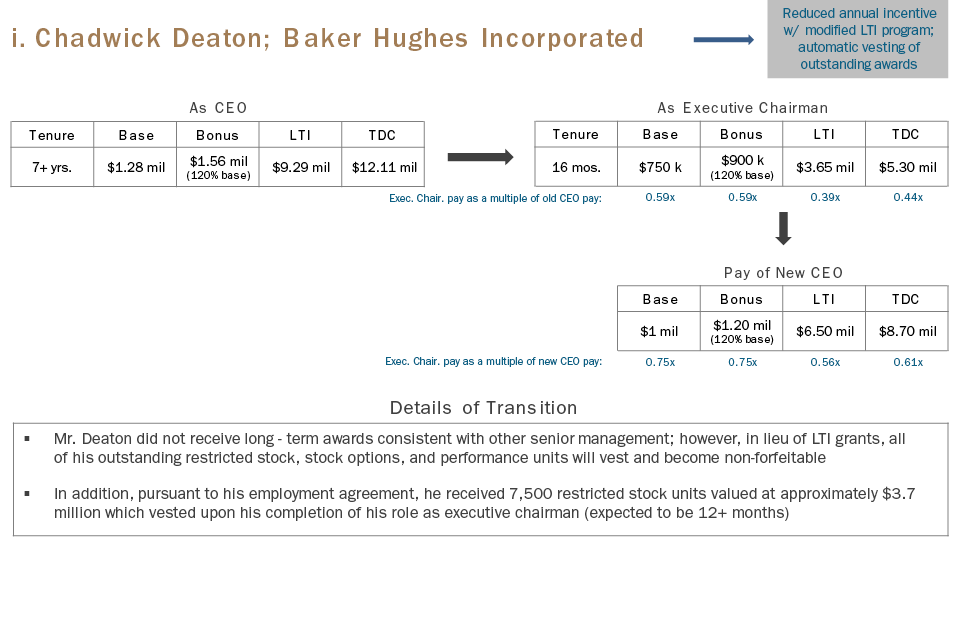
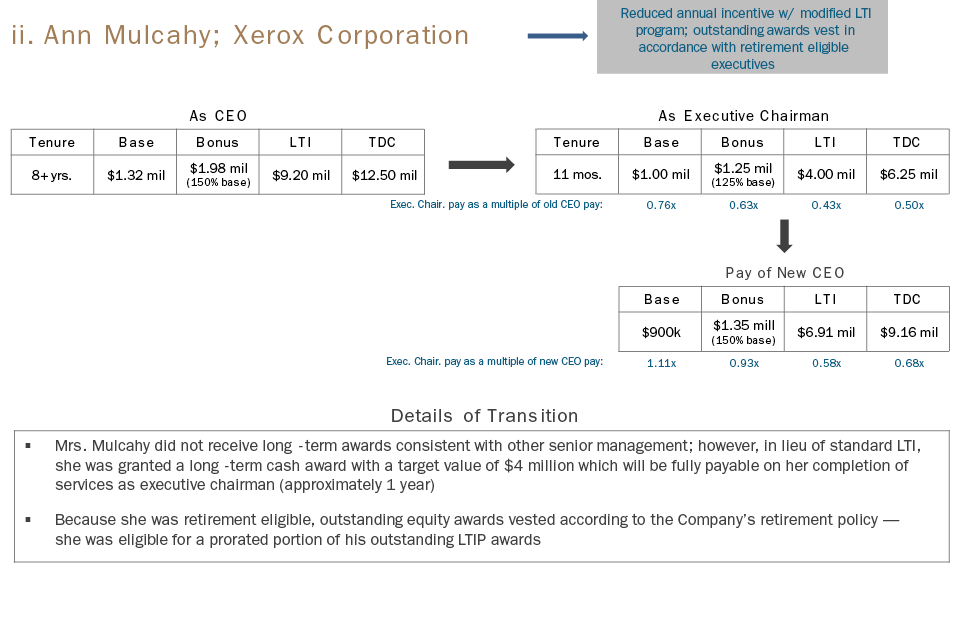
The transition from a private company to a public company is an exciting time for most organizations. For employees, moving from private to public status provides the first opportunity to potentially gain liquidity from equity-based. For venture capital or private equity investors, it typically represents the first opportunity to realize gains from their investment and risk-taking. However, becoming a public company creates new disclosure requirements and opens up compensation programs to scrutiny from a new group of public shareholders and shareholder advisory firms.
Not all newly public companies are the same. In this white paper, we will speak generally about newly public companies, but also address differences that may apply across categories. The categories we most typically see are the following:
- Recent Start-ups: Companies that have been funded primarily by venture capital backers and are in early stages of development
- Often these companies are in the biotech or internet/technology industry and some, in particular in biotech, may be pre-revenue and likely pre-profit when they go public.
- Companies in this category are usually emerging growth companies (revenue less than $1 billion at IPO) under the JOBS act, subject to less stringent disclosure requirements and exempt from Say on Pay votes for up to five years following IPO
- Private Equity Portfolio Companies: More mature businesses that may have been taken private to improve operating performance
- Typically are profitable businesses and trade based on multiples of earnings or EBITDA
- May or may not be “emerging growth companies” under the JOBS act
- Private equity owners may continue to maintain a majority interest following IPO
- Spin-off Companies: Business units of a publicly traded company that become public through a spin-off event
- Spin-off may occur in one stage, an initial IPO and then a spin-off of remaining shares, or a multi-stage sell-down
- In most cases, the spin-offs are mature companies that are viewed as being able to generate more value on their own through greater strategic focus than as part of the parent company
Establishing Public Company Compensation Processes
As a public company, there is an increased requirement for processes governing the company’s compensation decisions. All public companies (other than those controlled by a 50% or greater shareholder) need to have a Compensation Committee of two or more independent directors. The Compensation Committee needs to have a Charter that lays out the responsibilities of the Committee, including its responsibility for overseeing the pay of the CEO and the other executive officers of the company.
In practice, there is a lot of work to set-up a functioning Compensation Committee. Key steps to get a Committee up and running include the following:
- Identify Members: The Board needs to determine which directors have the capabilities and experience to effectively serve on the Compensation Committee;
- Appoint a Chair: The Board needs to identify a Chair for the Committee who can ensure that the Committee operates effectively and meets its responsibilities under the Charter;
- Draft Charter: Company’s counsel needs to draft a Charter outlining the Committee’s responsibilities in compliance with the listing standards of its respective exchange and addresses the expectations of the Board for the Committee;
- Establish Committee Calendar: Human resources needs to work with the Committee Chair to develop a calendar of activities for the year (including the timing and number of Committee meetings) and cross-reference with the Charter to ensure that all responsibilities are addressed;
- Assess Need for External Advisor: The Committee needs to assess whether or not they need an advisor; if they elect to use an advisor, they need to conduct a selection process and assess the independence of the advisor;
- Develop Committee Meeting Process: Establish protocols for the companies interaction with the Committee and preparation for meetings; best practices include the following:
- Provide Committee Chair with a draft agenda for the meeting at least one month in advance of the meeting;
- Review draft materials with the Committee Chair (and Committee advisor) at least 1-2 weeks in advance of the meeting;
- Make materials available to Committee members one week in advance of the meeting;
- Ensure that at least 2 meetings are provided for major decisions; one meeting to review and second meeting to approve; and
- Follow-up with Committee Chair following Executive Session to confirm decisions made in the meeting.
Many companies adopt some of the above practices in advance of going public and this tends to make the transition easier. We find that new Committees have some room to learn as they go; however, the fundamentals of the process should be in place upon going public.
Post-IPO Compensation
In most cases, prior to going public, the compensation program likely was comprised of a relatively modest base salary and annual incentive and significant stock option grants. This approach to compensation is very common for emerging growth companies and private equity-backed companies. Spin-off IPOs may vary from this approach, as they often have relied on the more traditional compensation models of their parent companies. Upon going public, the company may need to rethink its approach to compensation. At the very least, there has to be recognition that employees may have opportunities to recognize significant wealth from past equity grants and the company needs to ensure that the compensation program will be effective in retaining top talent following the IPO. In addition, while the company may have had a relatively small shareholder base to address as a private company, once public, there is a larger group of shareholders and the company needs to make sure that the compensation program of the public company is designed with all shareholders in mind.
Pay Philosophy, Peer Group and Target Pay Levels
For a newly public company, one of the most fundamental compensation decisions is to establish a compensation strategy and pay philosophy. Most companies will want to ensure that the compensation program addresses the following objectives:
- Align executives with shareholders’ interests
- Support achievement of the business strategy
- Pay-for-performance
- Attract and retain required talent
A company’s compensation strategy and design can work to achieve these objectives in a variety of ways and there are tradeoffs among the objectives. For example, compensating executives with equity can serve to align their interests with shareholders; however, executives may place a higher value on cash compensation. Companies will take a variety of approaches based on the relative priority of the different objectives and their views on which compensation design elements best meet the objectives.
As part of the compensation philosophy, while not required, companies will frequently identify a peer group. The peer group is comprised of publicly traded companies and used for pay and/or performance benchmarking. Since one of the primary purposes of the peer group is to assess the competitiveness of pay, a key factor in identifying peers is whether the companies are potential competitors for executive talent. In addition, for external credibility, the peer group should be comprised of companies that are comparable in size (e.g., ~.5x – 2x) your company’s size in terms of revenue and from comparable industries. Ideally, some of the peers will also be newly public companies, though this is less important for more mature companies that are going public.
Most public companies establish a pay philosophy discussing the positioning of target pay levels. The most common pay philosophy statement is along the lines of “our company targets total pay levels at the median of our peer group with variation around median based on individual circumstances.” There is flexibility to have a pay philosophy that targets pay levels above median, but these pay philosophies often attract criticism from shareholders. Alternatively, the company could target below median base salaries and annual incentives and deliver above median long-term incentives. This approach to pay may be more appealing to shareholders, especially with growth companies, with its emphasis on long-term compensation.
Annual Incentive Program
Pre-IPO companies may or may not have a formal annual incentive plan. For some emerging growth companies, there may be a focus on conserving cash and therefore limited cash available for compensation and as a result, the companies may deemphasize annual incentive compensation. In addition, early stage companies in some industries (e.g., biotech, internet) may not have strong income statement performance (e.g., revenue or profitability) and may tie the incentives they pay to the achievement of strategic objectives (e.g., successful clinical trials, product launches, etc.)
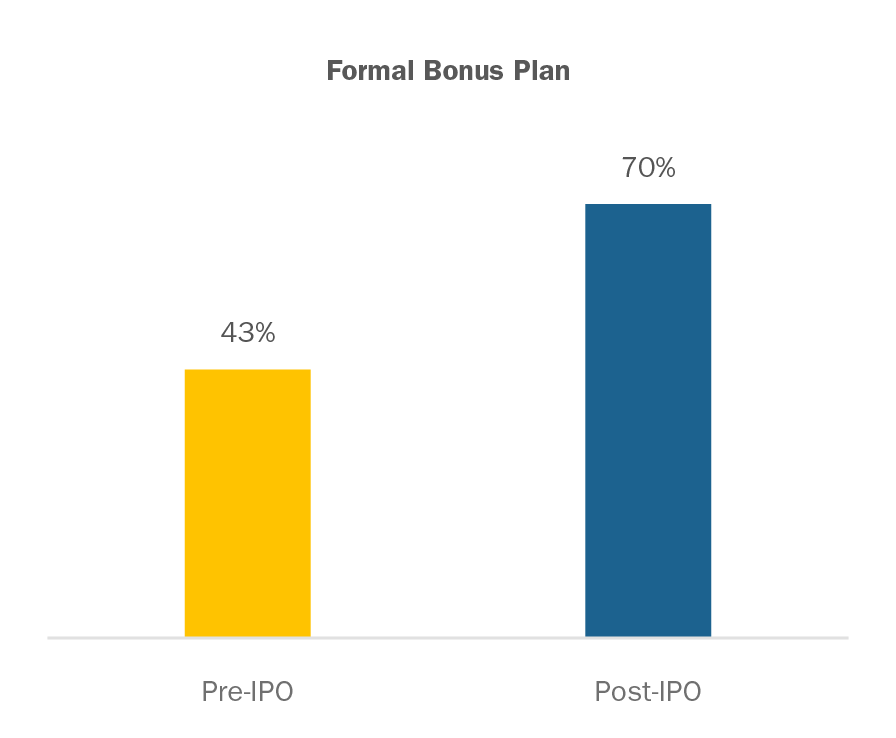
Once companies are public, there are greater expectations from shareholders and shareholder advisory groups that if the company pays an annual incentive, it will be based primarily on the achievement of financial results, with only a small portion based on more qualitative performance criteria. The larger the annual incentive opportunity is as a percentage of total compensation, the greater the expectation that the incentive will be based on financial performance. Shareholders will generally not be happy if a CEO can earn a bonus equal to 50-100 percent of base salary, unless the company has delivered strong financial results. Our analysis of 30 recent IPO’d companies found that 70% have adopted formal bonus plans with quantitative metrics following the IPO.
Note: For both annual and long-term incentives based on the tax code rules (IRC Sec. 162(m), the “performance based compensation” tax exemption for select executive officers), if a company gets an annual and long-term incentive plan approved prior to the IPO and discloses such plan documents in any S-1 filing, the company is exempt from IRC Section 162(m) rules for approximately three years.
Long-term Incentives
Pre-IPO companies typically use stock options as the main long-term incentive vehicle as they tend to closely align the interest of the venture capital or private equity investors. Rather than making annual grants to executives, pre-IPO companies will generally make large up-front grants to lock in on an early (presumably lower) valuation for purposes of determining the exercise price. In many cases, the equity grants are established as a percentage of the company’s common shares outstanding rather than a targeted dollar value. If an executive has served with the company for a number of years prior to the IPO, then it is possible that all or a majority of the stock options that the executive holds are vested by the IPO. This may be a concern for shareholders for potential shareholders and the company needs to demonstrate it has a game plan for locking in the executives post-IPO.
An important first step for the company as it approaches the IPO is to assess whether its existing reserve of shares set aside for grants to employees and directors will be adequate to cover future grants. It is generally preferable to obtain approval of additional shares for future grant prior to the IPO, as the equity plan needs to be approved by shareholders and it is simpler to gain approval from the VC or private equity shareholders than the new public shareholders. We recommend that the equity reserve and overhang (i.e., share reserve plus outstanding awards relative to total shares outstanding) be benchmarked relative to peer practices to ensure that the reserve will not be viewed as excessive by external shareholders, as eventually the company will have to go to public shareholders for purposes of 162(m) compliance and/or additional shares.
In situations where executives’ equity is largely vested by the time of the IPO, the company may use the IPO as an opportunity to “re-up” equity grants to senior executives to “lock them in” for the next few years following the IPO. However, in order to size any grants made at IPO, the company will likely want to rely on competitive market practices for annual grant values among the peer group. In addition, the company may want to consider shifting to an annual grant frequency, as this is the most common equity granting approach among publicly traded companies.
Public companies have moved toward an annual grant frequency for several reasons, including the following:
- Limits the impact of stock price volatility on option values (e.g., lowers the risk that all stock options end up underwater)
- Facilitates compliance with target compensation positioning (i.e., easy to adjust annual compensation to market competitive levels)
- Results in consistent disclosed compensation values over time and tends to be better received by shareholder advisory groups
Over time, larger newly public companies (particularly those with revenue over $1 billion) may be expected to incorporate a long-term incentive vehicle with explicit performance measures into their long-term incentive designs. Institutional Shareholder Services (ISS) expects that 50% of the long-term incentive opportunity be delivered in a performance-based vehicle and they do not view time-vesting stock options as highly performance-based. In practice, newly public companies may have legitimate reasons to delay adopting a performance-based long-term incentive (e.g., limited stock trading history, challenges in forecasting long-term financial performance).
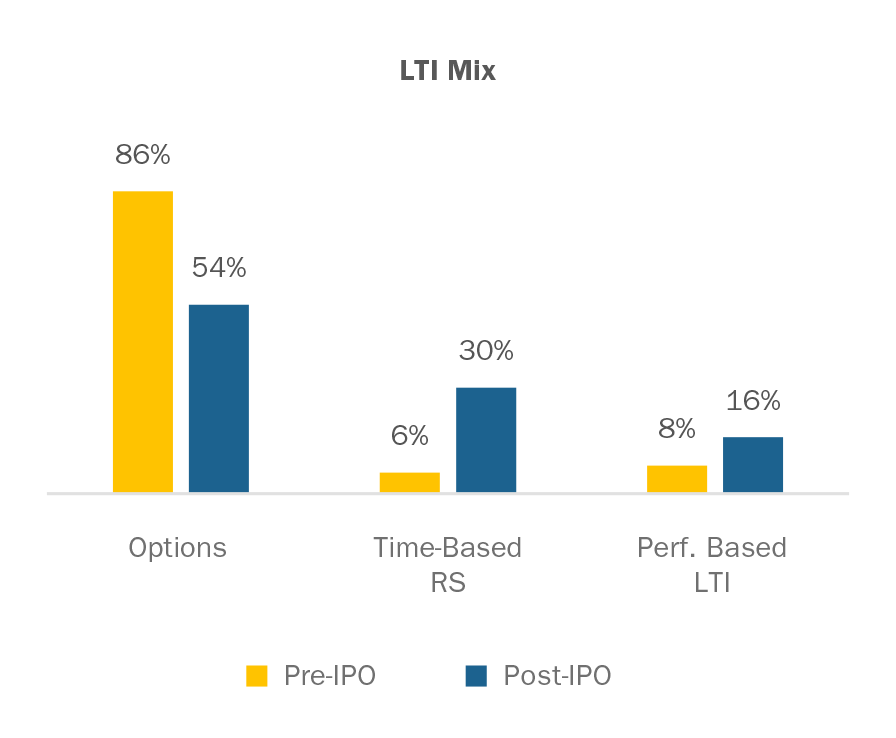
If you decide to adopt a performance-based long-term incentive, the most common design is a performance-share plan. These plans provide for a target opportunity denominated as a number of shares. Performance is typically assessed over a three-year period, with the number of shares earned ranging from a threshold amount (typically 25%-50% of target) to a maximum amount (150%-200% of target) based on an assessment of performance relative to pre-established performance criteria. Plan designs are mixed among measuring performance relative to financial criteria (e.g., EPS, revenue growth), stock price performance (e.g., total shareholder return relative to peers or the broader market), or a combination of financial and stock price performance. Performance share plans are now the single most prevalent form of long-term incentive for executives at large public companies. In our analysis of the post-IPO practices of 30 recent IPOs, we found that the LTI mix for post-IPO grants shifted away from stock options with weight shifted towards time-based restricted stock and performance-based LTI.
Other Compensation Design Features
Severance provisions should be established as part of a formal severance program (change in control or not change in control) or through severance agreements, or less frequently, as part of an employment agreement. These programs should be implemented after careful consideration of potential costs and benefits to the participants, competitive practices for comparable organizations and if the company desires to maintain a formal program. Gross-ups for any 280(g) CIC tax liabilities are no longer common and should not be included. If not already in place, non-compete and non-solicitation provisions should be put in place for the company, as standalone policies or as part of LTI award agreements.
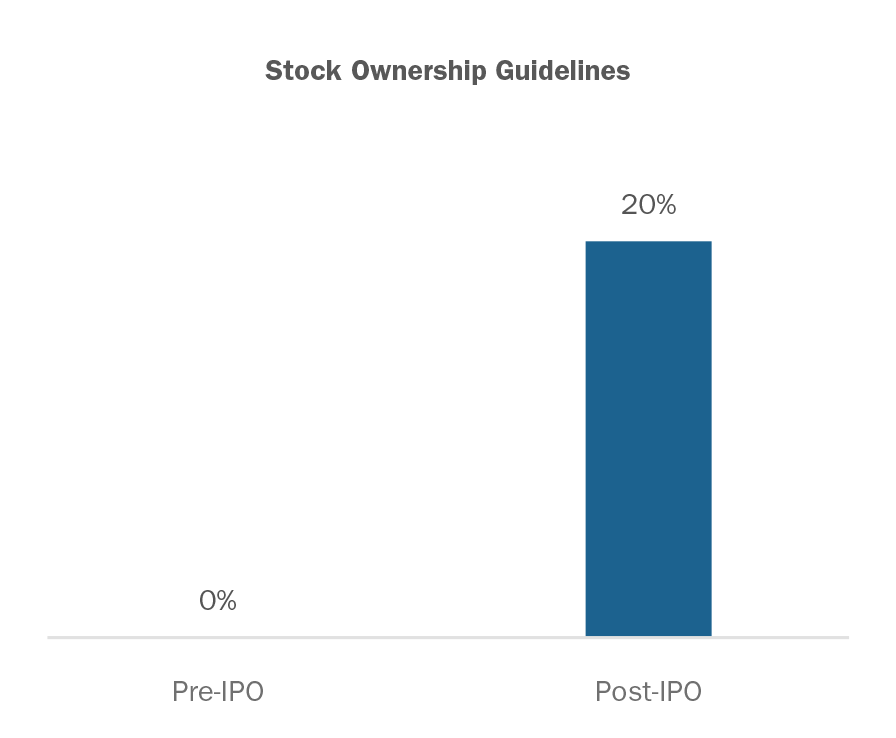
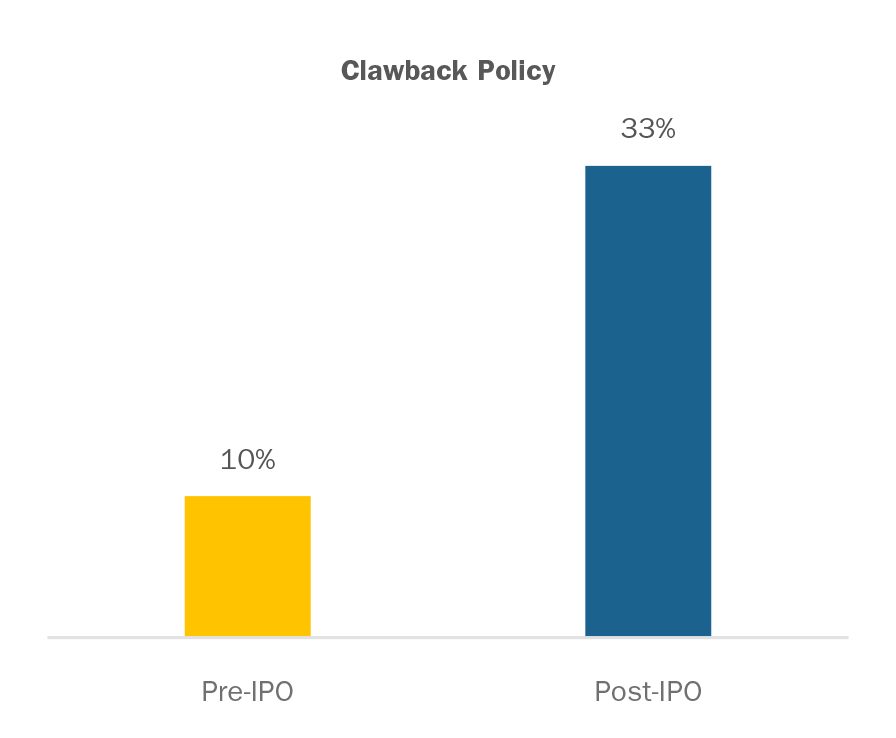
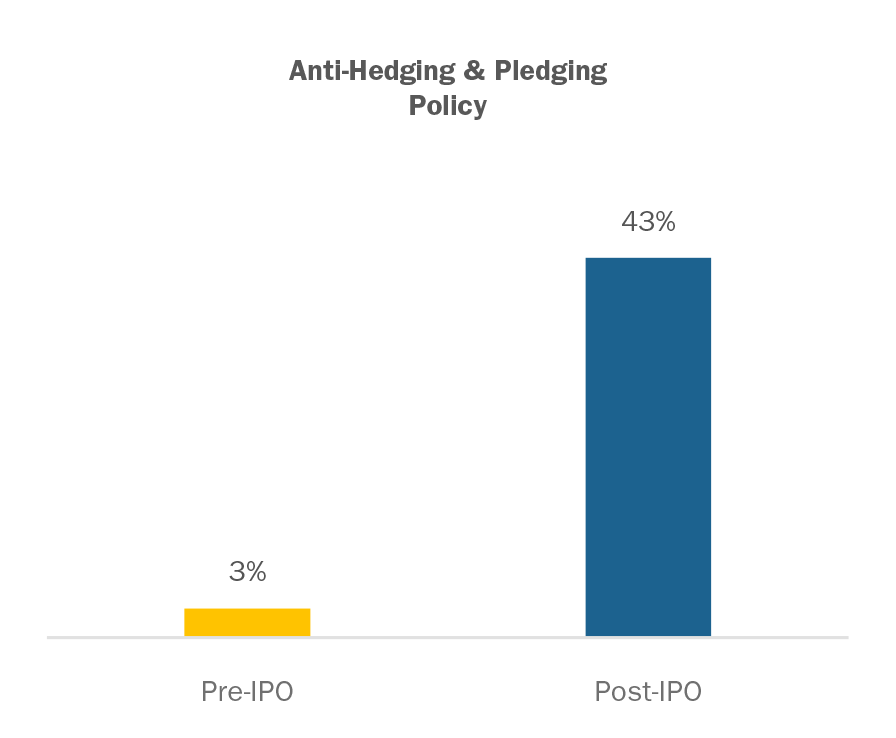
Lastly, other good governance features such as stock ownership guidelines, clawbacks (recoupment policy), and anti-hedging and pledging are considered good practice and are also generally in the best interests shareholders (see data on post-IPO adoption below). How quickly the company adopts these practices depends on how far the company wants to go to be viewed as shareholder friendly.
Conclusions
The IPO is an exciting time for executives and private company shareholders. From a compensation perspective, it is also an exciting time as the company transitions from a model built around an eventual liquidity event to a compensation program that is expected to be maintained over time as a public company. As a public company, the compensation program will be under additional scrutiny and the Compensation Committee will be accountable to a much larger shareholder base. By developing strong compensation governance practices and understanding competitive practices for pay program, Compensation Committees can move forward with confidence that their approach to compensation will meet the strategic needs of the company and stand-up to external scrutiny.
Overall Findings
- Performance: 2015 performance (based on Revenue growth, Pre-tax Income growth, EPS growth and 1-year Total Shareholder Return or TSR) was weaker than 2014 performance.
- CEO Pay: Median CEO pay was up 13% from 2014, driven by significant increases in the grant date value of long-term incentives (LTI) which are typically granted during the beginning of the fiscal year.
- Annual Incentive Payout: At median, annual incentive payouts (as a percentage of target) were lower in 2015 than the prior year. Additionally, there was more variability in payout around target compared to 2014 demonstrating a directional alignment between pay and performance.
- LTI Payout: Performance share plans paid out at target for the 2013-2015 performance period despite strong median 3-year cumulative TSR performance of 56%.
- Disclosure: Companies generally did not make wholesale changes to their proxy statements. Some enhanced their disclosure through the use of charts and graphs to make the proxy statement a communications document for shareholders.
2015 PERFORMANCE
2015 was a year that included an increase in the value of the U.S. dollar, volatility in foreign currency exchange rates and a slowdown in economic growth overseas (particularly in China). These factors contributed to 2015 performance being weaker than 2014 performance. CAP reviewed Revenue growth, Pre-tax Income growth, EPS growth and TSR performance for the Early Filers and the S&P 500. For the measures reviewed, 2015 performance was generally flat (0 – 3% growth) compared to the strong performance of 2014.
|
Financial Metric |
2014 Median 1-year Performance |
2015 Median 1-year Performance |
||
|
S&P 500 |
Early Filers |
S&P 500 |
Early Filers |
|
|
Revenue Growth |
5.6% |
5.7% |
0.8% |
2.4% |
|
Pre-Tax Income Growth |
8.6% |
6.4% |
0.2% |
1.2% |
|
EPS Growth |
10.6% |
10.4% |
2.6% |
3.2% |
|
TSR (1) |
16.3% |
14.1% |
2.3% |
0.3% |
(1) TSR for the S&P 500 is as of September 30, 2014 and September 30, 2015. TSR for Early Filers is as of each company’s fiscal year end.
CEO TOTAL DIRECT COMPENSATION
Among Early Filers with CEOs in their role for at least two years (n=42), 2015 actual total direct compensation increased 13% over 2014 pay levels. 2015 annual incentive payouts were down 3% reflecting weaker financial performance compared to the prior year. LTI grants in 2015, however, were significantly higher than 2014. This finding is likely reflective of the timing of LTI grants (typically in the first quarter of the fiscal year) and companies likely providing larger grants in 2015 because of the strong performance in 2014. Consistent with the expected salary increases, 2015 base salary was 3% higher than 2014.
|
Compensation Element (n=42) |
2014 Median ($000) |
2015 Median ($000) |
% Increase |
|
Base Salary |
$1,000 |
$1,031 |
3.1% |
|
Actual Annual Incentive |
$1,791 |
$1,731 |
-3.4% |
|
Total Cash |
$2,836 |
$2,663 |
-6.1% |
|
Long-Term Incentive (LTI) |
$5,468 |
$6,896 |
26.1% |
|
Total Direct Compensation |
$8,290 |
$9,399 |
13.4% |
INCENTIVE COMPENSATION
Annual Incentive Plan Payout
As mentioned above, actual annual incentive payouts in 2015 were lower than 2014. At median, 2015 payouts were 101% of target vs. 2014 payouts which were 111% of target. At the 25th percentile, 2015 payouts were much lower (76%) than 2014 (99%) but were more in line with 2013 and 2012 payouts which is indicative of a return to more normalized distribution of payouts in 2015.
|
Summary Statistics |
Annual Incentive Payout as a % of Target |
|||
|
2012 |
2013 |
2014 |
2015 |
|
|
75th Percentile |
130% |
127% |
135% |
133% |
|
Median |
100% |
95% |
111% |
101% |
|
25th Percentile |
72% |
75% |
99% |
76% |
As expected, performance was noticeably stronger for companies with an annual incentive payout that was at or above target. Conversely, performance for companies with a payout below target was weaker in 2015. These results are similar to 2014 performance, although TSR was stronger for companies with below target payout in 2014 (+7%) compared to 2015 (-11%).
|
Financial Metric |
2014 Median 1-year Performance |
2015 Median 1-year Performance (1) |
||
|
Below target payout (n=15) |
At or above target payout (n=35) |
Below target payout (n=24) |
At or above target payout (n=24) |
|
|
Revenue Growth |
3.6% |
6.3% |
-4.0% |
7.0% |
|
Pre-Tax Income Growth |
-2.9% |
12.7% |
-7.2% |
11.7% |
|
EPS Growth |
-3.4% |
13.5% |
-2.9% |
13.9% |
|
TSR (2) |
7.2% |
16.0% |
-10.7% |
12.6% |
(1) Excludes 2 companies that had spin-offs during 2015.
(2) TSR for Early Filers is as of each company’s fiscal year end.
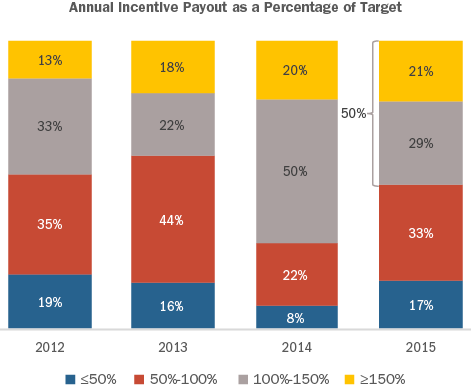
Overall, 50% of companies provided a payout at or above target in 2015 (consistent with 2013 and 2012) which is much lower than 2014 (70% of companies); as a result, there was more variability in payouts relative to target in 2015 than in 2014. Additionally, the number of companies providing a payout between 100 – 150% of target in 2015 is approximately half of what it was in 2014. Interestingly, nearly the same number of companies provided a payout of 150% and above in both 2014 and 2015. Finally, the number of companies not providing an annual incentive payout in 2015 increased (4 companies in 2015 vs. 1 company in 2014).
Long-Term Incentive Plan Payout
Three-year (2013 – 2015) performance was strong among Early Filers and the S&P 500. Cumulative Revenue growth was 11% (or 4% per year) for both Early Filers and the S&P 500. Cumulative EPS growth was very strong (21%) for the S&P 500 and more modest (11%) for the Early Filers. Overall, companies in both groups had significant stock price appreciation over the three-year period; 3-year cumulative TSR was 48% for the S&P 500 and 56% for the Early Filers.
|
Financial Metric |
Median 3-year Cumulative Performance |
|
|
S&P 500 |
All Early Filers (1) (n=42) |
|
|
Revenue Growth |
10.9% |
11.0% |
|
Pre-Tax Income Growth |
15.6% |
12.1% |
|
EPS Growth |
21.3% |
10.9% |
|
TSR (2) |
48.0% |
55.7% |
(1) Reflects only those companies with a performance share plan.
(2) TSR for the S&P 500 is as of September 30, 2015. TSR for Early Filers is as of each company’s fiscal year end.
Despite strong TSR performance over the three-year period, and even with 60% of companies using Relative TSR as a performance metric, median LTI payout was around target (98%). Median LTI payout for companies that use Relative TSR was slightly below target (95%); however, a majority of these companies (60%) use TSR in conjunction with other financial metrics.
|
Summary Statistics |
LTI Payout as a % of Target |
|
|
All Early Filers (n=42) |
Early Filers with TSR as a Metric (n=26) |
|
|
75th Percentile |
128% |
119% |
|
Median |
98% |
95% |
|
25th Percentile |
54% |
54% |
PROXY STATEMENT DISCLOSURE CHANGES
Since Say on Pay was adopted in 2011, companies have incorporated many new features to make their proxy statement a communications document for shareholders by including a proxy summary, an executive summary in the CD&A and highlighting good governance practices, just to name a few. While Early Filers generally did not make wholesale changes to their proxy statement in 2016, some companies enhanced their disclosure with additional charts and graphs. Some examples include:
- Deere & Co, which has annual incentive performance goals that can vary depending upon the company’s sales volume, added a graph to explain the performance goals, actual results and how each related to the actual sales volume achieved;
- Jabil Circuit, Jacobs Engineering Group and TE Connectivity added a list of corporate governance best practices (i.e., “what we do and what we do not do”);
- Starbucks added a picture describing their shareholder outreach process and topics discussed with shareholders.
We would expect that companies will have more significant changes to the proxy statement as more rules under Dodd-Frank (e.g., pay ratio and pay vs. performance) are finalized and implemented.
CONCLUSION
2015 was not as strong of a performance year as 2014. Given weaker 2015 performance, annual incentive payouts declined from 2014 levels resulting in a directional alignment between pay and performance. 2016 is already shaping up to be an interesting year given recent declines in stock price, currency fluctuations and overall uncertainty given the U.S. Presidential election. Many companies will be making their annual equity grants at depressed stock prices, so we may potentially see a year over year decline in LTI grant values particularly for those companies that grant awards based on a fixed number of shares. From an executive compensation perspective, we expect that the SEC will come out with final rules for the clawback, hedging and pay vs. performance in October 2016 which could have an impact on 2017 and 2018 disclosure.
We believe Mr. Fink raises an important point on linking incentives to business strategy. A clearly communicated business strategy would help to avoid pitfalls that we see frequently today. These include incentives that are designed primarily to respond to pressure from proxy advisory firms, often driving a “one size – fits all” approach or encouraging short-term thinking.
“We are asking that every CEO lay out for shareholders each year a strategic framework for long-term value creation. Additionally, because boards have a critical role to play in strategic planning, we believe CEOs should explicitly affirm that their boards have reviewed those plans. BlackRock’s corporate governance team, in their engagement with companies, will be looking for this framework and board review.”
Larry Fink, BlackRock CEO
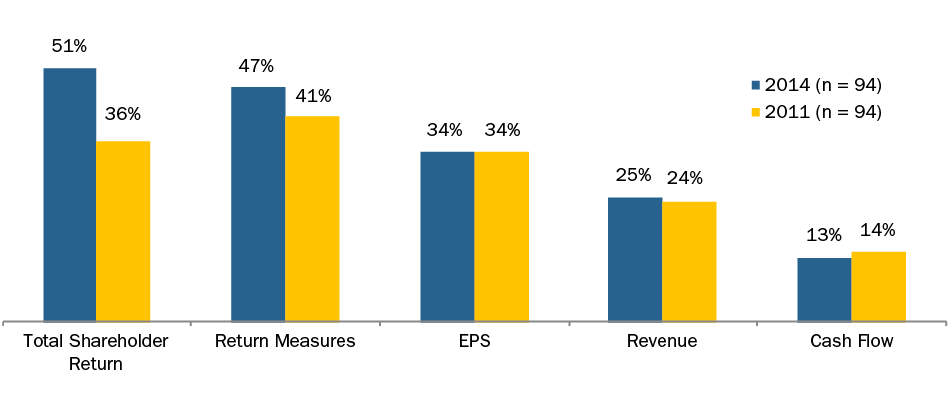
As highlighted by our articles Are You Rewarding Short-Termism? in The Corporate Board and Balancing pay for performance with shareholder alignment in the Ethical Boardroom, it is important that compensation, in particular long-term incentive compensation, links directly to the company’s strategy. We agree that providing shareholders with a voice on compensation programs through Say on Pay has been beneficial, but we have observed a chilling effect on creative compensation programs. Today most public companies are very reluctant to be an outlier on compensation. If we look at CAP’s sample of 100 large market cap companies, 51% use Total Shareholder Return (TSR) and 34% use EPS as metrics in their long-term incentive plans. Are these universal metrics appropriate in almost any situation? We question that premise. Why do so many companies have similar metrics when they have unique business strategies, operate in diverse industries and are positioned at different points in their lifecycle?
The good news is that we have observed modest increases in the use of return metrics, from 41% in 2011 to 47% in 2014 (e.g., return on assets, return on capital and return on equity). In several cases, activist investors have intervened to champion the adoption of return metrics. Traditional institutional investors with concerns over the effectiveness of corporate business strategies have also been vocal in encouraging companies to focus on returns. Both camps frequently push companies to move to adopt balanced metrics that encourage profitability in combination with growth as opposed to growth alone.
The chart below provides a snapshot of how long-term incentive plan metrics have evolved over time. Use of TSR has grown most since 2011, from 36% to 51% and this is after dramatic increases prior to 2011. We believe this is the direct outcome of the influence of proxy advisory firms, who have pushed hard on companies to incorporate relative TSR in their programs. The good news is that since 2011, the number of companies relying on a single metric has declined, with over 1/3 of companies using 3 or more metrics which may indicate they are tailoring plans more to their specific situation.
|
# of Metrics |
2011 |
2014 |
|
1 |
33% |
26% |
|
2 |
40% |
37% |
|
3 or More |
27% |
37% |
While EPS and TSR may make sense for many companies, companies should consider various factors when selecting measures, including:
- Is relative TSR the best answer for your company? We see it as an outcome-oriented metric that lacks a clear linkage to strategic priorities and is not well suited to driving behaviors that create shareholder value.
- Does over-reliance on TSR encourage risk-taking behaviors? Companies may make decisions that drive TSR in the short-term (e.g., share buybacks or higher dividends), rather than identifying better uses of capital that can lead to sustained long-term growth.
- Does an EPS metric create an incentive to buy back shares rather than re-investing for growth? Financial experts have mixed views on the utility of share buybacks. The jury is still out.
- Are the current time horizons for TSR performance optimal? Almost all plans measure TSR over 3 years. Why is a 3-year time frame the default for most companies? Since TSR is usually defined as a relative metric, eliminating the need to set goals in advance, should companies be evaluating longer timeframes that align with their business cycles?
- If relative TSR is your company’s metric, where are you in the cycle? Companies and boards need to ask and analyze whether relative TSR goals will pay out for sustained long-term stock price appreciation or for volatility in relative stock price performance. Companies and boards need to understand whether the stock is only recovering from earlier losses that occurred prior to the start of the performance period.
We don’t believe that either EPS or TSR are inherently poor metrics. In many cases, it makes sense for companies to incorporate these metrics into their overall incentive framework. However, it is critical to determine if these metrics are right for a particular company at a -particular time in its life cycle. Keep in mind that long-term incentives are the largest component of pay for many executives. As companies and boards design long-term incentives, they should consider the following questions:
- Does the compensation program support our strategy and do the metrics and goals align with our long-term business plan?
- Can we communicate clearly and succinctly how the program ties to our strategic framework for both shareholders and program participants?
- What behaviors, good or bad, could the design encourage? For example:
- Does it send clear signals throughout the organization on the strategic priorities?
- Is short-term upside emphasized at the expense of long-term sustained value?
- Do we encourage growth at the expense of returns that exceed our cost of capital?
- Does the program encourage excessive or inappropriate risk-taking?
- For metrics other than TSR, will achievement of goals lead to company and shareholder value creation?
- Are there alternative metrics, including strategic metrics (e.g., increase in market share, diversification of revenue, etc.) that might be better indicators of successful execution of the strategy?
Overall, we think Mr. Fink’s commentary on the importance of defining and communicating a company’s strategic framework for value creation serve shareholders well. His comments point to a fundamental principle of compensation design: incentive compensation should be used to reward the company’s success in achieving its strategy and creating long-term value for shareholders. The performance measures used to determine incentive compensation need to track progress on the strategy over the near term and over the long-term. We believe we will see a migration in this direction as long-term incentives evolve, companies continue to dialogue with their shareholders and perhaps as they enhance disclosure around their strategic framework as Mr. Fink suggests.
HIGHLIGHTS
- Most large public companies have maintained consistent approaches to delivering annual incentives to their executive leadership teams.
- We frequently see minor adjustments to annual incentive plan designs — most often modifying performance measures – rather than wholesale change.
- Most companies use multiple measures to ensure the annual incentive plan provides balance and aligns with overall business strategy.
- Median CEO annual target bonuses increased 10 percentage points to 170% of salary in 2014.
- In contrast, CFO annual target bonuses remained the same at 100% of salary.
- Overall, 2014 annual incentive payouts were slightly lower than in 2013.
CHANGES IN ANNUAL INCENTIVE PLAN DESIGN
32% of companies in CAP’s database changed their annual incentive plan design in 2014 or 2015. The most common changes were modifications to the performance metrics used to fund awards and increases to the target award opportunities offered to the CEO or CFO. Another common change was to adjust the weightings/mix applicable to performance metrics. These changes, as well as other modifications shown in the chart below, illustrate that companies continue to review and enhance the pay-for-performance relationship through changes to the annual incentive program.
|
Type of Change Reported in CD&A |
2014 No. of Cos. |
% of Cos. Reporting Changes |
||
|
2014 (n = 32) |
2013 (n = 34) |
2012 (n = 37) |
||
|
Change in performance metrics used to fund awards |
16 |
50% |
47% |
43% |
|
Increased/Reduced target award opportunities (CEO and/or CFO) |
12 |
38% |
32% |
11% |
|
Change in performance metric weighting/mix |
5 |
16% |
32% |
35% |
|
Change in maximum award payout |
4 |
13% |
9% |
8% |
|
Other changes |
3 |
9% |
12% |
22% |
Note: Due to multiple changes, does not add up to 100%.
Modifications to Performance Metrics
Among the companies that changed the performance metrics used for annual incentives, the most common approaches were to either maintain the same number of metrics or reduce the number of metrics. This avoids adding complexity to annual incentive while allowing for better alignment of pay with performance:
- Six (6) companies kept the total number of metrics the same, but replaced a metric;
- Six (6) companies reduced the number of metrics; and
- Four (4) companies added metrics to the current plan.
Changes made by many companies were done so to better align incentives with their business strategy:
- Bristol-Myers Squibb: Added a new pipeline metric as a measure to highlight the importance of pipeline delivery to the near-term and long-term success of the company.
- Intel: Moved from a single set of company-wide operational goals to business-unit-specific operational goals – significantly reducing the number of performance goals, in order to drive a sharper focus on key strategic initiatives, increase visibility into those initiatives, and enhance accountability.
- Verizon Communications: Consistent with Verizon’s strategic plan, adjusted the weightings of the financial measures from 2013 to place a greater emphasis on free cash flow, given the importance of cash generation and debt reduction following the acquisition of sole ownership of Verizon Wireless. In addition, a sustainability measure was introduced, reflecting Verizon’s commitment to reducing the environmental impact of its operations.
Increases in Target Bonus Opportunity
CAP’s database tracks the size of target annual bonus awards for both CEOs and CFOs. When we looked across all industries in 2014, we found that the median target bonus opportunity increased for CEOs by 10 percentage points to 170% of salary. By industry, the largest increase we saw was in Automotive, where CEO target bonus awards increased by 15 percentage points. Significantly, none of our industry groups registered a decline in CEO target annual bonuses, although Financial Services do not typically define target bonuses.
When we looked across all industries at CFO target bonus opportunities, we saw no change year-over-year. The median target bonus for CFOs remained the same at 100% of salary. By industry, Technology CFOs saw the greatest increase (25 percentage points). Across other industries, median target CEO/CFO bonus increases were generally between 0 and 10 percentage points. Similar to the CEO data, no industry group saw a decline in CFO annual bonus targets.
|
Industry |
Median Target Bonus as a % of Salary |
|||
|
CEO |
CFO |
|||
|
2014 |
2013 |
2014 |
2013 |
|
|
Automotive |
150% |
135% |
95% |
85% |
|
Consumer Goods |
165% |
160% |
100% |
93% |
|
Financial Services |
n/m |
n/m |
n/m |
n/m |
|
Health Care |
150% |
150% |
100% |
100% |
|
Insurance |
210% |
200% |
125% |
120% |
|
Manufacturing |
153% |
147% |
90% |
88% |
|
Pharmaceutical |
150% |
150% |
100% |
98% |
|
Retail |
200% |
200% |
125% |
125% |
|
Technology |
220% |
210% |
150% |
125% |
|
Total Sample |
170% |
160% |
100% |
100% |
Note: Companies among all industries that did not disclose target bonus opportunities were excluded from both the 2013 and 2014 target bonus analysis. Financial Services industry is excluded since most companies in our study do not disclose target bonus opportunities for the Named Executive Officers.
ANNUAL INCENTIVE PLAN DESIGN PRACTICES
Award Leverage
CAP reviewed proxy disclosure to understand how companies are establishing the payout range (i.e., the threshold payout and the maximum payout expressed as a percentage of the target payout) for annual incentives. Most companies that we reviewed identify the minimum payout as zero and do not separately disclose a threshold level of performance. For the 37 companies that did disclose a threshold bonus payout, a payout of 50% of target is the most common percentage. Twenty companies, however, disclose a minimum bonus payout of less than 50% of target which scales down to 25% or lower.
Approximately 75% of companies disclose the maximum bonus opportunity. A majority of companies in our sample (60%) have a maximum bonus opportunity of 200% of target bonus. Ten (10) companies have a maximum bonus of 250% of target or higher. Most of these companies are in the Consumer Goods, Pharmaceutical, and Technology industries.
|
Threshold Payout as a % of Target (n = 37) |
||
|
Range |
# of Cos. |
% of Cos. |
|
< 25% |
10 |
27% |
|
> 25% < 50% |
10 |
27% |
|
50% |
13 |
35% |
|
> 75% < 100% |
4 |
11% |
|
Maximum Payout as a % of Target (n = 73) |
||
|
Range |
# of Cos. |
% of Cos. |
|
> 125% < 150% |
2 |
3% |
|
> 150% < 200% |
14 |
19% |
|
200% |
44 |
60% |
|
> 200% < 250% |
3 |
4% |
|
> 250% |
10 |
14% |
Annual Incentive Plan Metrics
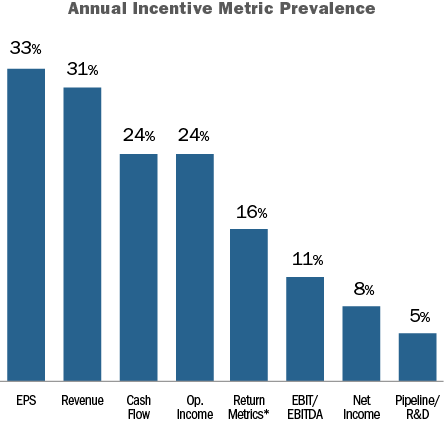
EPS, Revenue, Cash Flow and Operating Income are the most common metrics used in annual incentive plans. Similar to last year, our findings suggest that EPS is used more broadly across industries while Revenue tends to be used in consumer-driven industries.
Most companies use multiple performance metrics in the annual incentive plan. 33% of companies disclose using two (2) metrics, 31% use three (3) metrics, and 16% use four (4) or more metrics.
The use of multiple performance metrics allows for annual incentive payouts to be tied more closely to overall company performance. For example, companies using bottom-line measures in the annual incentive plan will often also include top-line measures for balance. Among CAP’s sample, 36% of “multiple-metric” companies that use a measure of profit (EPS, Operating Income, etc.) also use Revenue.
In addition to financial measures, approximately 15% of companies disclose using non-financial measures in their annual incentive plans such as talent, culture, and diversity initiatives. 55% of companies disclose that individual performance considerations impact annual incentive payouts.
*Return metrics include: ROE, ROA, and ROI/ROIC.
The chart below shows the three (3) most common metrics by industry in 2014:
|
Industry |
Metric #1 |
Metric #2 |
Metric #3 |
|
Automotive |
Cash Flow (45%) |
EBIT (45%) |
ROA (27%) |
|
Consumer Goods |
Revenue (67%) |
EPS (58%) |
Cash Flow (33%) |
|
Financial Services |
EPS (33%) |
ROE (17%) |
Op. Income (8%) |
|
Health Care |
EPS (40%) |
Op. Income (30%) |
EBIT (30%) |
|
Insurance |
Op. Income (46%) |
Op. ROE (23%) |
Op. EPS (15%) |
|
Manufacturing |
Cash Flow (30%) |
EPS (30%) |
Revenue (20%) |
|
Pharmaceuticals |
Revenue (70%) |
EPS (70%) |
Pipeline/R&D (50%) |
|
Retail |
Revenue (40%) |
Op. Income (40%) |
EBIT (30%) |
|
Technology |
Revenue (58%) |
Cash Flow (50%) |
Op. Income (33%) |
Note: Percentages reflect the prevalence of companies disclosing the metric.
2014 Actual Bonus Payouts
Nearly all companies (94%) awarded bonuses to their CEO for 2014 performance. Three companies did not pay a bonus to the CEO as a result of company performance: Coca-Cola, McDonalds, and Target.
Overall, the median CEO bonus payout was 114% of target (or 225% of salary, at median). Across industries, bonuses for Pharmaceutical CEOs exceeded target by the greatest amount (146% of target, at median). 3 of the 9 industries CAP surveyed had a median bonus payout of less than 100%: Retail (82%), Consumer Goods (92%), and Technology (95%).
|
Industry |
Bonus Payout at a Percent of Target |
|||||
|
75th Percentile |
Median |
25th Percentile |
||||
|
2014 |
2013 |
2014 |
2013 |
2014 |
2013 |
|
|
Automotive |
146% |
183% |
122% |
165% |
103% |
120% |
|
Consumer Goods |
148% |
133% |
92% |
112% |
33% |
70% |
|
Financial Services |
124% |
142% |
112% |
126% |
97% |
102% |
|
Health Care |
149% |
149% |
124% |
127% |
108% |
116% |
|
Insurance |
139% |
170% |
132% |
150% |
110% |
123% |
|
Manufacturing |
155% |
119% |
115% |
111% |
98% |
98% |
|
Pharmaceutical |
173% |
158% |
146% |
138% |
118% |
122% |
|
Retail |
100% |
119% |
82% |
78% |
75% |
68% |
|
Technology |
127% |
121% |
95% |
88% |
86% |
69% |
|
Total Sample |
145% |
150% |
114% |
122% |
95% |
95% |
Note: Most companies in the Financial Services industry do not disclose a target bonus for the CEO. For these companies, 3-year average actual bonus was used as a proxy for target bonus.
Conclusion
In our experience, most companies strive to achieve the following with regard to annual incentive plan design:
- Alignment with the company’s business plan
- A balanced portfolio of performance metrics
- An appropriate mix of corporate versus business unit / strategic performance considerations
- The proper amount of structured discretion and/or individual performance
These objectives can be achieved by continuing to assess plan design in relation to strategy and making minor modifications, such as changes to performance metrics and their weightings, as necessary. Short of a major economic shift or regulatory change, we expect to see only modest changes to annual incentive plan designs.
In our experience, “activist investors” were more vocal and influential in boardrooms during 2015 than during other recent years. As a result, Compensation Advisory Partners (“CAP”) analyzed circumstances at nine companies that had proxy contests in 20151 where in each case, one area of activist focus was executive compensation. We found that executive compensation issues were often supportive and complimentary to other, larger internal issues at the target companies. While these activists may have targeted executive compensation, this was not the main driver in engaging with the company. Activist complaints tend be more focused on strategic/financial issues and they use compensation as a point of discussion to identify where their views differ. For example, if return on capital is not a utilized metric in incentive plans and the company has completed several low return acquisitions, the activist may use this as support that strategy is flawed and that compensation reinforces that flaw.
“Activist investors” are individuals (i.e. hedge fund managers) or groups (i.e. alternative investment companies) who purchase a stake in a target company’s outstanding equity shares with the end-goal of influencing company decision making by acquiring seats on the Board of Directors. Once on the Board, activists will try to effect changes (i.e., by divesting or acquiring a business segment, cutting expenses, increasing distributions to shareholders, etc.) that ultimately increase the company’s value and the value of the activist’s investment.
What We Found
Compared to prior years, 2015 saw an increase in proxy contests. Among companies in the Russell 3000 Index, there were 20 proxy contests initiated by activist investors during 2015. This compares to 14 proxy contests in 2014 and 16 in 2013.
Of the 20 proxy contests initiated by activist investors in 2015, nine (45 percent) specifically took issue with the executive compensation program at the target company. In each case, “issues” with executive compensation were a part of the supporting statements for the dissident slate of directors. This is a stark contrast to 2014 and 2013, where 4 (29 percent) and 1 (6 percent) proxy contests took issue with executive compensation, respectively.
Specific compensation practices highlighted in 2015 include:
|
Executive Compensation Issue |
Number of Companies (n=9) |
Percentage of Companies |
|
Pay for Performance Misalignment |
7 |
78% |
|
High CEO Compensation |
4 |
44% |
|
Choice of / Adjustments to Performance Metrics |
4 |
44% |
|
Weak Corporate Governance Structure |
3 |
33% |
|
High / Increase to Board of Director Compensation |
3 |
33% |
|
Awards of Special Grants to Executives |
2 |
22% |
|
Outsized Peers |
1 |
11% |
Ultimately, we found that activist investors frequently use executive compensation and pay for performance disconnect as levers to bolster their argument for receiving seats on the target company’s Board of Directors.
Target Companies
Of the nine activist campaigns which specifically took issue with executive compensation practices, the companies that were being targeted generally had lagging TSR performance, both in absolute terms and relative to competitors. Further, low Say on Pay results in 2014 also provided activists with an additional reason for targeting certain companies.
As the below table demonstrates, where activists were successful in securing Board seats, the most recent Say on Pay support was generally low and either the company’s 1-year TSR, 3-year TSR, or both were relatively low.
Successful Activist Campaigns
Of the nine proxy contests that specifically targeted aspects of executive compensation, four ultimately resulted in the activist investor gaining Board seats at the target company. The four companies, which are noted in the chart below, include: Myers Industries, Imation Corp., The Children’s Place2 and Shutterfly, Inc.
The main common denominator, from a compensation perspective, among the successful activist campaigns was a perceived disconnect between executive pay and financial performance at the target company. More specifically, at Myers, Imation and The Children’s Place, the activists were able to show that, despite poor TSR (in both absolute and relative terms), the executives at these companies were still being rewarded either through salary increases, above target annual incentive payouts or equity grants.
|
Company Name |
Say on Pay Results |
Total Shareholder Return |
|||
|
2013 |
2014 |
2015 (Year of Proxy Contest) |
1 Year * |
3 Year CAGR * |
|
|
Activist Gained Board Seat (n=4) |
|||||
|
Myers Industries Inc. |
75% |
75% |
60% |
-17.8% |
12.6% |
|
Imation Corp. |
95% |
50% |
34% |
-17.8% |
-12.9% |
|
The Children's Place, Inc. |
17% |
61% |
94% |
13.8% |
6.3% |
|
Shutterfly, Inc. |
55% |
50% |
22% |
-18.3% |
22.4% |
|
Activist Did Not Gain Board Seat (n=5) |
|||||
|
Hill International, Inc. |
n/a (triennial) |
54% |
n/a (triennial) |
-0.3% |
-9.3% |
|
Ethan Allen Interiors Inc. |
86% |
92% |
80% |
-14.1% |
5.1% |
|
E. I. du Pont de Nemours and Company |
95% |
98% |
96% |
14.4% |
17.3% |
|
Biglari Holdings Inc. |
33% |
31% |
50% |
-21.7% |
2.8% |
|
Select Comfort Corporation |
98% |
93% |
96% |
26.9% |
6.7% |
* As of Fiscal Year End
Further, with regard to Shutterfly’s executive compensation program, activists made the case that executives were being rewarded for performance against metrics that were not “shareholder friendly” (i.e. metrics focusing on top line growth as opposed to earnings growth). In response to the activist criticism, Shutterfly’s Compensation Committee established several changes to their 2015 and 2016 executive compensation program performance targets to “further reflect shareholders views”. However, the lead activist investor (Marathon Partners) ultimately deemed these changes inadequate and requested further, more fundamental, adjustments to the entirety of the compensation program, namely, to begin prioritizing profit over scale.
It is not surprising that activist investors are most successful at winning Board seats at their target companies when they can tie executive compensation to the poor financial performance of the company. If shareholders are not realizing a desired return on their investment in any given company, it is reasonable to expect that they would show more support for an activist investor hoping to gain access to the target’s Board if it could potentially lead to financial improvement. When executive compensation can be tied to poor financial results, it simply provides activists, and shareholders alike, with another reason as to why a shift in leadership could be desirable or change in strategy could be advisable (e.g. CEO change).
ISS also tends to influence the outcome of these proxy contests. ISS supported at least one of the nominees on the dissident slate of directors at each of the four companies that lost at least one Board seat to the activist investor.
Ultimately, of the four companies who lost Board seats to activist investors, three companies (Imation Corp., Myers Industry and Shutterfly) have made changes to their executive leadership teams as these CEOs have stepped down. Further, while DuPont was able to win its proxy contest and keep dissident nominees off of its Board, five months after the Annual Meeting, the CEO announced her retirement.
Conclusion
We are seeing increased activity where activist investors are accumulating stakes in companies with the intention of agitating for change. Their hope is to make changes that will enhance the company’s value. While our analysis reflected proxy contests specifically focusing on executive pay (e.g. pay for performance misalignment), there are a number of circumstances where companies settle with the activist investors, avoiding a contentious public battle, and allow the activist a seat or multiple seats on the Board. Some examples include Baxter International settling with Third Point LLC, Freeport McMoRan settling with Icahn Enterprises and Citrix Systems settling with Elliott Management.
In order to be well positioned, Boards and Compensation Committees should be proactive:
- Ensure the Company and Board have a clear strategic focus and stick to it
- Make sure the metrics used in incentive plans align with the company’s strategic vision
- Confirm the Board has a game plan for shareholder and activist engagement
- Encourage the Company and Board to use external advisors to provide guidance
- Highlight company performance against goals
- Emphasize pay for performance relationship through the validation of relative performance and pay positioning
- Proactively seek feedback from shareholders throughout the year
- Assess program features which may not have a lot of value to executives but are viewed as problematic pay practices (i.e., eliminate excise tax gross-up, eliminate / reduce perquisites, move from single to double trigger equity vesting in the event of a change in control)
It is critical for the Board to work with management to ensure pay practices are defensible and supportable in light of company performance and good governance standards.
Appendix
Summary of Activist Campaigns
|
Company |
Activist |
Executive Compensation Issue Highlighted By Activist |
Contest Result |
|
Hill International, Inc. Program and project management company |
Bulldog Investors, LLC ISS supported both dissident director nominees |
|
No dissident nominees elected to the Board |
|
Ethan Allen Interiors International interior design and manufacturing company |
Sandell Asset Management Corp ISS supported 3 of 6 dissident director nominees |
|
No dissident nominees elected to the Board |
|
E.I. Du Pont International science and technology company |
Trian Fund Management ISS supported 2 of 4 dissident director nominees |
|
No dissident nominees elected to the Board CEO stepped down 5 months after the conclusion of the contest |
|
Biglari Holdings Owns and operates Steak N’ Shake |
Groveland Capital ISS did not support dissident director nominees |
|
No dissident nominees elected to the Board |
|
Myers Industries International manufacturing and distribution company |
GAMCO Asset Management ISS supported 1 of 3 dissident director nominees |
|
Three dissident nominees elected to the Board CEO stepped down |
|
Imation Corp. Data storage and information security company |
Clinton Group ISS supported all dissident director nominees |
|
Three dissident nominees elected to the Board CEO stepped down |
|
Select Comfort Corporation Designer, manufacturer, retailer and services of a Sleep Number beds |
Blue Clay Capital ISS did not support dissident director nominees |
|
Activist dropped proxy contest before it went to shareholder vote |
|
The Children’s Place (settled proxy fights prior to Annual Meeting) Children’s specialty apparel retailer |
Macellum Advisors GP and Barington Capital Group ISS supported 1 of 2 dissident director nominees |
|
Settled prior to contest – activist received one Board seat |
|
Shutterfly, Inc. Manufacturer and retailer of photo-based products |
Marathon Partners ISS supported 2 of 3 dissident director nominees |
|
Two dissident nominees elected to the Board CEO stepped down |
Note: The comments in the above chart are paraphrased or direct quotes from activist investors’ proxy contest materials/filings and do not reflect the view of CAP.
ISS released their finalized 2016 policy changes, which are consistent with the proposed changes previously announced. The changes are relatively minor and the key changes are related to
- Director Overboarding
- Negative director election vote recommendations for directors that have taken unilateral board actions
- Proxy Access
- Compensation-related votes at externally-managed issuers and Shareholder Proposals related to equity retention
- Shareholder Proposals: Hold Equity Past Retirement or for a Significant Period of Time
The changes are as follows:
- Director Overboarding
- Previously, ISS recommended an “Against” or “Withhold” for a director if the director sits on more than 6 public company boards or 2 public company boards for the CEO (besides their own for CEOs)
- ISS changed the threshold to 5 for a regular board member and made no changes for CEOs, though they did propose reducing the CEO threshold to 1 in the draft guidelines
- This change will be in effect for meetings on or after Feb. 1, 2017
- Negative director election vote recommendations for directors that have taken unilateral board actions
- ISS clarified that it will generally issue “Against” vote recommendations for directors, committee members or entire board for bylaws amendments, without shareholder approval, calling to classify the board or introducing supermajority vote requirements (policy will also apply if directors amended the bylaws immediately prior to an IPO)
- Negative vote recommendations will be issued until the unilateral reduction is reversed or approved by a shareholders vote
- Proxy Access
- ISS clarified current policy that vote recommendations for directors nominated using proxy access will be evaluated using similar criteria to those used in proxy contests
- Compensation-related votes at externally-managed issuers
- ISS will generally recommend “Against” say-on-pay proposals if there is insufficient disclosure for ISS to perform a comprehensive pay-for-performance analysis [limited situations and often impacts externally managed issuers like REITs]
- Sharholder Proposals: Hold Equity Past Retirement or for a Significant Period of Time
- ISS has broadened the policy to encompass executive retention proposals more generally, eliminating the need for a separate policy covering the proposals seeking retention of 75% of net shares
- The proposed retention ratio and required duration of retention are just some of the several factors that ISS will consider in its case-by-case analysis
For further details on the updated policies for 2016, please visit https://www.issgovernance.com/file/policy/2016-americas-policy-updates.pdf