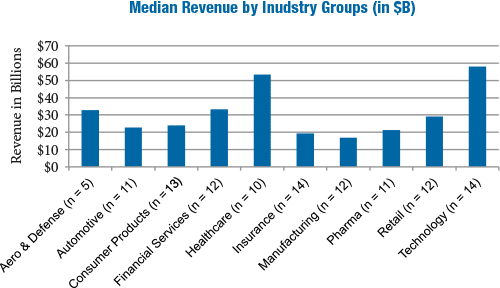
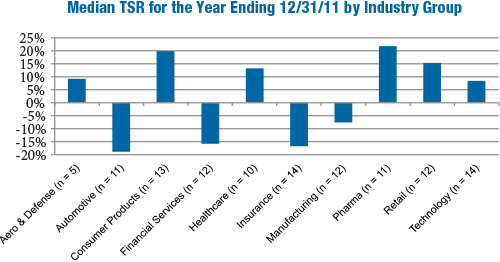
For the 114 company sample, median revenue was $30B, median market capitalization was $29B and median Total Shareholder Return (TSR) was 3% for 2011. As indicated in the charts below, significant variations in company size and performance occur by industry.
What We Found
During 2011, companies continued to make refinements to their executive compensation programs to improve the alignment between pay and performance. Compensation opportunities improved during 2011, as many companies in our sample resumed modest salary increases to the Named Executive Officers (“NEOs”), paid annual incentives for 2011 performance that were above target on average, and continued to shift long-term incentive opportunities into more performance-based vehicles.
Compensation Strategy
Compensation Strategy Changes
A few companies (7%) disclosed making changes to their compensation strategy in 2011. Of the eight companies that disclosed changes, five companies lowered their target pay positioning to be at median of the market (vs. above median) due, in part, to increasing scrutiny from shareholders and proxy advisory firms:
- Allstate: In 2010, the company targeted pay levels between 50th and 75th percentiles of the market. In 2011, Allstate received shareholder feedback that pay should not be targeted above the 50th percentile and, therefore, the company reduced its benchmark target to the median
- Amgen: Significantly reduced the grant value of regular annual LTI equity awards by lowering the benchmarking target by 25 percentage points to the median of the peer group to be responsive to stockholders
Two companies changed the mix between fixed and variable pay; Lincoln National and Prudential Financial increased the portion of total compensation based on variable pay.
Compensation Philosophy
66% of companies in our study disclosed their desired competitive pay positioning for the NEOs. Among these companies, approximately 60% target total direct compensation at median. Pay positioning varies among the industry groups. More companies in the Consumer Goods and Technology industries targeted total compensation above median (60% and 67%, respectively), while companies in the Manufacturing and Pharmaceutical industries tend to target pay at median (88% and 80%, respectively).
Pay Mix
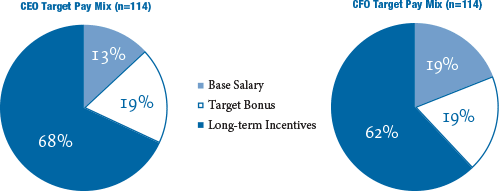
The target pay mix for CEOs includes a higher percentage of total pay in the form of long-term incentives, averaging 68% across industries. In contrast, the average CFO’s pay mix was composed of 62% in long-term incentives. This disclosed pay mix varies by industry with the Technology industry providing the highest proportion of CEO total compensation (75%) in long-term incentives.
Peer Groups Used For Benchmarking
In 2011, 30% of companies disclosed changes to their peer groups used to benchmark senior executive compensation levels. Many companies refined the peer group to better reflect their size and industry focus. More frequent peer group changes were due to, in part, greater shareholder scrutiny resulting from Say on Pay votes. We suspect that Institutional Shareholder Services’ (ISS) new approach to peer group development for their CEO pay-for-performance assessment also had an impact.
Approximately 50% of companies decreased the number of comparator companies in their peer group while 30% of companies increased the size of the peer group and 20% disclosed changes to their peer group but did not indicate an increase or decrease in the number of peer companies.
Base Salary Actions
As the economy continues its slow rebound, we found that more companies provided salary increases for senior executives. 47% of companies in our sample provided a salary increase for their CEO, while a majority of companies (78%) provided a salary increase for their CFO. Companies in the Automotive, Consumer Goods and Pharmaceutical industries were more likely to provide a salary increase to the CEO compared to the other industries reviewed. Companies typically cited the desire to provide a competitive merit increase (generally ranging from 3 – 5%) as the rationale. When companies provided salary increases above this range, market salary adjustments (40% of companies) and promotional increases (15% of companies) were often cited as the reasons.
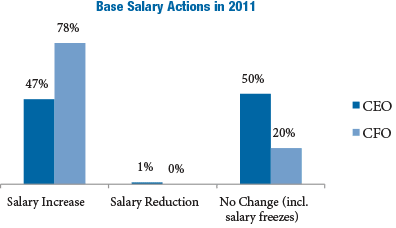
Note: Does not include new CEOs or CFOs hired in 2011. Therefore, percentages do not add up to 100%
Annual Incentive Plan Design
Nearly 40% of companies disclosed annual incentive plan design changes in 2011 or planned changes for 2012. Changes to the annual incentive plan were varied but most often reflected a refinement to enhance the pay for performance alignment and/or support the business strategy. Of companies that made changes to their annual incentive plan, 42% made changes to plan metrics that determine funding. 28% of companies increased the annual incentive target opportunity for the CEO and/or CFO to remain competitive with market practice.
The chart below presents the reported AIP changes:
|
% of Cos. Reporting Changes |
|||
|
Type of Change Reported in CD&A |
No. of Cos. |
2011 (n = 43) |
2010 (n = 57) |
|
Change in performance metrics used to fund awards |
18 |
42% |
33% |
|
Increased target award opportunities |
12 |
28% |
26% |
|
Change in performance metric weighting/mix |
9 |
21% |
18% |
|
Change in maximum award payout |
5 |
12% |
4% |
|
Added risk-based metrics |
2 |
5% |
n/a |
|
Other changes |
8 |
19% |
16% |
Note: Percentages do not add up to 100% due to multiple responses.
Change in Performance Metrics
Half of the companies that made changes to annual incentive plan metrics incorporated additional metrics to their plans in 2011/2012. Four companies reduced the number of metrics to focus executives on key criteria most aligned with the business strategy.
Three companies incorporated strategic measures to their annual incentive plan in addition to the financial metrics:
- Eli Lilly: Added achievement in new product pipeline milestones as an incentive plan metric
- Lowe’s Cos: Added the completion of three strategic incentives as additional performance goals
- Visteon: In addition to profitable growth, cash flow and quality, the 2012 annual incentive award will also be based on the accomplishment of key strategic actions
In 2011, two companies, Bank of New York Mellon and Manulife Financial, added risk-based adjustments to the annual incentive plan payouts, reinforcing the objective of minimizing any potential risk-related behavior that could have an adverse impact on the company.
Annual Incentive Plan Metrics
Revenue, EPS, operating income and cash flow were the most commonly used annual incentive plan metrics across all industry groups in 2011. Industries such as Insurance and Pharmaceutical tend to have industry specific metrics (e.g., Operating Income/EPS in the Insurance industry and Pipeline/R&D Development in the Pharmaceutical industry). Customer-focused industries (e.g., Consumer Goods, Pharmaceuticals, Retail and Technology) were more likely to have Revenue as an annual incentive metric.
The three most prevalent metrics for each industry group are detailed below:
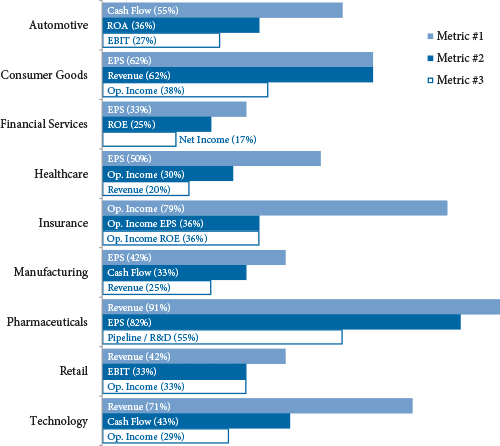
Note: Excludes Aerospace and Defense due to limited sample size (n = 5).
2011 Bonus Payout Details
Similar to last year, 96% of companies paid a bonus to NEOs for 2011 performance. A majority of companies (80%) used financial goals to determine annual incentive payouts and approximately 15% have a plan that provides a payout based on some degree of Compensation Committee or Board discretion. At median, CEOs received a payout that was 130% of target in 2011 (compared with 135% in 2010). In the Insurance and Technology industries, the median CEO payout approximated target suggesting performance was near the budget/plan for the companies in our review. Bonus payouts for the CEO’s in the Aerospace and Defense, Automotive, Manufacturing and Pharmaceuticals industries were generally 145 – 160% of target, likely reflecting stronger than expected performance in 2011.
All companies that paid a bonus in 2011 provided all or a portion of the award in the form of cash. 11% required executives to defer a portion of the annual incentive payout, with most of these companies deferring the payout in full value shares (e.g., restricted stock, restricted stock units, etc.) and one company, Morgan Stanley, providing a deferred cash payout. Approximately half of companies with mandatory deferrals are in the Financial Services industry, where it is more common for incentive pay (annual and long-term) to be deferred for a longer time period (i.e., at least 3 years).
Long-Term Incentive Plan Design
50% of companies made a change to their long-term incentive (“LTI”) plan design in 2011 or for 2012. 46% of these companies changed the LTI vehicle mix with a majority providing a greater emphasis on performance-based equity. Approximately 40% of companies eliminated and/or added LTI vehicles to their program. Companies were more likely to eliminate stock options or time-based restricted stock and add a performance share plan. The table below outlines the reported changes:
|
% of Cos. Reporting Changes |
|||
|
Type of Change Reported in CD&A |
No. of Cos. |
2011 (n = 57) |
2010 (n = 77) |
|
Changed mix of LTI award vehicles |
26 |
46% |
26% |
|
Added or eliminated LTI vehicle |
22 |
39% |
29% |
|
Changed long-term performance metric |
12 |
21% |
31% |
|
Changed LTI award opportunity level |
10 |
18% |
18% |
|
Changed performance plan comparison/peer group |
4 |
7% |
n/a |
|
Other |
13 |
23% |
22% |
Note: Percentages do not add up to 100% due to multiple responses.
Long-Term Incentive Prevalence
The prevalence of performance-based equity increased slightly in 2011 and the use of stock options and time-based restricted stock remained relatively flat. Further, companies continue to provide a larger portion of LTI in performance-based incentive vehicles.
Below is the breakdown of overall LTI vehicle prevalence for NEOs in 2009-2011:
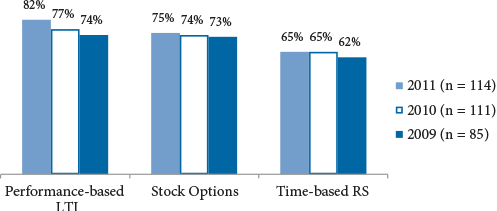
Note: Percentages do not add up to 100% due to multiple responses.
Companies use a balanced approach in delivering the executive LTI program. Nearly 55% of companies deliver LTI in the form of two vehicles and 35% use three vehicles.
Long-Term Award Mix
A majority of companies that made changes to the LTI program shifted a greater portion of LTI to performance-based awards.
|
% of Cos. Reporting Changes |
|||
|
Type of Change Reported in CD&A |
No. of Cos. |
2011 (n = 26) |
2010 (n = 20) |
|
Greater emphasis on performance-based awards |
17 |
65% |
60% |
|
Reduced emphasis on stock options |
11 |
42% |
35% |
|
Reduced emphasis on time-based restricted stock |
12 |
46% |
25% |
|
Other |
6 |
23% |
25% |
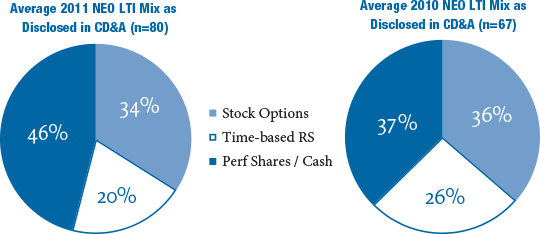
Of the 80 companies that disclosed a targeted LTI mix for 2011, the average CEO LTI mix included 46% in the form of performance shares or performance cash vs. 37% in 2010. The portion of LTI delivered in restricted stock decreased from 26% to 20% in 2011, a further reflection of the shift towards performance-based equity. The percentage of LTI in the form of stock options remained relatively flat year-over-year.
Performance-Based LTI Metrics
For companies that have a performance-based LTI plan, 36% use TSR and 34% use EPS, the most prevalent metrics used. More companies use absolute performance metrics than relative metrics. All companies using TSR disclose using it as a relative metric (vs. absolute) compared to a peer group or broader index.
The chart below displays the prevalence of LTI metrics for performance-based awards in 2011 and 2010:
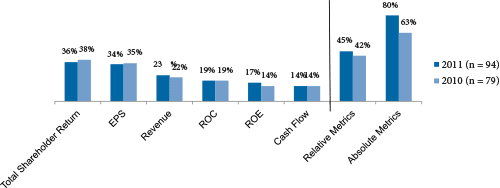
Note: Percentages do not add up to 100% due to multiple responses.
Treatment of Dividend Equivalents
49% of companies provide dividend equivalents on time-based restricted stock awards and approximately 30% do so for performance share awards. Of these companies, most pay dividends when shares are vested or earned (71% and 88%, respectively).
Conclusions
Companies are continuing to make changes to their compensation philosophy, primarily through targeting a more moderate (median) market pay position and making refinements to the peer group used for benchmarking. As the economy continues to slowly rebound, a strong majority of companies gave salary increases to NEOs in the past year. And as shareholders and shareholder advisory groups have an increasingly stronger voice in the compensation arena, companies are making notable program modifications that strengthen the pay and performance alignment, through refining annual incentive metrics or delivering more LTI in the form of performance-based awards.
- §953, §955: Rules regarding disclosure of pay-for-performance, pay ratios, and hedging by employees and directors
- §954: Rules regarding recovery of executive compensation (clawback policies)
- Previously, the SEC had planned on proposing rules for these provisions between January and June 2012 and to finalize rules between July and December of 2012
Conclusion
Elimination of the timeline reflects the delays in SEC rule-making. As a result, we expect that these provisions will not apply during the 2013 proxy season and there is significant uncertainty about when rules will be proposed. This would push implementation of the pay-for-performance and pay ratio disclosure aspects of Dodd-Frank to the 2014 proxy season. The timing delay is due, in part, to other more pressing regulatory issues (e.g., the JOBS Act).
2013 will still be a busy year for both management and Compensation Committees due to Dodd-Frank. We expect annual Say on Pay (Dodd-Frank §951) votes to continue to demand significant attention. In addition, Committee and advisor independence standards (Dodd-Frank §952) were recently issued by the SEC and we should soon see listing standards governing independence proposed by the major exchanges.
Please contact us at (212) 921-9350 if you have any questions about the issues discussed above or would like to discuss your own executive compensation issues. You can access our website at www.capartners.com for more information on executive compensation.
Our findings, summarized below, indicate that overall, increases in pay levels for both CFOs and CEOs have moved from double-digit figures in the 2009-2010 period to single-digit figures in the 2010-2011 period, suggesting pay actions that are more reflective of a stabilizing economy. Pay increases in both periods were higher for CFOs compared to CEOs, driven by higher increases in short-term compensation. On an absolute basis, CFO pay continues to be approximately one-third of CEO pay.
Study Results
Salaries
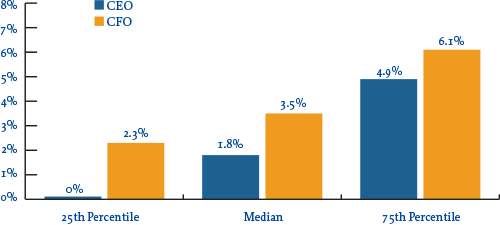
In 2011, 88% of CFOs received salary increases at a rate of 3.5% at median and 6.1% at the 75th percentile. In comparison, only 66% of CEOs received salary increases at lower levels (1.8% at median and 4.9% at the 75th percentile). The prevalence of salary increases for both CFOs and CEOs rose year-over-year, from 75% to 88% (CFOs) and from 56% to 66% (CEOs).
Salary Increase Prevalence |
||||
| 2009 – 2010 | 2010 – 2011 | |||
| No Increase | Increase | No Increase | Increase | |
| CEO |
43.8% |
56.3% |
34.4% |
65.6% |
| CFO |
25.0% |
75.0% |
12.5% |
87.5% |
2011 Salary Increases
Actual Pay Levels
Overall, actual total direct compensation (salary plus actual annual incentive plus the present value of long-term incentives) for both CFOs and CEOs continued to increase but at much lower rates in the 2010-2011 period compared to 2009-2010, as illustrated in the chart below. These lower, single-digit increases in pay levels are indicative of a stabilizing economy. The salary and actual bonus increase levels themselves continued to be higher for CFOs in the 2010-2011 period than for CEOs. Long-term incentives proved to be the biggest driver of pay increases from 2010 to 2011, however, rising by 10% for both CEOs and CFOs.
Median Percentage Change in Pay Components |
||||
| Pay Components | 2009 – 2010 | 2010 – 2011 | ||
| CEO | CFO | CEO | CFO | |
| Salary |
1.0% |
3.7% |
1.8% |
3.5% |
| Actual Bonus |
19.0% |
22.7% |
0.0% |
3.5% |
| Long-Term Incentives |
10.1% |
14.8% |
10.0% |
10.3% |
| Actual Total Direct Comp. |
14.4% |
20.0% |
3.6% |
7.5% |
Financial Performance (Median Levels) |
|||
| Year | Total Shareholder Return (as of 12/31) | 1-Year Revenue Growth | 1-Year Net Income Growth |
| 2009 |
31% |
-9% |
-7% |
| 2010 |
24% |
10% |
19% |
| 2011 |
5% |
9% |
13% |
While movement in pay among CFOs and CEOs was directionally similar, absolute CFO total direct compensation levels, on average, have been approximately 30% of CEO total direct compensation levels over the last three years.
Target Pay Mix
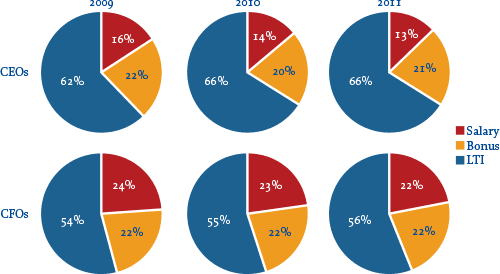
In terms of target compensation levels, the overall pay mix remained largely unchanged from 2009 to 2011, with a greater emphasis on at-risk pay for CEOs than for CFOs.
Long-Term Incentive (LTI) Vehicle Prevalence and Mix
The majority of companies continue to award LTI to both CEOs and CFOs using at least two incentive vehicles. The role of stock options has declined in the overall mix companies use to deliver LTI. And on average, performance-based LTI now comprises approximately 50% of LTI for CEOs and CFOs, an increase of approximately 10% over the past three years. Data shows 80% of CFOs and 85% of CEOs received some form of performance-based awards as part of their LTI program in 2011.
Number of LTI Vehicles Used in 2011 |
||
| % in Total | ||
| CEO | CFO | |
| 1 |
20% |
18% |
| 2 |
46% |
44% |
| 3 |
31% |
34% |
| Average |
2 |
2 |
LTI Mix |
||||||
| 2009 | 2010 | 2011 | ||||
| CEO | CFO | CEO | CFO | CEO | CFO | |
| Stock Options |
40% |
41% |
33% |
30% |
32% |
32% |
| Time Vested Restricted Stock |
19% |
21% |
20% |
23% |
17% |
22% |
| Perf. Based LTI |
40% |
38% |
48% |
47% |
51% |
46% |
Conclusion
In the last three years, trends in CFO pay have been directionally aligned with trends in CEO pay. While the rates of increases were higher for CFO’s 3 years ago, and have started to moderate compared to earlier years, trends for both positions indicate a pronounced linkage to performance, particularly through the long term incentive program.
While volatility in the economy may be stabilizing somewhat, we expect the performance linkages to remain strong for these two key positions. With the continued emphasis at the executive and board level on strong financial skills, talent and acumen, companies will continue to pay competitively for those in the CFO role.
- In addition to the five factors (listed later) that must be considered when assessing a compensation adviser’s independence originally included in the Dodd-Frank legislation and the proposed rules, the committee must also consider any relationships the adviser may have with an executive officer (proposed rules only required assessment of relationships with committee members)
- The proposed rules only addressed the independence of the members of the Compensation Committee; however, the final rules also specify that the requirements apply to all Board members who are acting in a fashion similar to the Compensation Committee
- This may be of particular relevance when significant compensation decisions are made by the full board. Companies will need to be cognizant of what Directors may or may not vote on specific compensation issues.
Timing for Implementation
The new rules and amendments will take effect 30 days after publication in the Federal Register. The stock exchanges have 90 days from the date the rules are effective to propose listing standards and one year from the date of effectiveness to have final rules in place. In addition, companies must be in compliance with the new required disclosure regarding the use of a compensation consultant (including whether the work of the compensation consultant has raised any conflicts of interest and if so, how the conflict is being addressed) for the proxy material for any annual meeting at which directors are elected on or after January 1, 2013.
In the section below, we provide a brief summary of highlights of the adopted rules.
Committee Independence
The listing standards must require that each member of a company’s compensation committee be independent. The definition of independent is left to each of the exchanges to define, but needs to consider relevant factors, including:
- A director’s source of income, including any compensatory arrangement with the company
- Whether a director is affiliated with the company or any related entity
The rules do provide the exchanges flexibility to exempt particular relationships from the independence requirement, as deemed appropriate by the exchanges, if warranted by relevant factors (e.g., size of company).
Compensation Advisers
The final regulations also direct the exchanges to establish listing standards related to compensation advisers (e.g., consultants, legal counsel, etc.), they specify the following:
- Each compensation committee must have the authority, in its sole discretion, to obtain the advice of compensation advisers
- Before selecting any compensation adviser, the compensation committee must take into consideration specific factors identified by the Commission that affect the independence of compensation advisers, though there are no specific thresholds or tests specified. The six factors are:
- Does the adviser’s firm provide any other services to the company
- The fees received by the adviser as a percent of the adviser’s total revenue
- The policies and procedures the adviser firm has in place to prevent conflicts of interest
- Any business or personal relationship between an advisor and the compensation committee
- Whether the adviser owns stock in the company
- Any business or personal relationship between the adviser and executive officers
- The compensation committee must be directly responsible for the appointment, compensation and oversight of the work of the advisers
- Sufficient funding must be provided to pay the adviser
Note the rules do not limit the exchanges from adding additional criteria to the assessment of adviser independence. It is also worth pointing out that the adopted rules do not require Committee’s to use an independent adviser, but only to assess the independence of the adviser. The adopted rules also clarify that in using the advice of in-house legal counsel, the Committee does not have to consider the independence factors.
Disclosure of Consultant Independence and Conflicts of Interest
As mentioned earlier, for any consultant that played a role in determining or recommending the amount or form of executive and director compensation and whose work has raised any conflict of interest, the companies will be required to disclose the nature of the conflict of interest and what the company did to address the conflict. This disclosure does not eliminate any of the currently required disclosure regarding executive compensation consultants (e.g., identify consultant, state whether consultant was engaged directly by the compensation committee, describe the nature and scope of the engagement and instructions given to the consultant, and fee disclosure if the consultant provided additional fees greater than $120,000)
Conclusion
The adopted rules adhere closely to the original language of the Dodd-Frank legislation and to the proposed rules. The next step in the process of implementation will be in the exchanges’ development of the listing standards. The adopted rules provide the exchanges with a good degree of flexibility in how they will define independence and the factors to consider in assessing independence. It will be interesting to see if they do much beyond what is laid out in the adopted rules to clarify the rules.
Say on Pay Update
2012 marks the second year of mandatory Say on Pay voting. In 2011, the SEC issued final rules implementing Section 951 of the Dodd-Frank Wall Street Reform and Consumer Protection Act (“Dodd-Frank”). Dodd-Frank provides shareholders of US public companies with the right to cast three types of advisory votes related to executive compensation:
- A vote to approve the compensation of the Named Executive Officers (NEOs), effective for shareholder meetings occurring on or after January 21, 2011;
- A vote on the frequency with which shareholders should be entitled to cast Say on Pay votes (every one, two or three years), effective for shareholder meetings occurring on or after January 21, 2011; and
- A vote on golden parachute arrangements for NEOs related to a sale, consolidation or merger, effective April 25, 2011.
CAP Comment: While these votes are non-binding, we see evidence that companies carefully evaluate their vote results, taking some action if there is low shareholder support for the company’s executive compensation program. In 2011, a consensus developed that a low pass rate was a concern.
Say on Pay Vote Results Among the S+P 500
So far this season, Say on Pay resolutions received majority shareholder support at all but seven S&P 500 companies.1 The seven companies where a majority of shareholders did not support the executive compensation program were International Game Technology, Citigroup, Cooper Industries PLC, Mylan, NRG Energy, Pitney Bowes and Simon Property Group.
Comparison of year-to-date results for 2012 to 2011 results shows a consistent pattern. We found that the median vote in support of a Say on Pay resolution is 93.7% s in 2012. This is almost identical to the 93.2% median support level that we observed last year.
2011 and 2012 Say on Pay Vote Results
|
% in Favor |
# of Companies in 2012 |
% of Companies in 2012 |
% of Companies in 2011 |
|
90% – 100% |
200 |
69% |
63% |
|
80% – 90% |
42 |
14% |
17% |
|
70% – 80% |
17 |
6% |
10% |
|
50% – 70% |
26 |
9% |
9% |
|
0% – 50% |
7 |
2% |
2% |
CAP Comment: While a company does not “fail” its Say on Pay vote unless a majority of shareholders vote against the compensation program, most companies have received 90+% shareholder support and an “acceptable” shareholder support threshold has emerged around 70% – 80%. ISS identified 70% as a minimum acceptable level of support, while Glass Lewis prefers 75%. Among institutions, CalSTRS and Black Rock identified 75% and 80%, respectively.
Notably, all of the S&P 500 companies that failed Say on Pay in 2011 that have completed their 2012 Say on Pay votes, have received passing grades from shareholders. Some of these companies have made significant changes to pay programs. In addition, management teams at these companies have devoted considerable effort to shareholder outreach and engagement to better understand the issues that may be creating concerns.
|
Company |
% Support Received in 2012 Say on Pay Vote |
Modifications Made to Compensation Program |
|
Hewlett-Packard |
77% |
|
|
Jacobs Engineering |
96% |
|
|
Masco Corp. |
95% |
|
|
Stanley Black & Decker |
93% |
|
CAP Comment: SEC disclosure rules require additional disclosure in the CD&A regarding whether, and if so how, companies have considered the results of the most recent Say on Pay vote.
Several factors impact Say on Pay Voting results. We have observed a clear link between voting outcomes and company performance as measured by Total Shareholder Return (“TSR”). Not surprisingly, companies that enjoy high levels of shareholder support tend to perform better. Companies with lower performance tend to receive lower shareholder support.
TSR vs. Say on Pay Vote Results
|
% in Favor |
Average 1-Yr TSR @ 12/31/11 Prior to 2012 Annual Meetings |
Average 1-Yr TSR @ 12/31/10 Prior to 2011 Annual Meetings |
|
90% – 100% |
3.4% |
24.5% |
|
80% – 90% |
-5.3% |
24.1% |
|
70% – 80% |
-7.6% |
17.3% |
|
50% – 70% |
-5.8% |
8.0% |
|
0% – 50% |
-5.9% |
9.6% |
The recommendations of the proxy advisory services also have an impact. For example, when ISS recommends an “Against” vote on Say on Pay, the voting outcome is normally low. To date in 2012, we found that companies receiving a “For” recommendation from ISS had average shareholder support of 93%. In contrast, companies receiving an “Against” recommendation from ISS had average shareholder support of only 60%.
Among companies where ISS recommended “Against” the Say on Pay proposal, 93% received less than 80% support.
|
Companies Receiving “Against” Vote Recommendation |
||
|
% in Favor |
# of Companies |
% of Companies |
|
90% – 100% |
0 |
0% |
|
80% – 90% |
3 |
7% |
|
< 80% |
38 |
93% |
Given the growing influence of the proxy advisory firms, more and more companies are pushing back. Many companies have been proactive during this proxy season, with more than 50 firms filing supplementary soliciting materials. Prominent examples include Qualcom and Disney. Companies provide additional soliciting material to rebut the vote recommendations of the proxy advisory firms. While the supplemental materials do not impact the recommendation of the proxy advisory firms, they are positive in terms of investor outreach. Arguments over the appropriateness of peer groups selected by the proxy advisory firms are relatively common. In addition, a number of companies have adopted the proxy summary concept to direct attention to key messages, highlight the proposals that shareholders will be voting on and supplement the pay orientated disclosure provided in the CD&A.
Say on Pay Frequency Vote Results
An annual vote frequency emerged as the clear shareholder preference in 2011. Among S&P 500 companies reporting vote results, a majority of shareholders supported an annual frequency at 94% of companies. This differs from vote recommendations, with only 70% of the companies recommending an annual vote.
|
Board Recommendation for Vote Frequency |
# of Companies |
|
Frequency Receiving Majority Shareholder Support |
% of Companies |
|
Annual |
70% |
|
Annual |
94% |
|
Biennial |
3% |
|
Biennial |
0% |
|
Triennial |
23% |
|
Triennial |
5% |
|
No Recommendation |
4% |
|
None (only plurality) |
1% |
The strong support for annual votes is not a surprise. 39 institutional investors, representing more than $830 billion in assets, issued a public call for companies and investors to support annual advisory votes on executive compensation in 2011 proxy statements. Similarly, a number of major mutual funds, as well as ISS and Glass Lewis, have indicated support for annual Say on Pay votes.
CAP Comment: Over time, we expect the prevalence of annual Say on Pay voting to increase.
CAP Comment: Following the frequency vote, the SEC rules mandate disclosure through an 8-K of how often the company will hold future Say on Pay votes. Issuers must also provide proxy-based disclosure of the current frequency of Say on Pay votes and when the next scheduled Say on Pay vote will occur.
CAP Comment: For companies that conduct Say on Pay vote frequency in line with the preference of a majority of shareholders, shareholder frequency proposals can be excluded from the proxy for six years.
Conclusion
Last year many questioned what level of shareholder support should be viewed as “acceptable.” Based on experience to date, the acceptable “threshold” will be around 80% support, a higher hurdle than simply a pass / fail test. This is somewhat higher than the minimums identified by ISS and Glass Lewis, and should be sufficient to avoid undue scrutiny of the compensation program.
Going forward, a Say on Pay vote will be an annual event at most companies. Our experience indicates that Sayon Pay voting has been a catalyst for change, and certain themes have emerged:
- Companies with stronger performance generally receive higher levels of shareholder support;
- Negative vote recommendations from the shareholder advisory firms will likely reduce the vote below the “acceptable” level and companies will need to campaign to obtain a positive voting outcome;
- Many companies have increased dialogue with their largest investors by engaging early;
- Say on Pay proposals include supporting statements;
- Use of executive summaries in the Compensation Discussion and Analysis (CD&A) of the proxy statement is commonplace; and
- Use of a proxy summary or potentially filing supplemental material to rebut negative voting recommendations should be considered.
1 Outside of the S&P 500, an additional 22 companies did not receive majority shareholder support for their NEO compensation program as of 5/25/2012: Actuant Corporation, Argo Group International, Cenveo, Charles River Laboratories, Chemed Corporation, Community Health Systems, Comstock Resources, First California Financial, FirstMerit Corp., Gentiva Health Services, Hercules Offshore, Infinera Corporation, KB Home, Knight Capital Group, Manitowoc Company, OM Group, Palomar Medical Tech., Phoenix Companies, Sterling Bancorp, The Ryland Group, Tower Group, and Viad Corp.
We have summarized the quantitative and qualitative pay-for-performance assessment and the peer group selection process including key findings and implications.
ISS’ Quantitative Assessment Of Pay-For-Performance Alignment
Historically, ISS reviewed a company’s one- and three-year total shareholder return (“TSR”). If TSR was below the median of the GICS industry group, ISS reviewed the CEO’s year-over-year change in pay level plus the five year trend in CEO pay relative to TSR performance over the same period. ISS’ current TSR screen only triggers a closer look for approximately 30% of companies.
For 2012, ISS developed a new pay-for-performance assessment that will focus on both relative and absolute company performance. The objective of ISS’ new methodology is to achieve three goals:
- Measure the pay-for-performance alignment over multiple time horizons since executive compensation and company performance span a time horizon longer than one year.
- Use multiple measures to assess this alignment because a single measure cannot decisively indicate that pay and performance is aligned.
- Provide shareholders with information on the strength of the pay-for-performance relationship.
ISS’ new pay-for-performance alignment is based on two relative measures (relative degree of alignment and multiple of median) and one absolute measure (pay – TSR alignment). ISS back-tested each of these measures for a sample of 2,500 companies over a 5 year period (2006 – 2010). Based on ISS’ findings, they developed guidelines to identify outliers to denote companies that may have a misalignment between pay and performance.
Relative Degree of Alignment (“RDA”)
RDA measures a company’s CEO pay level and TSR performance relative to its ISS peer group for both a one- and three-year period. ISS analyzes pay1 levels disclosed for the CEO over the past three years and TSR based on the target company’s fiscal year end. ISS determines the company’s percentile rank for one- and three-year pay and performance. ISS calculates the RDA by subtracting the combined pay percentile ranks from the combined performance percentile ranks. The combined percentile ranks are weighted 40% for one-year and 60% for three-year (see below for an example of the calculation).
| Percentile Rank | |||
| Performance | Pay | RDA | |
| 1- Year (40% weight) | 42 | 52 | -10 |
| 3-Year (60% weight) | 26 | 64 | -38 |
| Total | 32 | 59 | -27 |
A company’s RDA can range from -100 to +100 with -100 reflecting high pay (100th percentile) and low performance (0th percentile). Based on ISS’ back testing, 50% of companies had an RDA range of -28 to +30. In other words, from ISS’ perspective, all things being equal, a zero RDA, would mean a company’s pay is tightly aligned with performance and a high positive number would indicate the company’s pay levels are conservative relative to the performance delivered.
Multiple of Median (“MOM”)
MOM measures the magnitude of a CEO’s pay for one-year relative to the median of the comparison group. Unlike RDA, the multiple of median for a company can be infinite. Based on ISS’ back-testing, 75% of companies have a multiple of median of 1.5x median or less and 90% of companies pay less than 2.1x median.
Pay-TSR Alignment (“PTA”)
PTA measures, directionally, how well pay increases for the CEO tracks with shareholder performance over a five-year period. ISS will use regression analysis to determine the trend in CEO pay and TSR over the five-year period. The final PTA will be the performance slope minus the pay slope. Based on ISS’ back-testing, PTA ranges from -106% to +129% with a median value of -3% (i.e., the trend rate for CEO pay at the median company was 3 percentage points higher than performance).
ISS Quantitative Assessment
ISS will analyze the findings from the RDA, MOM and PTA to determine if a company has a disconnect between pay and performance. A company that is a significant outlier (i.e., high concern) on any one measure or an outlier (i.e., medium concern) on multiple measures will receive a “high concern” level for a misalignment between pay and performance and ISS will conduct a qualitative assessment.
ISS developed parameters (see chart), based on its back-testing of each measure, to determine if a company elicits further review of its compensation practices. ISS will identify companies that are outliers (or significant outliers) for each measure.
| Measure | Medium Concern | High Concern | ||
| Relative Degree of Alignment | -30 | ~ 25th Percentile | -50 | ~10th Percentile |
| Multiple of Median | 2.33x | ~ 92nd Percentile | 3.33x | ~ 97th Percentile |
| Pay-TSR Alignment | -30% | ~10th Percentile | -45% | ~5th Percentile |
ISS compared results on its new quantitative assessment to the voting outcomes from say on pay resolutions. Companies with low concern on the pay-for-performance alignment received, on average, 92% support on the say on pay resolution while companies with a high level of concern received 81% support, on average.
CAP Perspective: ISS’ new quantitative analysis provides more rigor to identifying companies that may have a pay-for-performance issue. By placing more weight on pay and performance trends over a longer period of time, ISS is recognizing that one-year may not be a predictive indicator of the relationship between a CEO’s pay and company’s performance. However, by limiting the pay-for-performance assessment to TSR, ISS is not considering other financial factors that may ultimately determine compensation delivered/earned by executives. Additionally, by only analyzing the grant-date value of equity awards, ISS is not taking into account that outstanding equity awards may have little to no value despite the intended value at grant given many are performance contingent and tied to stock price.
Companies that would have received a high level of concern under ISS’ new pay-for-performance assessment still received approximately 80% of shareholder support on the say on pay resolution. However, shareholders may scrutinize a company’s executive compensation program in light of a high concern assessment by ISS. We believe the new tests provide a more robust perspective on pay-for-performance; however, they do not in and of themselves take into account company specific factors that may be driving pay decisions. This is why telling a compelling story for why the Company and Compensation Committee made specific decisions, especially when there may be a pay-for-performance disconnect, is critical. These items will only be picked up through the qualitative assessment and given the challenges institutional investors and their advisors face in reviewing an extraordinary number of proxies in such a short period of time, the more clear and concise the rationale, the better.
ISS’ Qualitative Assessment Of Pay-For-Performance Alignment
Companies that receive a high concern level based on the quantitative review from ISS will receive an in-depth qualitative assessment to determine how different elements of compensation are used to facilitate or impede shareholder value creation. ISS’ qualitative review may include an evaluation of:
- Performance-based compensation received by executives (focusing on recent decisions made by the Compensation Committee). This review will include the ratio of time-based vs. performance-based awards, cash awards paid vs. target opportunity level, the extent to which total compensation is comprised of performance-based awards, metric(s) used in performance-based awards and any adjustments made to non-GAAP metrics.
- Peer group used for benchmarking purposes as well as the company’s compensation philosophy. ISS will examine if a majority of peer companies are larger in size than the target company or if the target company has an above median pay philosophy.
- Financial / operational results of the company if the cash payout is the main reason for the pay-for-performance misalignment. ISS will review the performance goals related to the cash payout and may examine absolute and relative performance for GAAP measures (including return and growth measures) to determine if the quantitative findings are inconsistent with the company’s financial performance.
- Special circumstances (such as a new CEO or biennial equity grants) that may distort the quantitative analysis. Such circumstances will not automatically nullify the quantitative assessment but may be included as part of its review.
CAP Perspective: This qualitative assessment will compel companies to provide a clear rationale for their compensation decisions (including any recent compensation action) in the CD&A. This may also influence companies to include a concise executive summary of performance and pay at the beginning of the CD&A. We believe including the review of non-TSR metrics is an important step in understanding how decisions are made. Companies should consider how best to articulate their metrics so a reader of the CD&A can understand how decisions and outcomes occurred.
Peer Group Selection Process
Current Approach
ISS’ currently selects a peer group compromised of 8 – 12 companies in the same six-digit Global Industry Classification Standard (“GICS”) code based on .5x – 2x the company’s revenue size (or asset size for financial firms). If there are insufficient companies within the six-digit GICS, peer companies would be supplemented from the four-digit GICS or even the two-digit GICS, using the same size parameters. ISS currently uses market cap as another screen to find additional peers when companies have either very low or high revenue or asset size. For some very large companies, ISS may compile companies using a standard index (such as the Dow Jones 30 or the S&P 500 index).
Updated Peer Group Selection Process
ISS has revised its selection process for the upcoming 2012 proxy season. ISS will compare a company’s pay-for-performance alignment to a group of 14 – 24 companies. A peer group will be based on a company’s GICS code, revenue (or asset) size as well as market cap. ISS will create a peer group twice a year (based on quarterly data as of June 1 and December 1) for Russell 3000 companies based on the following:
- Revenue for the most recent trailing 4 quarters
- Total assets as of the most recent quarter
- 200 day average stock price x shares outstanding as of the most recent quarter (market cap)
To determine the peer group, ISS will identify companies in the two-digit GICS code with a revenue (or asset) size of .45x – 2.1x and a market cap of .2x – 5x. ISS has expanded the revenue/asset size from the standard .5x – 2x range to ensure that similar companies that are slightly beyond the standard range are included as potential peers. From this universe, ISS will select companies within the same six-digit GICS code while trying to maintain the target company’s revenue/asset size around median. ISS may select up to 24 companies from the six-digit GICS code for a peer group however a minimum of 14 companies will consider the peer group complete. If 14 companies are not selected, ISS will expand the list of potential peers to the four-digit GICS code and if the peer group list still does not contain 14 companies, the two-digit GICS code. On an exceptional basis, ISS may exclude company (for example, if a comparator is in bankruptcy).
ISS has also developed two supplemental methodologies if a peer group yields less than 14 companies under their new method.
- ISS has identified approximately 25 very large non-financial companies in the Russell 3000 (revenue of $50B and a market cap greater than $30B) with very few to no peers. For ISS’ pay-for-performance evaluation, these companies will be compared to each other. ISS notes that industry-specific performance will be considered if a qualitative review is conducted.
- If a 14 company peer group cannot be yielded under the standard methodology, ISS will include companies with revenues beyond the initial revenue range of .45x – 2.1x while maintaining the target company’s revenue around median and maintaining the market cap range.
CAP Perspective: ISS has provided more controls in selecting companies within a similar size range. Although ISS will review companies in a specific GICS code, there are some limitations to relying solely on the GICS code. Companies within the same GICS code may not be business competitors and, in some instances, a direct competitor may be within a different two-digit GICS code. ISS will not provide a qualitative review of selected peer companies and a peer group may, therefore, contain companies that do not compete with the target company. Additionally, companies with direct competitors that compete for talent and business but may be somewhat larger or smaller than the target company will most likely not be considered due to the size constraints. Therefore, while this new methodology may bring ISS peers more in line with peer groups used internally by companies, significant differences may continue to exist.
Conclusion
ISS’ new peer group selection process and pay-for-performance assessment are more transparent and more rigorous than the current approach. Although ISS has changed its peer group selection process, we expect that there may still be some disagreement on the business relevance of companies in ISS’ peer group especially when the selection parameters are expanded to include companies in the two- and four-digit GICS codes. The quantitative assessment is a more robust analysis of a company’s pay-for-performance alignment with more consideration for longer term performance than the current approach. Companies will want to assess their pay-for-performance from various perspectives including those similar to ISS to understand potential shareholder reaction.
1 ISS calculates pay based on the values disclosed in the Summary Compensation Table excluding the stock award and stock option award values. ISS revalues equity-based grants using its own standard set of assumptions.
Revisions to U.S. GRId 2.0
The revised U.S. GRId maintains its primary objective of assessing a company’s governance practices (based on Audit, Board, Shareholder Rights and Compensation) but has been refined to provide better insight into governance issues and improve the usefulness of the rating system. ISS made the following changes to the GRId:
- Revisions to the Compensation category. Updating the Compensation category of the GRId was a top priority for ISS. These revisions include:
- New questions relating to ISS’ revised pay-for-performance assessment (see ISS’ New Quantitative and Qualitative Approach for Evaluating Pay for Performance Alignment CAPFlash here).
- Expansion of potential responses for equity-based pay questions to better assess program features.
- Additional details on the size of severance pay and perquisites.
- Reorganization of subcategories to better align with the framework of ISS’ principles for evaluating say on pay. New categories include: use of equity, equity risk mitigation, communication and disclosure, and termination / severance.
CAP Perspective: With ISS’ increasing its focus on compensation practices and reorganizing the subcategories to better align with their say on pay assessment, companies should have a clear and concise disclosure and rationale of their compensation program in the CD&A. Given the short amount of time and the number of companies ISS and other proxy advisory firms will be reviewing, it would be beneficial for a company to have an executive summary at the beginning of the CD&A or have charts to summarize the compensation program that includes rationale and highlight apects that they believe ISS and shareholders will view positively.
- Refinement and reorganization of subcategories. For the other categories, ISS has revised some of the subcategories to better group questions together. Specifically, ISS has reorganized the following categories:
- Audit: ISS has targeted the role of the external auditor and will examine if there are any audit or accounting controversies.
- Board: ISS has separated the prior “Board Practices” subcategory into “Board Practices” (to determine the behavior of the Board) and “Board Policy” (to understand governance policies) as well as added a subcategory on Related Party Transactions (“RPT”) to identify potential governance issues.
- The Board Practices subcategory reviews if the CEO or directors serve on an excessive number of outside boards, the number of board meetings attended by directors and how many directors received a withhold/against vote of 50% or greater.
- The Board Policies subcategory assesses if the company discloses board/governance guidelines, if directors can meet without management present and if directors can hire their own advisors without management approval.
- The RPT subcategory evaluates what percentage of directors were involved in material RPT, if directors with material RPT sit on key board committees and if there are any RPTs involving the CEO.
- New and modified questions/answers under each category. ISS has added approximately 40 questions to the GRId with approximately 25 new questions under the Compensation category. See the Appendix (page 4) for a list of new GRId questions under each category. Topics covered by the new questions in the Compensation section include degree of alignment between CEO pay and company performance, excessive perquisites, change-in-control and severance benefits and features of the equity compensation plan. Additionally, ISS has expanded potential responses for its questions to capture the main features of a company’s programs and policies. Similar to their current approach, ISS will review publicly available data to obtain answers for each question.
- Enhancement and increased transparency in the rating system. Fundamentally, the rating system is consistent with the prior version of GRId; a company will receive an overall score and a concern level for each of the four categories. The basic changes to the rating system are related to how answers are scored and how the resulting scores are aggregated.
- Each answer will receive a score. A negative score will denote a practice that raises concern and a positive score will denote a best practice that may lessen concerns elsewhere.
- A score of -25 denotes medium concern level and a score of -50 denotes high concern level.
- ISS has established a threshold and maximum for each subcategory in order to place more weight on certain subcategories. If, for example, in the Termination subsection of the Compensation category a company receives positive points for not having employment agreements, the total positive number a company can receive for this subcategory is +15 and will not eclipse other subcategories in Compensation2.
- The final score for the overall category will reflect the sum of the subcategories. Each category will be subject to a threshold and maximum (same as the subcategory) and will range from -75 to +25. ISS will add 75 points to the final score to standardize the scale from 0 to 100 for each category. The chart below shows the resulting level of concern based on the total number of points.
- ISS will disclose a company’s final score for each category in addition to the current “traffic light” system.
- Each answer will receive a score. A negative score will denote a practice that raises concern and a positive score will denote a best practice that may lessen concerns elsewhere.
| Total Points3 | ISS Concern Level |
| <= 50 points | High |
| <= 75 points | Medium |
| >75 points | Low |
3 The specific scoring and points are subject to change by ISS upon review and back-testing prior to the launch of GRId 2.0 in February 2012.
Conclusions
ISS will be increasing the transparency of its GRId and its focus on compensation for the upcoming proxy season. We will have to wait and see how the new rating system and questions will affect a company’s overall rating in each category but we would expect that companies that have a clear disclosure of their goverance practices and rationale for their policies would fair somewhat better than a company that does not.
Appendix – New GRId 2.0 Questions
Audit
- Has a securities regulator taken enforcement action against a director or officer of the company in the past two fiscal years?
- Is a director or officer of the company currently under investigation by a regulatory body?
Board
- What is the classification of the Chairman of the Board?
- Are the roles of Chairman and CEO separated?
- Has the company identifies a lead / senior independent director?
- What percentage of the board consists of family members?
- What percentage of the board are former or current employees of the company?
- Can directors hire own advisors without management approval?
- Are there related –party transactions involving the CEO?
Shareholder Rights
- Does the company have a poison pill (shareholder rights plan) in effect?
- What is the trigger threshold for the poison pill?
- Is the poison pill designed to preserve tax assets (NOL pill)?
- Was the poison pill approved by shareholders?
- When was the poison pill implemented or renewed?
- Does the company’s poison pill include a modified slow-hand or dead-hand provision?
- If the company has a majority voting standard, is there a plurality carve-out in the case of contested elections?
- Are there material restrictions as to timing or topics to be discussed, or ownership levels required to call a special meeting?
Compensation
- What is the degree of alignment between the company’s cumulative 3-year pay percentile rank, relative to peers, and its 3-year cumulative TSR rank, relative to peers?
- What is the degree of alignment between the company’s cumulative 1-year pay percentile rank, relative to peers, and its 1-year cumulative TSR rank, relative to peers?
- What is the size of the CEO’s 1-year cumulative pay, as a multiple of the median pay for company peers?
- What is the degree of alignment between the company’s TSR and change in CEO pay over the past five years?
- What is the ratio of the CEO’s total compensation to the next highest paid executive?
- Did the CEO receive tax gross-ups on perks other than relocation and other broad-based benefits?
- Did the company provide dividends on unvested performance shares in the last fiscal year?
- Has the company reimbursed NEOs for losses on sale of a home?
- Did the company pay tax gross-ups on a secular trust?
- What is the ratio of the CEO’s non-performance-based compensation (All Other Compensation) to Base Salary?
- Does the company’s active equity plans prohibit options / SAR cash buyouts?
- Do the company’s active equity plans prohibit share recycling for options / SARs?
- Do the company’s active equity plans prohibit option / SAR repricing?
- Do the company’s active equity plans have an evergreen provision?
- Do the company’s active equity plans have a liberal CIC definition?
- Do the company’s active equity plans provide for automatic vesting of equity awards in the case of change-in-control?
- What are the minimum vesting periods mandated in the plan documents for executives’ stock options or SARs in the equity plans adopted / amended in the last 3 years?
- What are the minimum vesting periods mandated in the plan documents adopted / amended in the last three years, for executives’ restricted stock?
- What proportion of the salary is subject to stock ownership requirements / guidelines for the CEO / Is the CEO subject to ownership guidelines?
- Did any executive or director pledge company shares?
- Does the company have a policy prohibiting hedging of company shares by employees?
- What is the level of disclosure on performance measures for the latest active or proposed long term incentive plan?
- What is the multiple of salary plus bonus in the severance agreements for the CEO (upon a change-in-control)?
- What is the multiple of salary plus bonus in the severance agreements for executives excluding the CEO (upon a change-in-control)?
- What is the basis for the change-in-control or severance payment for the CEO?
- What is the basis for the change-in-control or severance payments for executives excluding the CEO?
- What is the amount of the CEO’s estimated non-Change-In-Control severance amount as of the end of the last fiscal year, as a multiple of the executives’ average salary plus bonus over the past three years?
1 ISS will add countries from the developed-market MSCI EAFE index which includes: Austria, Australia, Belgium, Denmark, Finland, Greece, Hong Kong, Ireland, Israel, Italy, Japan, New Zealand, Norway, Portugal, Singapore, Spain and Switzerland.
2 The specific scoring and points are subject to change by ISS upon review and back-testing prior to the launch of GRId 2.0 in February 2012.