Never fall behind on the latest trends in CEO pay ratio with CAP’s CEO Pay Ratio Tracker. The CEO Pay Ratio Tracker uses each company’s most recent pay ratio disclosure.
Data effective: June 1, 2022
Revenue and Market Cap Filters
- Select the desired Revenue and Market Cap scopes using the text boxes
Sector Breakdown Chart
- Chart shows the sector breakdown for companies within the selected Revenue and Market Cap scopes
- Hover over each section to see the percentage and number of companies in each sector
- Click on each section to show pay ratio data for only that sector
- Select multiple sectors by holding down the Ctrl key
- Click the center of the Sector Breakdown chart to reset to all companies
- The number of companies in the selected scope will show in the center of the Sector Breakdown chart
Pay Ratio – Percentiles Chart
- Chart shows pay ratio data for companies in the selected sector and Revenue and Market Cap scopes
- When a sector is selected, bolded bars show data just for that sector and lighter bars show data for all companies within the selected Revenue and Market Cap scopes
For questions or more information, please contact: Ryan Colucci Principal [email protected] 646-486-9745 or Kyle White Senior Analyst [email protected] 646-568-1161.
Click here to read more about new factors impacting the CEO Pay Ratio Disclosure in 2021 and beyond: https://www.capartners.com/cap-thinking/2021-ceo-pay-ratio-disclosure-new-considerations-and-expectations/.
The COVID-19 pandemic dealt an unexpected blow that pushed a number of companies into bankruptcy. The impact of pandemic-related shutdowns was broad: Companies in a diverse range of industries – including retail, oil and gas, consumer goods, restaurants, and entertainment and recreation – filed for Chapter 11 bankruptcy protection in the first half of 2020. While the number of filings has not yet reached the level seen in the 2008 financial crisis, the number of bankruptcies is expected to rise through the remainder of the year.
The 2020 surge in bankruptcies has been accompanied by heightened scrutiny of executive pay in restructuring situations. Bankruptcy filings are often preceded by announcements of executive retention and other short-term performance-based awards. These awards can draw criticism as excessive and even inappropriate given the impact of bankruptcy on shareholders and the broader employee population. However, 2020 is unique. While situations vary by industry, most agree that this flurry of bankruptcy filings is not the result of poor management but rather the inevitable impact of unprecedented and unforeseeable broad shutdowns across the country to contain the pandemic. The companies entering bankruptcy need continuity, stability, and motivated leadership. Carefully designed and communicated retention and performance awards can play an important role in keeping leadership in place and focused on moving the company through the restructuring process.
The Evolution of Prepaid Awards
Corporate bankruptcies cause a significant amount of uncertainty for executives and employees, who can be tempted to leave for more stable work situations with predictable, secure compensation streams. Poor company performance means that annual incentives are unlikely to pay out, and equity holdings lose almost all value. In situations where shareholders need to retain executives through the bankruptcy period, cash retention awards to critical members of management can be effective by providing compensation stability. These programs are often called Key Executive Retention Programs (KERPs).
Executive retention awards in bankruptcy situations today have a unique design: they are paid before the bankruptcy filing and are subject to clawback provisions. Clawback provisions are triggered if the executive terminates employment during a specified time period or is terminated for cause. In addition, some clawbacks are tied to performance goals not being achieved. If triggered, the clawback provisions require executives to pay back the after-tax award value. The fact that the awards are prepaid differentiates them from most other cash incentives and makes them the subject of criticism and misunderstanding.
The Evolution of Prepaid Executive Retention Awards in Bankruptcies

The unique design for executive retention awards emerged from changes to the U.S. bankruptcy code made through the Bankruptcy Abuse Prevention and Consumer Protection Act of 2005 (BAPCPA). Prior to BAPCPA, a large portion of executive compensation in bankruptcy situations was delivered through retention awards. Executive retention awards were typically paid out in a lump sum or through several payments based on the executive’s continued employment. Executive retention awards also had special status in the bankruptcy proceedings that ensured payment ahead of many other company obligations. As a result of the special status and lack of performance features, executive retention awards were not viewed favorably.
BAPCPA imposed stringent restrictions on awards to “insiders” implemented during the bankruptcy process that are based solely on retention and that lack performance features (“Insiders” are defined as directors, officers, individuals in control of the corporation, and relatives of such individuals). BAPCPA’s restrictions effectively stopped the use of executive retention awards once companies file for bankruptcy. Despite BAPCPA, executive retention awards eventually re-emerged – as prepaid awards subject to clawbacks. By paying the awards before the bankruptcy filing, companies can generally avoid the BAPCPA restrictions and avoid having the award subject to Bankruptcy Court approval.
Prevalent Executive and Employee Pay Practices during Bankruptcy
CAP analyzed the 8-K filings of a number of companies that entered bankruptcy in 2020. Based on this analysis, companies today often use a mix of compensation programs to retain and motivate executives and employees leading up to, and during, the bankruptcy process:
- Pre-filing, prepaid executive retention awards
- Performance-based Key Employee Incentive Plans (KEIPs)
- Employee retention and incentive programs
Pre-Filing, Prepaid Executive Retention Awards
A number of companies that filed for bankruptcy during 2020 announced prepaid retention awards for executives anywhere from days to months before the legal filing. The 8-K filings indicate that the prepaid retention awards are designed by the board with advice from compensation consultants, as well as bankruptcy and other advisors. Typical design parameters for executive retention bonus awards include:
|
Participation: |
CEO, other key executives and officers |
|
Objectives: |
Retain key employees before and during the bankruptcy proceedings |
|
Award Value: |
|
|
Form of Payment and Timing: |
Awards are made in cash, prepaid in a lump sum prior to the bankruptcy filing |
|
Clawback Provisions: |
Executives must repay the awards, net of taxes, if they 1) Terminate employment prior to the earlier of a specified period or the conclusion of the bankruptcy period, or 2) Are terminated by the company for cause |
|
Clawback Period: |
Most often one year |
While less common, some companies, including Chesapeake Energy and Ascena Retail Group, include base-level performance criteria in the clawback provisions to add a performance element to the prepaid retention awards. This improves the overall optics of such awards and helps avoid additional scrutiny during bankruptcy.
|
Select Pre-Filing Retention and Incentive Programs |
||||||
|
Company |
Revenue FY2019 ($000s) |
Industry |
Bankruptcy Date |
Program |
Award Term |
Description |
|
J.C. Penney |
$12,019 |
Retailing |
5/15/2020 |
Retention & Incentive |
0.6Y |
Adopted a prepaid cash compensation program equal to a portion of NEO annual target variable compensation; NEO awards ranged from $1M to $4.5M; clawbacks are tied 80% to continued employment through January 31, 2021, and 20% to milestone-based performance goals |
|
Retention |
1.6Y |
Accelerated the earned 2019 portion of three-year long-term incentive awards ($2.4M for NEOs); clawbacks are tied to continued employment through January 31, 2022 |
||||
|
Hertz Global Holdings |
$9,779 |
Transportation |
5/22/2020 |
Retention |
0.8Y |
Cash retention payments to 340 key employees at the director level and above ($16.2M in aggregate); NEO awards ranged from $190K to $700K; clawbacks tied to continued employment through March 31, 2021 |
|
Chesapeake Energy |
$8,408 |
Energy |
6/28/2020 |
Retention & Incentive |
1.0Y |
Executives: Prepaid 100% of NEO and designated VP target variable compensation ($25M in aggregate for 27 executives) based 50% on continued employment and 50% on the achievement of specified incentive metrics Employees (retention only): Converted annual incentive plan into a 12-month cash retention plan paid quarterly, subject to continued employment |
|
Ascena Retail Group |
$5,493 |
Retailing |
7/23/2020 |
Retention & Incentive |
0.5Y |
Executive and Employee Retention and Performance Awards: Six-month cash award for NEOs (NEO awards ranged from $600K to $1.1M), 3 other executives, and employees who are eligible for the company’s incentive programs based 50% on continued employment through Q4 2020 and 50% on performance; award amounts are based on a percentage of annual and long-term incentive targets Earned Performance-Based LTIP Awards: Accelerated earned 2018 and 2019 performance-based cash awards for all employees ($1.1M for 2 NEOs), subject to continued employment through August 1, 2020 for the 2018 award and August 3, 2021 for the 2019 award |
|
Whiting Petroleum |
$1,572 |
Energy |
4/1/2020 |
Retention |
1.0Y or Chapter 11 Exit |
NEO awards were prepaid and ranged from $1.1M-$6.4M; clawbacks are based on termination of employment before the earlier of March 30, 2021, or Chapter 11 exit; employees receive quarterly cash awards that in aggregate may not exceed that employee’s target annual and long-term incentive compensation |
|
GNC Holdings |
$1,446 |
Food, Beverage and Tobacco |
6/23/2020 |
Retention |
1.0Y |
Cash exit incentive awards for key employees (including executives) based 75% on the Company’s exit from bankruptcy and 25% on the 60th day following an emergence event that occurs on or prior to June 23, 2021. Prepaid NEO awards ranged from $300K to $2.2M |
|
Diamond Offshore Drilling |
$935 |
Energy |
4/26/2020 |
Retention |
1.0Y |
Past Executive Long-Term Cash Incentives: Payment of a portion of past three-year cash incentive awards was accelerated for retention; awards are subject to clawbacks based on termination of employment for one year; NEO payouts ranged from $140,208 to $1.75 million. Other Plans: The Company announced a Key Employee Incentive Plan, a Non-Executive Incentive Plan and a Key Employee Retention Plan, which are all subject to approval by the Bankruptcy Court |
Performance-Based Key Employee Incentive Plans (KEIPs)
After BAPCPA, KEIPs emerged to provide incentives to executives without running afoul of the bankruptcy code. KEIPs, which are approved during the bankruptcy process, are performance-based incentives that pay out in cash based on the achievement of financial and operational goals. The goals can be very short-term in nature, such as quarterly performance periods.
Typical design parameters for KEIPs include:
|
Participation: |
CEO, other key executives and officers (ultimately those designated as “insiders” in the bankruptcy proceeding) |
|
Objectives: |
Incentivize key executives before, but primarily during, the bankruptcy proceedings |
|
Award Value: |
|
|
Form of Payment and Timing: |
|
A current trend is to design and implement the KEIP prior to filing. This is especially true in pre-packaged bankruptcies where the financial reorganization of the company is prepared in advance in cooperation with its creditors. Having these programs in place with payouts contingent on performance improves continuity throughout the entire process, incentivizes the management team to perform, and meets the court’s requirement that any variable compensation to executives be performance based.
One recent example of a company announcing a KEIP before the bankruptcy filing is Diamond Offshore Drilling. The company announced a prepaid retention program for executives, as well as a KEIP, a non-executive incentive plan and an additional retention plan. All plans except for the prepaid executive retention program are subject to Bankruptcy Court approval, according to the 8-K. The KEIP, nonexecutive incentive plan and the additional retention plan replace past incentives – including requiring the forfeiture of past restricted stock unit awards and stock appreciation rights – and current incentives that would have been granted in 2020. The KEIP includes nine participants, including the senior executive team.
Employee Retention and Incentive Programs
Retention and incentive programs for employees are also used during the bankruptcy process. The use of employee programs depends on the company’s business needs and other factors, such as size and industry. Retention and incentive programs for non-executives typically replace the value of annual incentives and sometimes long-term incentives. Employee retention programs are cash-based and pay out at specific intervals, often quarterly given the uncertainties associated with companies in restructuring situations. The duration of employee retention programs often mirrors those for executives.
Severance programs, which provide compensation to individuals at termination, are also used in bankruptcy situations. When communicated broadly during bankruptcy, severance can be considered a retention program as it helps employees have some financial security and focus on their current jobs rather than finding new positions. Severance programs tend to be used more commonly for employees than executives because BAPCPA limits the value that can be delivered to “insiders.” However, a recent example of a severance program for executives came from Hertz Global Holdings, which announced amendments to its executive severance programs prior to its bankruptcy filing in May 2020. The severance programs, which were disclosed in the same 8-K filing as a prepaid key employee retention program, cover senior executives and vice presidents, and the payment multiple was reduced to 1X salary and bonus from 1.5X.
Conclusion
Executive compensation programs implemented in conjunction with a bankruptcy should be carefully designed and reviewed with outside advisors to ensure that the company is complying with bankruptcy code. Companies should carefully review the value of executive awards to ensure that they are reasonable while also in line with competitive practices and past incentive opportunities. Executive award amounts should be considered in the context of employee awards and the company’s overall financial situation to ensure fairness and avoid the appearance of excess. Lastly, companies should carefully communicate the rationale for executive awards and what the company is doing for employees in the 8-K current report or other announcement. Clear communication up front can help head off later public relations and optics headaches.
Compensation Advisory Partners (CAP) assessed human capital actions taken by companies in the Consumer Staples sector in response to the COVID-19 pandemic. Key findings include:
- The Consumer Staples sector was moderately impacted by the COVID-19 pandemic, with 36% of companies in the S&P 1500 taking human capital actions.
- Food and Staples Retailing companies reported the most actions – many of which were positive for employees: expanded paid time off and health care benefits, one-time bonuses and additional pay for on-site workers, and workforce expansions
- The five most prevalent human capital actions by the Consumer Staples sector are additional payments for on-site employees (non-executives), expanded benefits programs, one-time bonuses for non-executives, furloughs of employees, and workforce expansions.
- Only a handful of companies in the sector reported executive salary reductions:
- Median salary reductions were 28% for CEOs and 25% for other executives.
- For boards of directors, pay was cut by a median of 50%.
The PDF of the report provides additional data for the Consumer Staples sector.
The human capital actions that CAP is tracking include pay cuts; changes to annual and long-term incentives; furloughs; workforce reductions; suspended 401K matches; enhanced health and welfare benefits; additional pay for frontline workers; pay continuity; and workforce expansions. CAP will continue to monitor corporate public announcements of COVID-19 actions.
The CAP 120 Company Research consists of companies from ten industries, selected to provide a broad representation of market practice among large U.S. public companies. In this report, CAP reviewed Pay Strategies, Annual Incentives, Long-Term Incentives, Perquisites, and Stock Ownership Guideline Requirement Provisions of these companies in order to gauge general market practices and trends.
Characteristics of the CAP 120 Company Research Sample
The CAP 120 Research Study consists of companies selected from ten industries intended to provide a broad representation of market practice among large U.S. public companies. The fiscal year revenues of the companies in our sample range from approximately $3 billion to $500 billion (median revenue of $32.7B) and are summarized in the following exhibits.

| Financial Summary ($M) | Cumulative Total Shareholder Return Ending on 12/31/2018 | ||||||
| Percentile | Revenue | Net Income | Assets | Market Cap | 1-Year | 3-Year | 5-Year |
| 75th | $67,103 | $6,804 | $172,979 | $99,181 | 4% | 50% | 73% |
| Median | $32,716 | $3,183 | $61,495 | $43,956 | -12% | 21% | 33% |
| 25th | $18,762 | $1,654 | $25,487 | $21,535 | -23% | -4% | 1% |
Pay Strategy
Among companies in CAP’s 120 Research, 97% disclose using a peer group for pay benchmarking purposes. The median number of companies in a peer group is 18.
Consistent with last year, approximately one-third (31%) of the companies with a peer group use more than one peer group. Companies with multiple peer groups either use two peer groups for pay benchmarking (e.g., an industry specific peer group and a general industry peer group) or use one peer group for pay benchmarking and another peer group for relative performance comparisons.
| Peer Group (n = 116) | ||
| % of companies with a disclosed peer group | % of companies with more than one peer group (among companies with a peer group) | Median # of companies in peer group |
| 97% | 31% | 18 |
While use of a peer group is almost universal among large cap companies, many use a peer group as a reference point when setting pay and do not disclose targeting a specific pay position relative to market. Only half of the companies in our study disclose a target pay philosophy for total compensation. Of these companies, only 7% target total compensation above median.
| Target Pay Philosophy (n = 56) | |||||
| Element | Base | Bonus | Cash | Long-Term Incentives | Total Compensation |
| % Disclosing | 32% | 22% | 22% | 24% | 47% |
| % Target Below Median Pay | 8% | – | – | – | – |
| % Target Median Pay | 87% | 96% | 96% | 97% | 93% |
| % Target Above Median Pay | 5% | 4% | 4% | 3% | 7% |
Annual Incentive
Annual Incentive Plan Metrics
A majority of CAP 120 companies (90%) fund their annual incentive plans using two or more metrics. Only 10% of companies use 1 metric, reflecting a decrease from 2009, as companies try to balance overall plan funding. Use of multiple performance metrics allows for annual incentive payouts to be reflective of broader company performance.

Operating Income (including EBIT, Pre-tax Income and EBITDA), Revenue, EPS, and Cash Flow are the most common metrics used in annual incentive plans. Since our first study, the use of Operating Income and Revenue has been generally consistent. Over this period, the use of EPS, Return Metrics and Net Income has decreased (by 11, 10 and 6 percentage points, respectively).

Note: In the chart above, n/a = not available. Percentages add to greater than 100% due to multiple responses disclosed by many of the companies. Return measures category is comprised of the following metrics: ROE, ROI, ROIC, and ROA.
More companies are incorporating non-financial measures in the annual incentive plan as they are unique to a company’s strategy. Overall, approximately 40% of companies in our study use strategic and other non-financial measures, with certain industries (e.g., Health Care and Oil and Gas) having more of an emphasis on these measures. An emerging trend is to incorporate ESG (environmental, social and governance) metrics in the annual incentive program. Overall, 14 companies (12%) in our study disclosed such measures; environmental measures are most prevalent (8 companies) followed by diversity and inclusion (6 companies).
The chart below shows the three most common metrics by industry in 2018:
| Industry | Metrics | ||
| Metric #1 | Metric #2 | Metric #3 | |
| Automotive (n=11) | Cash Flow (73%) | Op. income / EBIT / EBITDA (64%) | Revenue (36%) |
| Consumer Goods (n=14) | Revenue (71%) | EPS (57%) | Op. income / EBIT (50%) |
| Financial Services (n=7) | EPS (68%) | Return Metrics (43%) | Strategic Goals (43%) |
| Health Care (n=11) | Strategic Goals (64%) | Op. income / Pre-tax Income (55%) | EPS (45%) |
| Insurance (n=12) | Op. Income (58%) | Op. EPS (33%) | Op. ROE (25%) |
| Manufacturing (n=10) | Cash Flow (60%) | EPS (50%) | Op. Income (20%) |
| Oil and Gas (n=11) | Strategic Goals (64%) | Op. Income / EBITDA (55%) | ROIC (36%) |
| Pharmaceuticals (n=11) | Revenue (73%) | Pipeline / R&D (73%) | EPS (64%) |
| Retail (n=11) | Revenue (82%) | Op. Income / EBIT / Pre-tax Income (82%) | Strategic Goals (27%) |
| Technology (n=12) | Revenue (67%) | Cash Flow (50%) | Op. income / Pre-tax Income (50%) |
Note: Percentages reflect the prevalence of companies disclosing the metric.
Award Leverage
CAP reviewed proxy disclosures to understand how companies establish annual incentive payout ranges (i.e., threshold payout and maximum payout expressed as a percentage of the target award). 45% of companies in our study disclose a threshold annual incentive payout at a defined level other than zero. The most common threshold payout for these companies is 50% of target. Other companies start at a 0% payout for threshold performance with payout levels progressing to target.
A majority of companies (84%) disclose a maximum annual incentive opportunity. Most of these companies (74%) have a maximum bonus opportunity of 200% of the target award; only a handful of companies (7) have a maximum payout above 200% of target. We continue to see a decline in the number of companies with a maximum payout above 200% of target (8 companies in 2017 and 11 companies in 2016).
|
|
||||||||||||||||||||||||||
Long-Term Incentives
Long-Term Incentive Vehicle Prevalence
A vast majority of companies in our study (84%) use multiple long-term incentive vehicles for the most senior executives. Slightly more than half of the companies (55%) use two long-term incentive vehicles, typically delivered through either a long-term performance plan and time-based restricted stock/units (an uptick this year to 58%) or a long-term performance plan and stock options.
The next most common approach is to use three vehicles (29% of companies). A small percentage of companies in our study (16%) use only one vehicle and it is most typically delivered in the form of a long-term performance plan (84%).

Performance-based LTI awards for senior executives is used nearly universally among large cap companies (95%) and the use of stock options has declined to 51% of companies. This contrasts our first study when the use of stock options and performance-based LTI was fairly balanced (79% used performance-based LTI and 73% used stock options). The prevalence of time-based restricted stock/units has remained flat.

LTI Award Mix
Performance-based LTI reflects the largest portion of the LTI mix for the CEO. For the first time in our large cap company study, time-based restricted stock reflects a larger portion of the total LTI mix than stock options. The decrease in the value delivered in stock options has shifted to performance-based LTI in the overall LTI mix. The value delivered in time-based restricted stock/units has been generally flat since 2011.

Restricted Stock / Units (RS/RSU) and Stock Option Provisions
The majority of companies use ratable vesting over a period of three years for time-based RS/RSU awards. Approximately 30% of companies use a vesting schedule of four years or more.

For stock options, most companies use 3-year ratable vesting with a 10-year term.
| Stock Options | |||||||
| Vesting Approach | Vesting (Years) | Term (Years) | |||||
| Ratable | Perf-Based | Cliff | 3 | 4 | > 4 | 10 | < 10 |
| 82% | 2% | 16% | 69% | 26% | 5% | 92% | 8% |
Performance-Based Award Provisions
The payout curve for performance-based LTI awards with upside and downside leverage mirrors the payout curve for annual incentive awards; the most common threshold payout is 50% of target and the most common maximum payout is 200% of target. Unlike annual incentive awards, a large number of companies (41% for long-term plans vs. 26% for annual incentive plans) disclose a threshold payout between 25% – 50% of the target award.
|
|
||||||||||||||||||||||||||
Performance Metrics
Total Shareholder Return (TSR) continues to be the most prevalent performance metric in long-term performance plans; 63% of companies use it as a measure in the performance-based LTI plan. Return metrics are the second most common measure (51% of companies) followed by EPS (31%) and Revenue (23%).
In CAP’s first study, EPS was the most common measure followed by TSR. The rise in the use of TSR can be linked to the influence of proxy advisors who have increasingly used TSR as a proxy for performance since our first study (conducted prior to the adoption of the Dodd-Frank Wall Street Reform and Consumer Protection Act which mandated the shareholder Say on Pay vote). Of the companies that use TSR, approximately 30% disclose using it as an award modifier instead of a weighted metric.
The decline in the use of EPS in performance-based LTI plans is consistent with the decline of EPS use in annual incentive plans. Interestingly, the use of return measures has increased significantly from our first study (51% in 2018 vs. 20% in 2009) as companies are aligning executive long-term pay with profitable growth and operational efficiency. Return metrics are also often favored by institutional shareholders.

Note: Percentages add to greater than 100% due to multiple responses disclosed by many of the companies. Return measures category is comprised of the following metrics: ROE, ROI, ROIC, and ROA.
Performance Measurement – Absolute vs. Relative
A majority of companies in our study balance absolute financial performance goals (based on budget) with relative metrics. This balanced approach has increased substantially since our first study. Today, 52% of companies use both absolute and relative metrics vs. 25% of companies in 2009. This increase is tied to the increase use of relative TSR as a long-term metric.
In our most recent study, only 11% of companies use relative performance metrics only (down from 26% in 2009) and 37% of companies use absolute metrics only (down from 49% in 2009).

Perquisites
A majority of companies in our study (87%) provide perquisites to their CEO. Most companies (69%) also provide perquisites to the CFO. These findings are consistent with our study last year.
Personal use of aircraft, personal security, financial planning and automobile allowance continue to be the most common CEO perquisites. Even though the percentage of companies providing perquisites to the CEO has been relatively flat, the percentage of companies providing the most common perks has increased suggesting that when companies are providing perks to their CEO, it is likely a combination of the four most common categories.

The median value of perquisites delivered to the CEO in 2018 ($125,000) is lower than the value five years ago ($143,000). There was nearly a 30% increase however, in the median perquisite value for the CFO in 2018 ($32,000) compared with 2014 ($25,000).

Stock Ownership Requirement Provisions
Stock ownership guidelines are very common in publicly traded companies and are viewed favorably from a governance perspective. 95% of companies in our sample have requirements in place for the NEOs. For the CEO, the median guideline (expressed as a multiple of base salary) is 6x and for other NEOs it is 3x.
| Stock Ownership
Guideline |
Median Multiple of Base Salary | ||
| CEO | CFO | Other NEO | |
| 95% | 6x | 3x | 3x |
Many companies (52%) have a stock holding requirement in place in addition to the stock ownership guideline requirement for senior executives. It continues to be less common for companies to have stock holding policies that are independent of stock ownership guidelines, or that apply after the ownership requirement has been achieved. These holding policies require executives to hold net shares received from equity awards for periods ranging from one year (most common) to post-retirement. These are generally viewed as shareholder friendly, yet their prevalence has remained fairly consistent over the past few years.
| Holding Requirement Until SOG is Met | Holding Requirement Separate from or After SOG is Met | Holding Period for Separate/Post-SOG Requirements (n=26) | |||
| 1 Year | 5 Years | Until Retirement | Post Retirement | ||
| 52% | 22% | 54% | 4% | 23% | 19% |
For questions or more information, please contact:
Melissa Burek Partner
[email protected] 212-921-9354
Lauren Peek Principal
[email protected] 212-921-9374
CAP’s Industry Report summarizes 2016 Chief Executive Officer (CEO) compensation relative to 2016 company performance, as well as incentive compensation practices, for a sample of 19 large U.S.-based Consumer Product companies.
2016 Company Performance
2016 was a mixed performance year for the companies in CAP’s Consumer Products sample. While profitability improved, total shareholder return (TSR) underperformed the broader market.
GAAP revenue for CAP’s sample decreased -1% at median during 2016, following a -2% decrease in 2015. The continued strengthening of the U.S. dollar has contributed to FX headwinds for the companies in CAP’s sample, as they have significant international exposure – on a consolidated basis, 45% of fiscal 2016 revenue was generated overseas. Adjusted revenue, a common incentive plan performance metric, which is generally reported on an FX-neutral basis, increased +3% and +4% at median in 2016 and 2015, respectively.
Operating margin (defined as earnings before interest and taxes, or EBIT, divided by revenue) and earnings per share (EPS) growth improved year-over-year on both a GAAP and adjusted basis. Continued focus on cost savings and productivity has helped to boost profitability among companies in CAP’s Consumer Products sample. Industry consolidation and improvements in product mix have also contributed to margin expansion.
For the full year 2016, median TSR for companies in CAP’s Consumer Products sample was +5%, below the median TSR for the S&P 500 of +13%. Companies in CAP’s sample did not experience the same post-election stock price rally enjoyed by the broader market. Through November 8, 2016, the median TSR for CAP’s sample kept pace with the median TSR for the S&P 500 +10% to +8%, respectively. During the remainder of the year, however, median TSR for CAP’s sample was -1%, while the median TSR for the S&P 500 was +4%.
| Year | Median Financial Performance for CAP’s Consumer Products Sample | |||||
| Revenue Growth | Operating Margin | EPS Growth | ||||
| GAAP | Adjusted | GAAP | Adjusted | GAAP | Adjusted | |
| 2016 | -1% | +3% | 16% | 18% | +8% | +12% |
| 2015 | -2% | +4% | 15% | 16% | +4% | +4% |
| Y/Y Change | +1% pts | -1% pts | +1% pts | +2% pts | +4% pts | +8% pts |
| Group | Median TSR – CAP’s Consumer Products Sample vs. S&P 500 | |||
| 2015 | 2016 | |||
| 1/1 to 11/8 | 11/9 to 12/31 | Full Year | ||
| CAP’s Consumer Products Sample | +17% | +10% | -1% | +5% |
| S&P 500 | +1% | +8% | +4% | +13% |
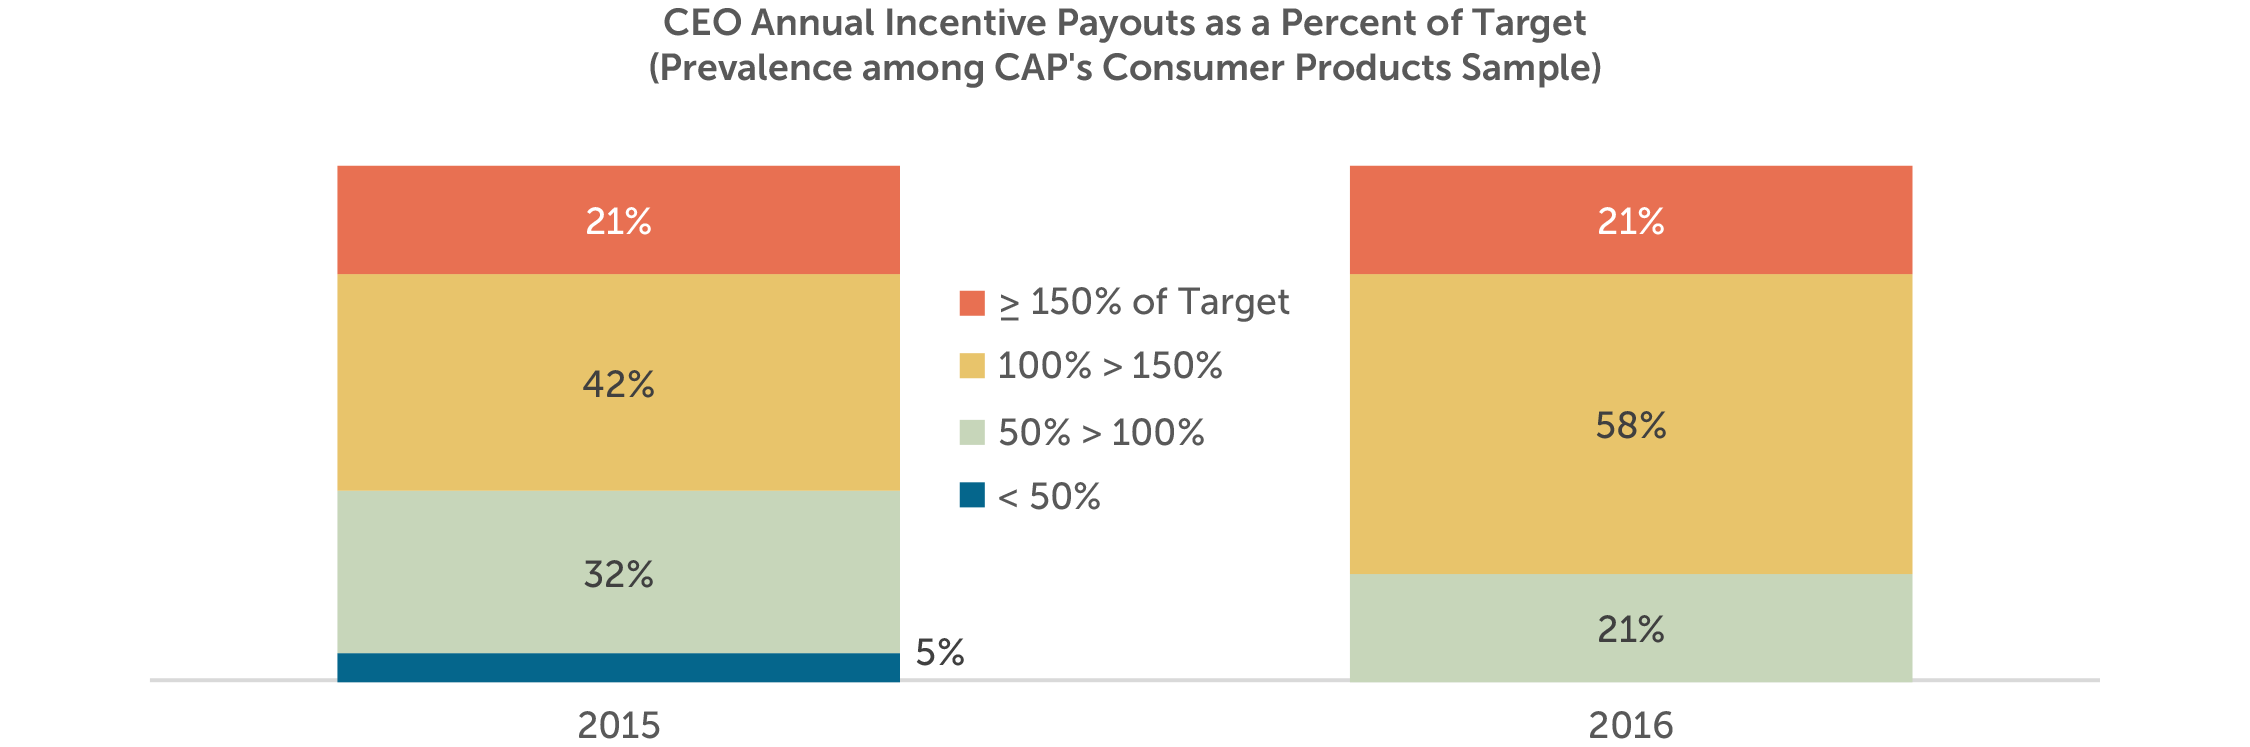
Annual Incentive Payouts for CEOs
At median, annual incentives for 2016 performance paid out at 117% of target, essentially unchanged from 2015 (118%). 75th percentile payouts were similarly flat – 140% for 2016, compared to 147% for 2015. However, payouts increased dramatically at the low end of the range, as the 25th percentile payout jumped from a below-target 74% for 2015, to an above-target 109% for 2016. More than a quarter of the companies in CAP’s Consumer Products sample paid an above-target bonus for 2016, after paying a below-target bonus for 2015.
| Summary Statistic | CEO Annual Incentive Payouts as a Percent of Target | |
| 2015 | 2016 | |
| 75th Percentile | 147% | 140% |
| Median | 118% | 117% |
| 25th Percentile | 74% | 109% |
Consistent with the year-over-year trend in payouts as a percent of target, 2016 payouts on a dollar value basis were unchanged from 2015, which is generally aligned with adjusted financial performance which was unchanged year-over-year.
Changes in CEO Target Compensation
The median change in target total direct compensation (defined as the sum of base salary, target annual incentive, and long-term incentives) was 5% from 2015 to 2016, driven primarily by increases in variable compensation: the median increase in long-term incentive award values was 5% and the median increase in target annual incentive award values was 3%.
For 2016, just over half of the CEOs in CAP’s Consumer Products sample received a base salary increase. The median increase was 2%.
In reaction to external pressure, boards of directors are increasing CEOs’ accountability for sustained performance. To that end, boards are turning to long-term incentives to reward executives, often in lieu of increases to annual incentives and base salaries.
| Compensation Element | 2015-16 Median Change in CEO Compensation |
| Base Salary | 2% |
| Target Annual Incentive Award Value | 3% |
| Long-Term Incentive Award Value | 5% |
| Target Total Direct Compensation | 5% |
Incentive Compensation Practices: Annual and Long-Term Incentives
85% to 90% of target total direct compensation for CEOs of large U.S.-based companies comprises variable compensation (i.e., annual and long-term incentives). Among the companies in CAP’s Consumer Products sample, variable compensation accounts for 89% of target total direct compensation, on average.
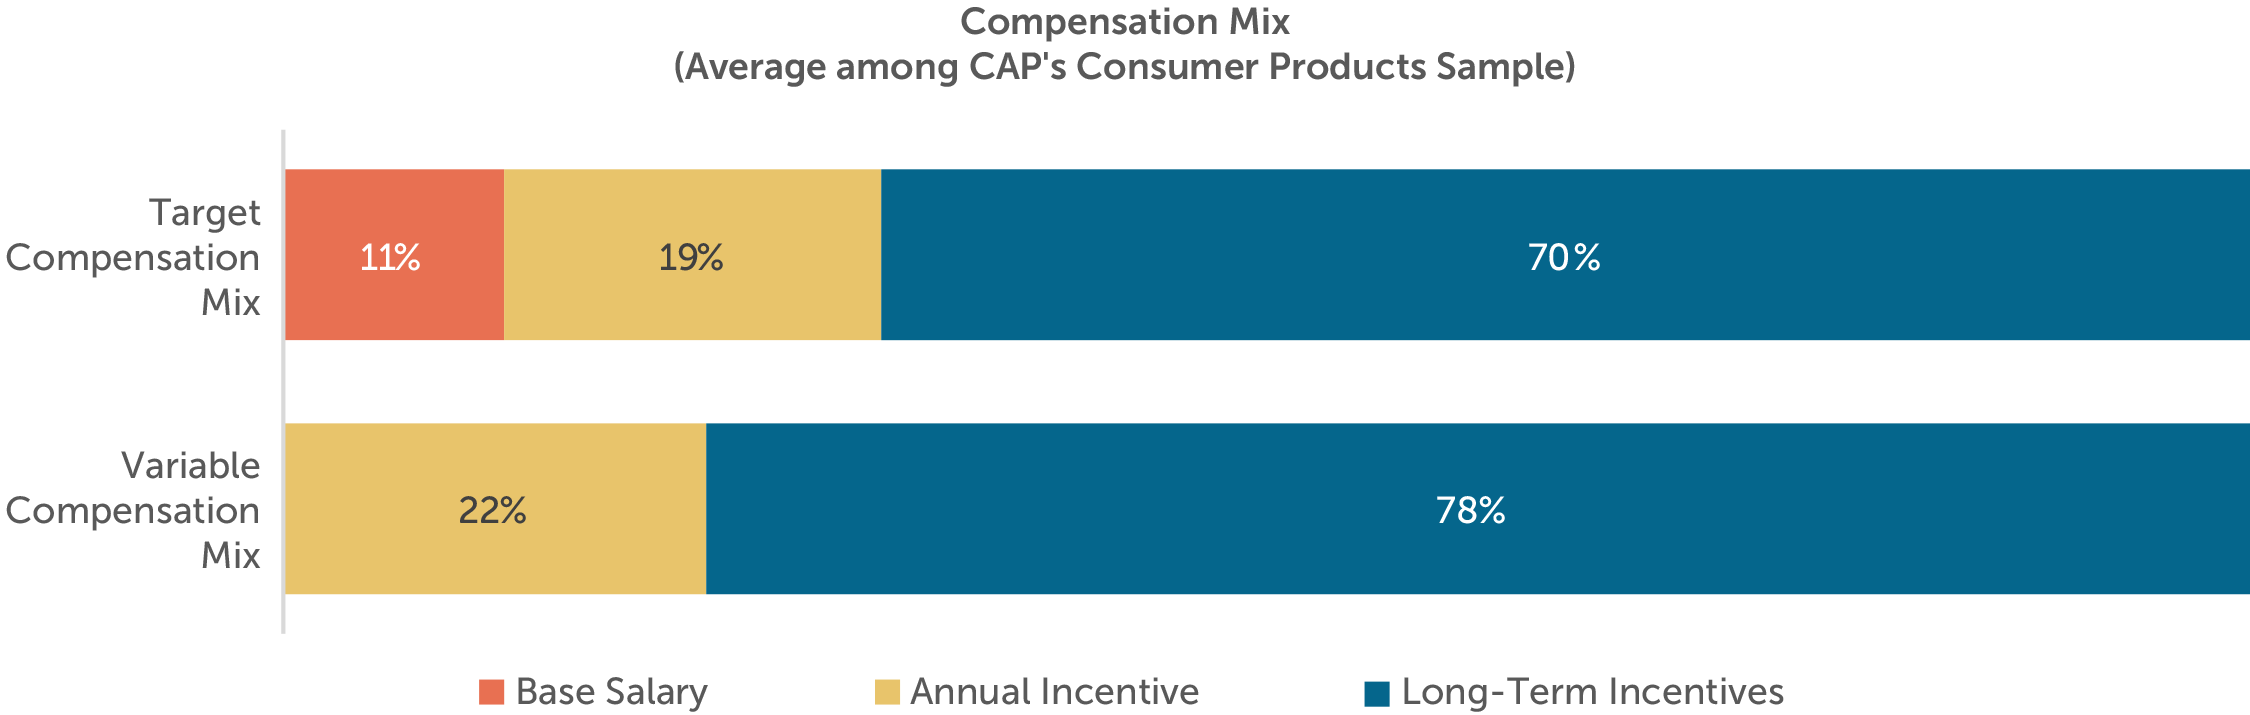
Annual Incentives
Annual incentives encourage and reward successful performance against short-term company and/or individual objectives. For the companies in CAP’s Consumer Products sample, annual incentives make up 19% of target total direct compensation, on average.
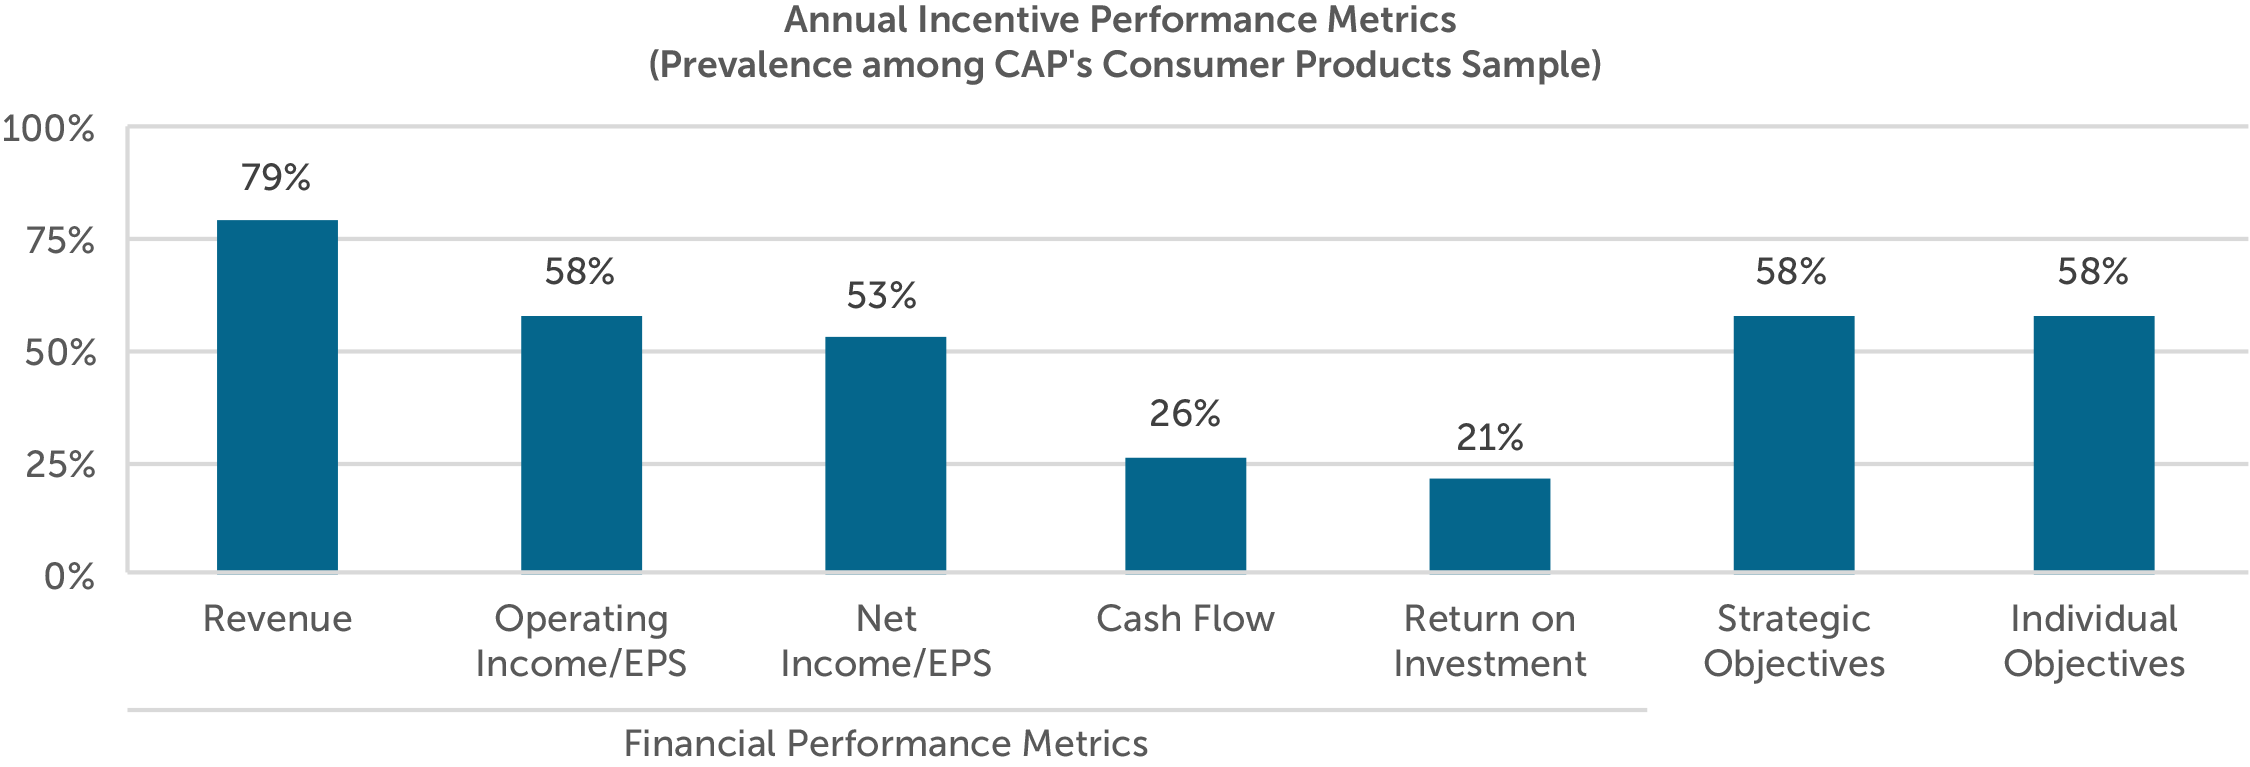
Performance Metrics
The objectives underlying annual incentive plans are often associated with short-term growth and profitability. Accordingly, among the companies in CAP’s Consumer Products sample, revenue, operating income (or EPS), and net income (or EPS) are the most common financial performance metrics – 100% of companies use at least one of these metrics, and nearly 75% of companies balance the use of a “top-line” revenue metric with one or more “bottom-line” income metrics.
Revenue and income are typically measured on an adjusted, as opposed to GAAP, basis. For instance, two-thirds of the companies in CAP’s sample that use revenue growth as an annual incentive performance metric use FX-neutral revenue growth. Other common adjustments to revenue and/or income include the exclusion of results from businesses acquired or divested during the performance year, as well as one-time gains or charges, such as those related to corporate restructuring.
Annual incentive metrics measuring performance against strategic objectives are also common among companies in CAP’s Consumer Products sample. Workplace diversity is considered by more than half of the companies that use strategic metrics. Innovation, cost savings, and market share are also prevalent strategic metrics; each are used by approximately one third of the companies that use strategic metrics.
58% of the companies in CAP’s Consumer Products sample consider individual performance in the determination of the CEO’s annual incentive award. Among these companies, the way in which individual performance impacts the annual incentive award is mixed. Some companies include individual performance as a discrete additive component in the annual incentive formula. Others use individual performance to modify awards; this can be done objectively, using a “multiplicative modifier,” or on a more subjective, discretionary basis.
Long-Term Incentives
Long-term incentives tie executive compensation to performance against the company’s longer-term objectives. Awards are typically delivered using equity-based vehicles with multi-year vesting periods; this helps to align the interests of executives with those of shareholders, and serves as a retention incentive. For the companies in CAP’s Consumer Products sample, long-term incentives make up 70% of target total direct compensation, on average.
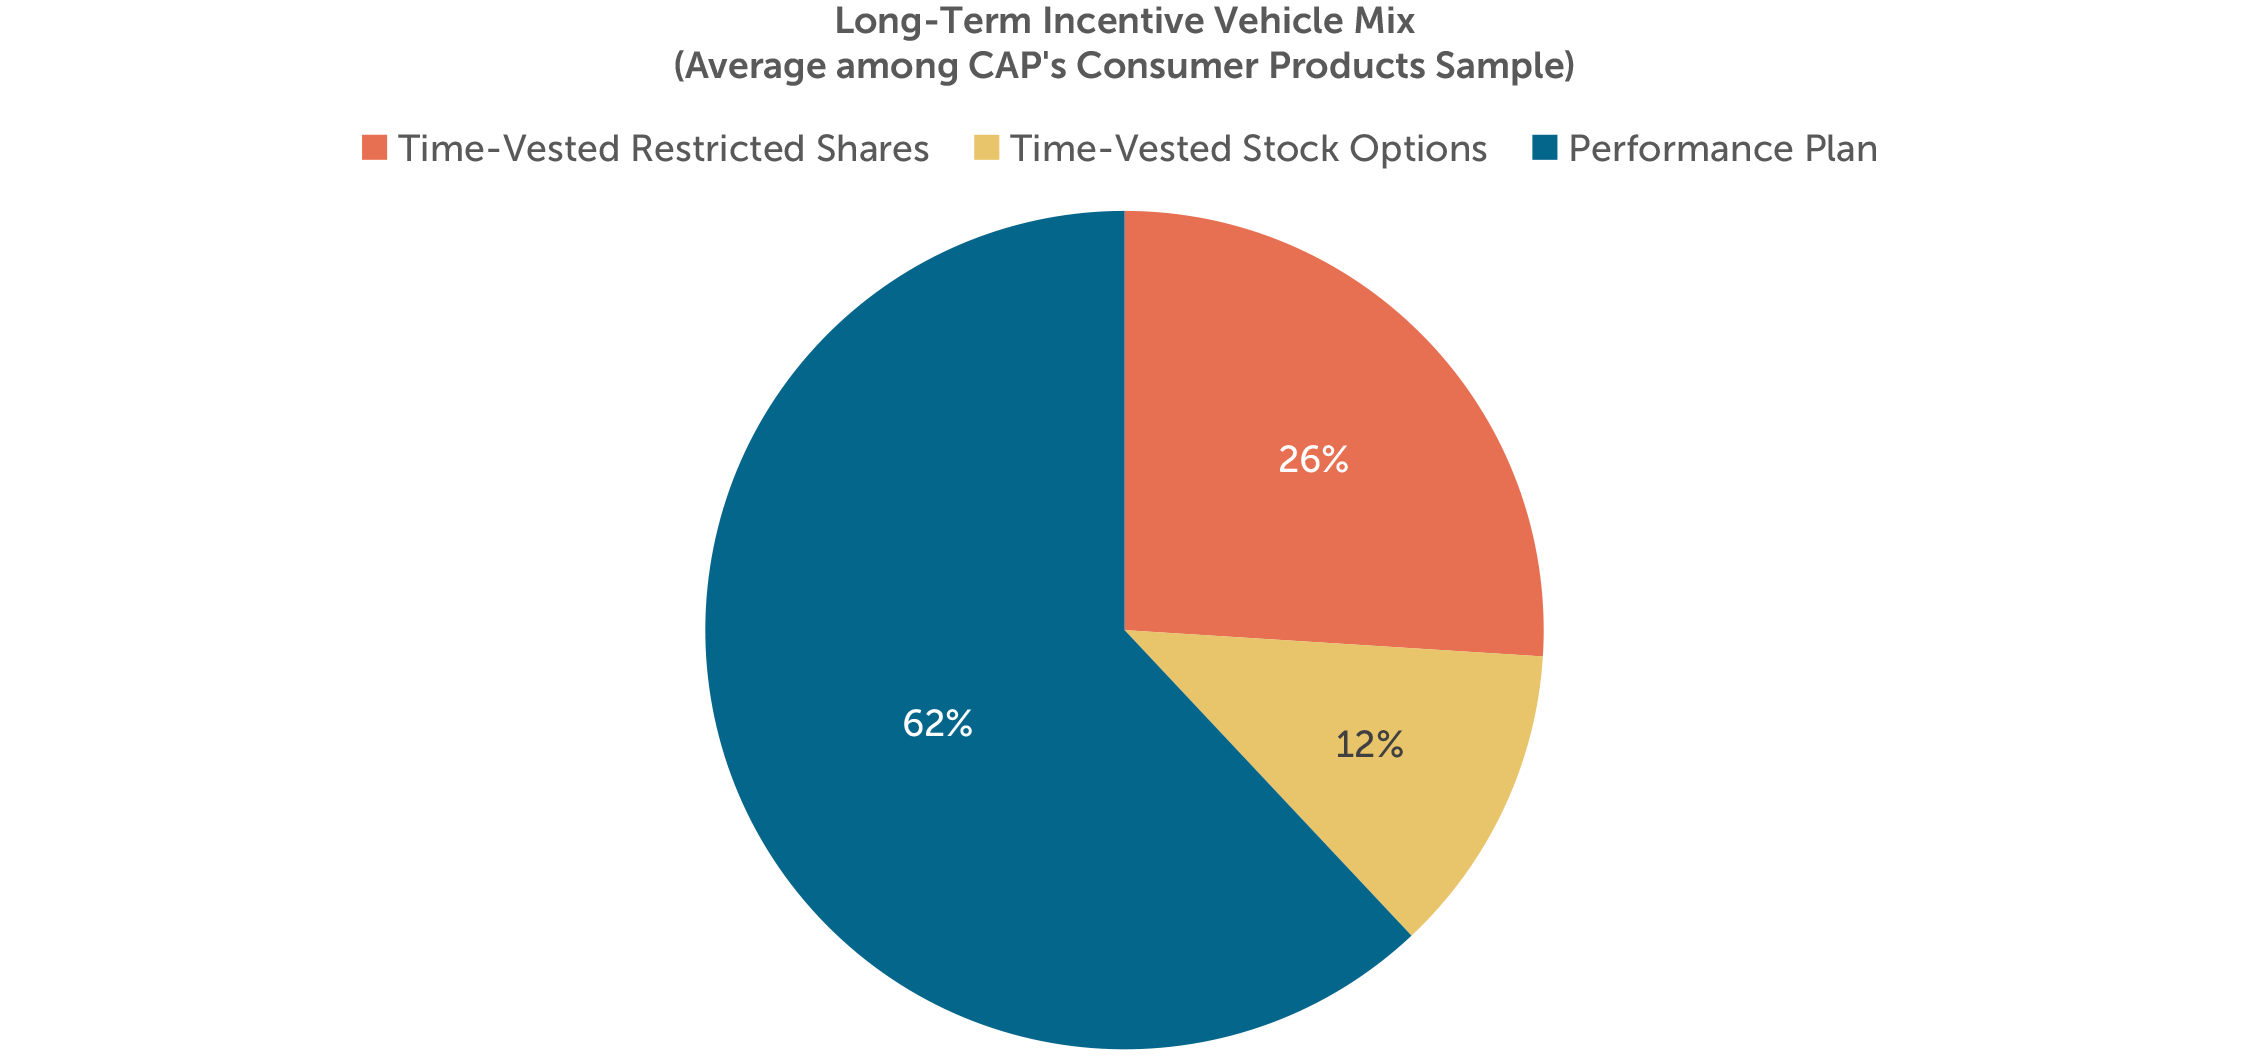
Vehicle Mix
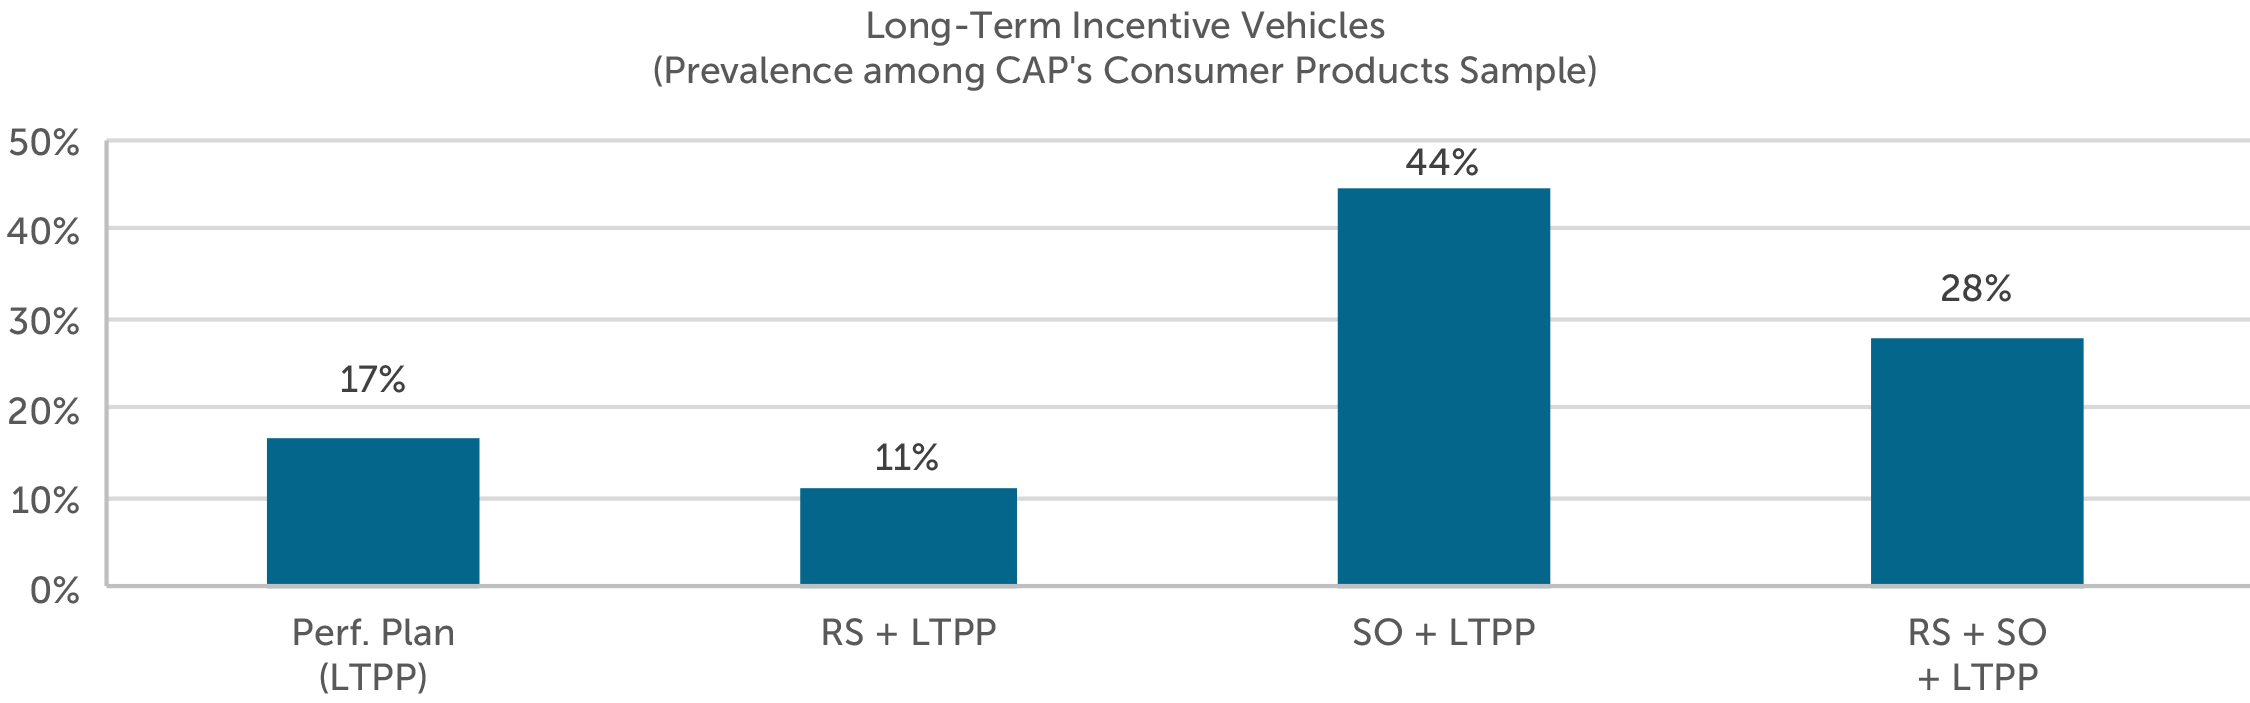
Long-term incentive vehicles can be bucketed into three broad categories: (1) time-vested restricted shares (or units); (2) time-vested stock options (or stock appreciation rights); and (3) performance plans. Performance plans include performance shares (or units), performance-vested stock options, and performance-based cash compensation with multi-year performance criteria.
All of the companies in CAP’s Consumer Products sample use a performance plan to deliver long-term incentives to the CEO. However, the use of a performance plan as the exclusive long-term incentive vehicle is uncommon: 44% and 11% of companies in CAP’s sample mix a performance plan with time-vested stock options and time-vested restricted shares, respectively. 28% of companies use all three vehicles.
Performance Metrics
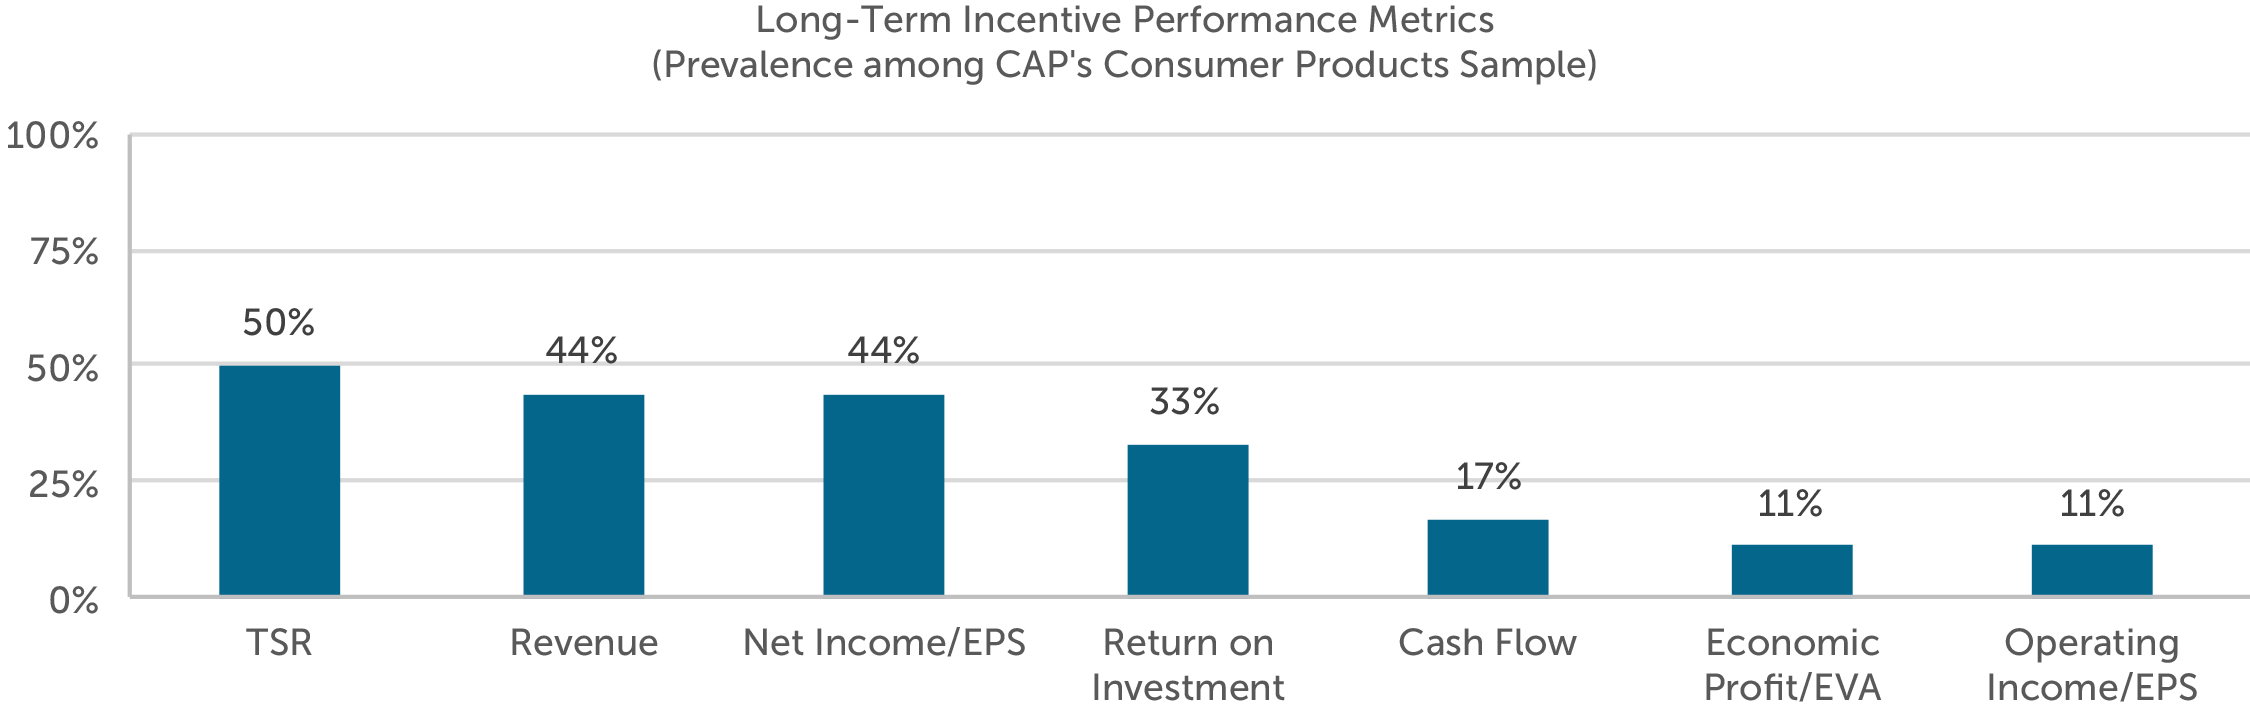
While annual incentives emphasize short-term growth and profitability, long-term incentives generally encourage and reward long-term value creation. Approximately four-fifths of the companies in CAP’s Consumer Products sample use one or more return metrics in the long-term incentive plan: TSR is used by 50% of companies, return on investment is used by 33% of companies, and economic profit is used by 11% of companies. All of the companies that use TSR measure performance on a relative basis against a company-defined peer group or broad-market index. Among the companies that use relative TSR, 67% use one or more additional absolute performance metrics.
Conclusion
Similar to other industries, Consumer Product companies are not immune to macroeconomic factors and external challenges impacting their businesses. Between taxes on soda, competition from store brands / smaller upstarts, battle for shelf space and health conscious consumers, consumer product companies are facing a decrease in sales volume and market share. The shift in shopper preferences has continued in 2017 and will force these companies to find new ways to increase profitability and market share.
As a result of this competition, companies are balancing strategic objectives and individual performance with top-line growth and bottom-line performance in their incentive plan design. Boards and management will need to continue to reinforce the emphasis on pay and performance and ensure that the appropriate behaviors and results are being rewarded, performance targets are reflective of the long-term strategy and incentive plan design supports current business needs.
Boards and management need to be mindful that as incentive plan metrics are tied to adjusted financials, proxy advisory firms will be using GAAP metrics when calculating the pay for performance relationship, which can vary greatly from the adjusted metrics. This may impact the pay for performance alignment and impact the Say on Pay vote if the proxy advisory firm recommends Against Say on Pay.
For questions or more information, please contact:
Dan Laddin Partner [email protected] 212-921-9353
Shaun Bisman Principal [email protected] 212-921-9365
Kyle Eastman Associate [email protected] 212-921-9362
Ryan Colucci Associate [email protected] 646-486-9745
Kyle Clemenza and Rebecca Wertman provided research assistance for this report.
CAP’s Consumer Products Sample
Altria Group, Inc.
Avon Products, Inc.
Campbell Soup Company
The Clorox Company
The Coca-Cola Company
Colgate-Palmolive Company
Conagra Brands, Inc.
The Estée Lauder Companies Inc.
General Mills, Inc.
The J. M. Smucker Company
Kellogg Company
Kimberly-Clark Corporation
Mondelēz International, Inc.
Newell Brands Inc.
NIKE, Inc.
Pepsico, Inc.
The Procter & Gamble Company
Starbucks Corporation
Christopher Y. Clark, publisher of NACD Directorship Magazine, hosts this edition of NACD BoardVision with guest Melissa Burek, partner at Compensation Advisory Partners. The discussion centers around the obvious and no so obvious results from say on pay voting, how performance fits into the results, and what surprises could be ahead in 2014.
Companies use annual bonuses as a tool to reward executives for achieving short-term financial and strategic goals. Setting appropriate annual performance goals is essential to establishing a link between pay and performance. Goals should achieve a balance between rigor and attainability to motivate and reward executives for driving company performance and creating returns for shareholders.
Key Takeaways:
- Based on our analysis of actual incentive payouts over the past 6 years, the degree of difficulty, or “stretch”, embedded in annual performance goals translates to:
- A 95% chance of achieving at least Threshold performance
- A 75% chance of achieving at least Target performance
- A 15% chance of achieving Maximum performance
- This pattern indicates that target performance goals are challenging, but attainable, and maximum goals are achievable through highly superior performance
- The majority of companies use two or more metrics when assessing annual performance
- Annual incentive payouts have been directionally linked with earnings growth over the past 6 years
Summary of Findings
Plan Design
For the purposes of this study, we categorized annual incentive plans as either goal attainment or discretionary. Companies with goal attainment plans define and disclose threshold, target and maximum performance goals and corresponding payout opportunities. Alternatively, companies with discretionary plans do not define the relationship between a particular level of performance and the corresponding payout. Discretionary programs provide committees with the opportunity to determine payouts based on a retrospective review of performance results.
| Annual Incentive Plan Type | |||
| Industry | Sample Size | Goal Attainment | Discretionary |
| Auto | n= 8 | 100% | 0% |
| Consumer Discretionary | n= 10 | 90% | 10% |
| Consumer Staples | n= 12 | 67% | 33% |
| Financial Services | n= 12 | 17% | 83% |
| Healthcare | n= 9 | 89% | 11% |
| Industrials | n= 14 | 71% | 29% |
| Insurance | n= 12 | 67% | 33% |
| IT | n= 12 | 83% | 17% |
| Pharma | n= 10 | 80% | 20% |
| Total | 72% | 28% | |
Consistent with the findings from our study conducted in 2014, 72% of sample companies have goal attainment plans. Our study focuses on these companies.
Performance Metrics
Most companies (61%) use 3 or more metrics to determine bonus payouts. This reflects a shift from 2014, where 48% of companies used 3 or more metrics. Companies annually review metrics to ensure that they align with the business strategy.
Many companies use financial metrics such as revenue and profitability, which are indicators of market share growth and stock price performance. Some bonus plans also include strategic metrics, which incentivize executives to achieve goals that may contribute to long-term success, but may not be captured by short-term financial performance. Companies in the pharmaceutical industry often use strategic goals, such as pipeline development. Similarly, companies with large manufacturing operations often use quality control metrics.
| # of Metrics Used in Goal Attainment Plan | ||||
| Industry | 1 Metric | 2 Metrics | 3 Metrics | 4+ Metrics |
| Auto | 13% | 13% | 25% | 50% |
| Consumer Discretionary | 11% | 44% | 45% | 0% |
| Consumer Staples | 0% | 37% | 38% | 25% |
| Financial Services | 0% | 50% | 50% | 0% |
| Healthcare | 0% | 38% | 12% | 50% |
| Industrials | 20% | 40% | 20% | 20% |
| Insurance | 37% | 13% | 25% | 25% |
| IT | 10% | 30% | 40% | 20% |
| Pharma | 0% | 0% | 63% | 37% |
| Total | 11% | 28% | 34% | 27% |
Pay and Performance Scales
Compensation committees annually approve threshold, target, and maximum performance goals, and corresponding payout opportunities, for each metric in the incentive plan. Target performance goals are typically set in line with the company’s internal business plan. Executives most often earn 50% of their target bonus opportunity for achieving threshold performance and 200% for achieving maximum performance. Actual payouts are often interpolated between threshold and target and target and maximum.
Annual Incentive Plan Payouts Relative to Goals
All Companies
Based on CAP’s analysis, companies paid annual bonuses 95% of the time. Payouts for the total sample are distributed as indicated in the following charts:
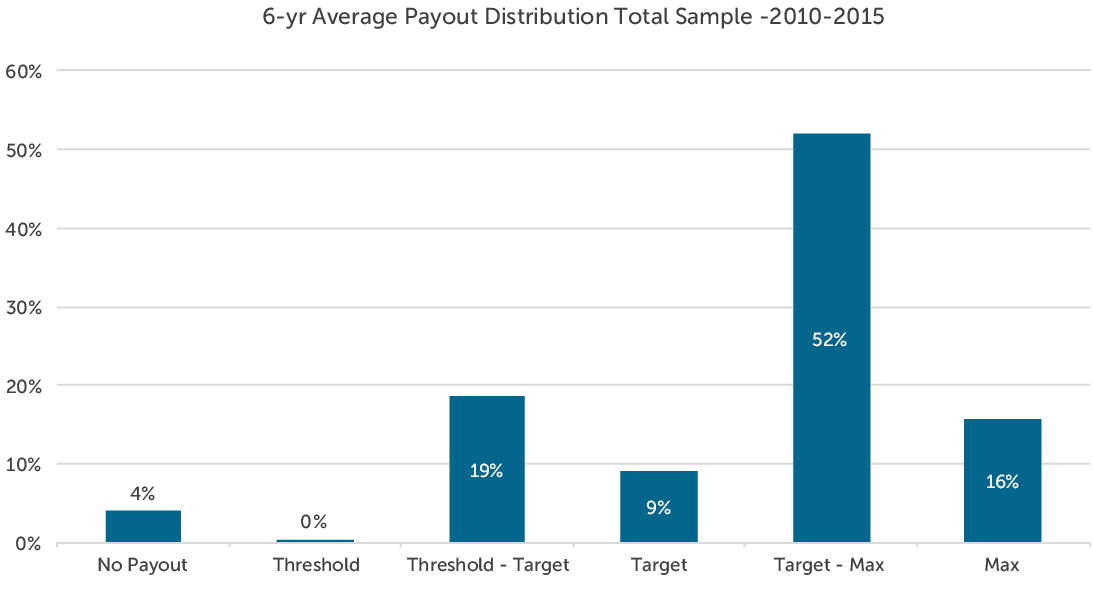
This payout distribution indicates that committees set annual performance goals with a degree of difficulty or “stretch” such that executives have:
- A 95% chance of achieving at least Threshold performance
- A 75% chance of achieving at least Target performance
- A 15% chance of achieving Maximum performance
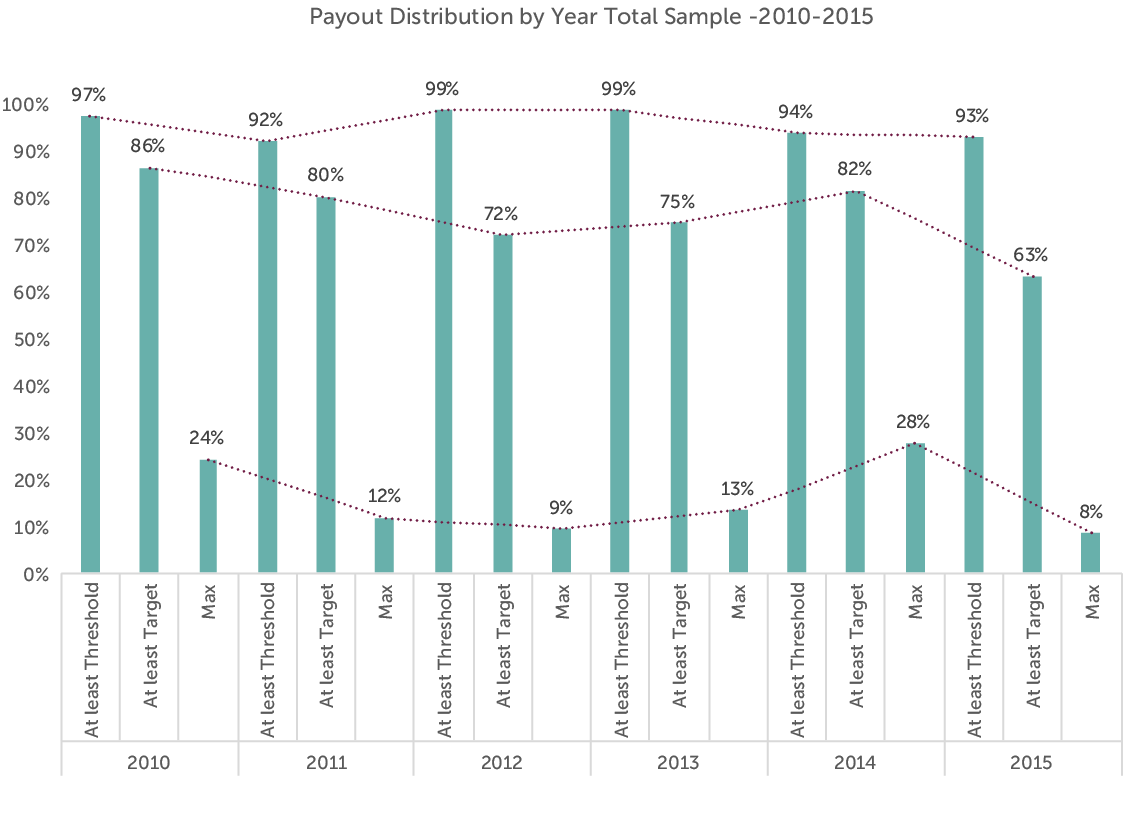
From 2010-2015, no more than 10% of companies failed to reach threshold performance in any given year. By comparison, in both 2008 and 2009, which were challenging years, approximately 15% of companies failed to reach threshold performance goals.
When looking back over 8 years (2008-2015), companies achieved at least threshold and target performance with slightly less frequency. Based on CAP’s analysis of this 8-year period, executives have:
- A 90% chance of achieving at least Threshold performance
- A 70% chance of achieving at least Target performance
- A 15% chance of achieving Maximum performance
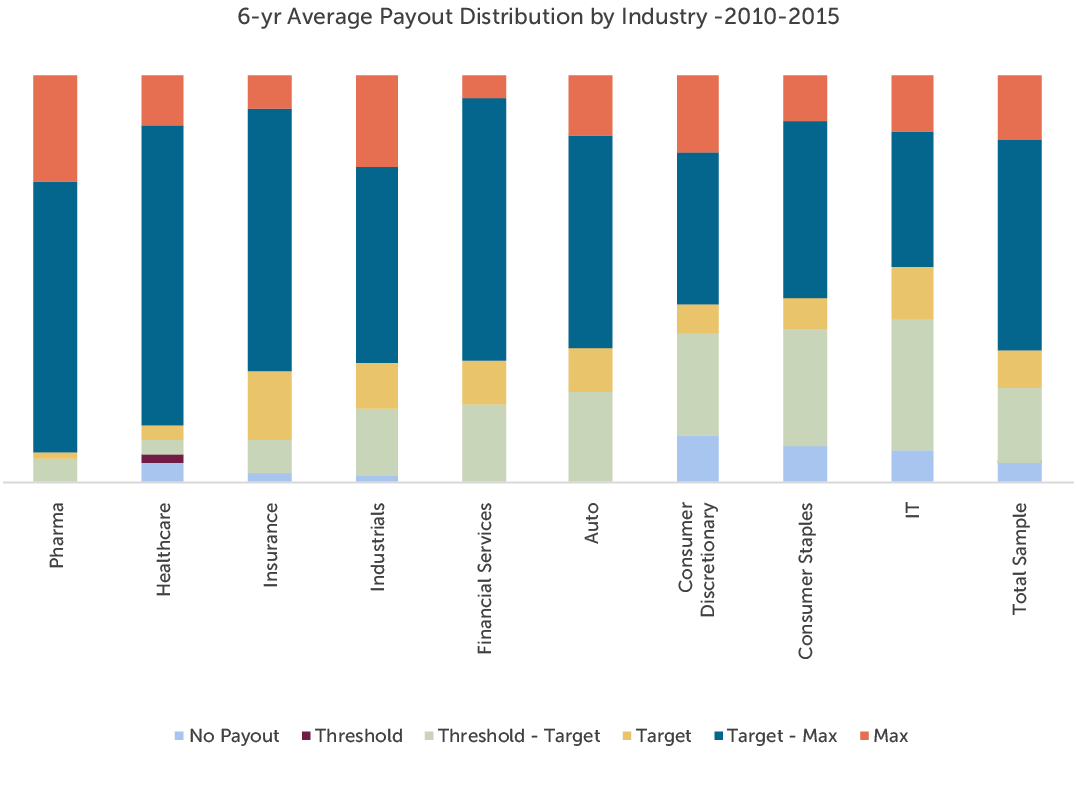
By Industry
Pharmaceutical and healthcare companies have paid at or above target more frequently than companies in any other industry over the past 6 years. Both industries have experienced significant growth over the period in part due to consolidation. The companies in the IT, Consumer Discretionary and Consumer Staples industries tend to pay below target at a higher rate. Average payouts for each industry are distributed as indicated in the following chart:
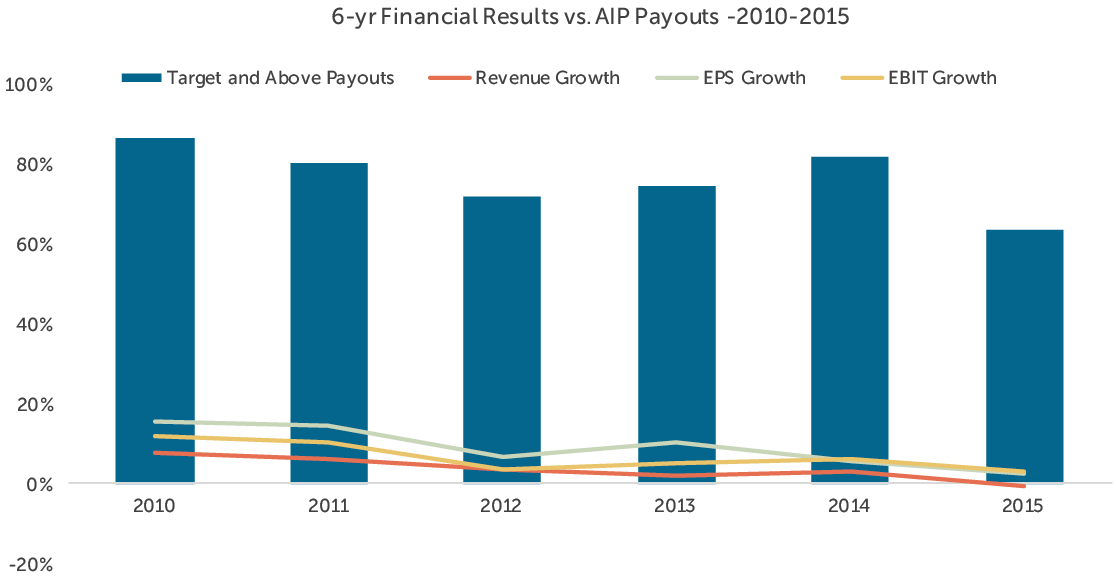
Relative to Performance
CAP reviewed the relationship between annual incentive payouts and company performance with respect to three metrics: revenue growth, earnings per share (EPS) growth and earnings before interest and taxes (EBIT) growth. While payouts were generally aligned with revenue and EPS growth, they most closely tracked with EBIT growth over the period studied (2010-2015). Companies may seek to align bonus payouts with operating measures, such as EBIT, as they capture an executive’s ability to control costs and improve operational efficiency.
The chart below depicts the relationship between median revenue, EPS, and EBIT growth and target and above annual incentive payouts among the companies studied.
Conclusion
In the first quarter of 2017, committees will certify the results and payouts for the fiscal 2016 bonus cycle and approve performance targets for fiscal 2017. Given the uncertain economic outlook following the 2016 presidential election, establishing performance targets for 2017 may be more challenging than usual. Companies may choose to use a range of performance from threshold to maximum to build flexibility into their plans given the unpredictable environment. Our study of annual bonus payouts over the past 6-8 years supports setting goals such that the degree of difficulty, or “stretch”, embedded in performance goals translates to:
- A 90-95% chance of achieving at least Threshold performance
- A 70-75% chance of achieving at least Target performance
- A 15% chance of achieving Maximum performance.
Companies should continue to set target performance goals that are challenging, but attainable and maximum goals that are achievable through outperformance of internal and external expectations – therefore, establishing a bonus plan that is attractive to executives and responsible to shareholders.
Methodology
CAP’s study consisted of 100 companies from 9 industries, selected to provide a broad representation of market practice across large U.S. public companies. The revenue size of the companies in our sample ranges from $18 billion at the 25th percentile to $70 billion at the 75th percentile.
CAP analyzed the annual incentive plan payouts of the companies in the sample over the past 6-8 years to determine the distribution of incentive payments and the frequency with which executives typically achieve target payouts. In this analysis, CAP categorized actual bonus payments (as a percent of target) into one of six categories based on the following payout ranges:
| Payout Category | Payout Range |
| No Payout | 0% |
| Threshold | Up to 5% above Threshold |
| Threshold – Target | 5% above Threshold to 5% below Target |
| Target | +/- 5% of Target |
| Target – Max | 5% above Target to 5% below Max |
| Max | 5% below Max to Max |


