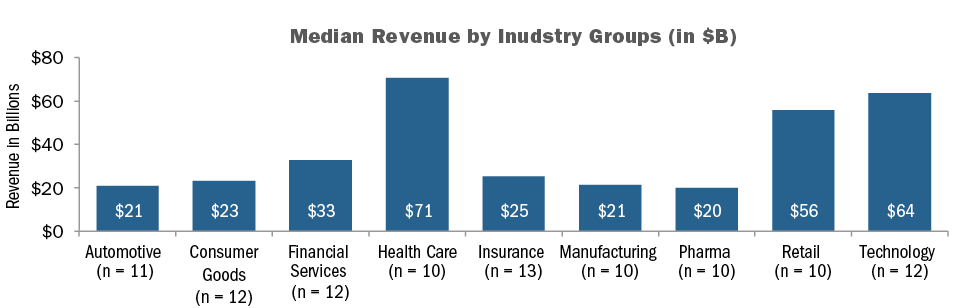
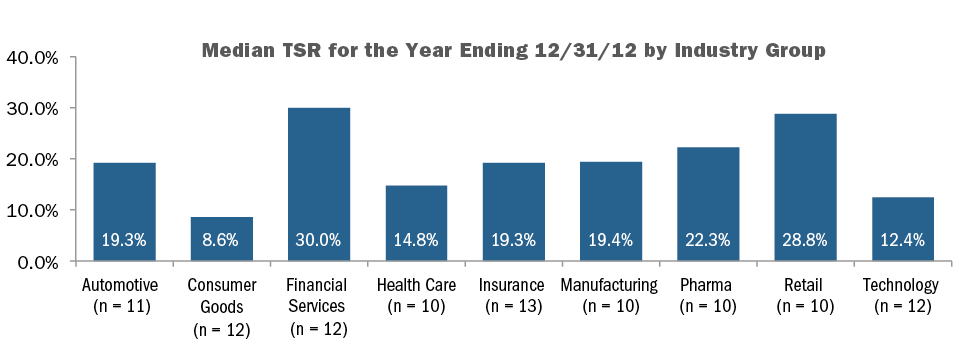
Among the 100 company sample, median revenue was $33B, median market capitalization was $37B and median Total Shareholder Return (TSR) was 19% in 2012.
What We Found
Although shareholder support for Say on Pay has been increasing year-over-year with a significant majority of companies receiving over 90% support, companies continue to regularly review and modify their executive compensation programs in response to shareholders, proxy advisory firms and good governance practices. Consistent with our findings last year, companies continue to modify clawback policies and scale back perquisites. New to our research in 2013, hedging /pledging polices have also gained traction as a result of Dodd-Frank and ISS’ policies.
Dodd Frank
The Dodd Frank Wall Street Reform and Consumer Protection Act (Dodd Frank) was signed into law in 2010 and will require the following governance practices:
- Companies must implement a clawback policy for executive officers that allows for recoupment of any incentive compensation, with a three-year look back, due to any restatements
- Companies must disclose whether they have a policy that prohibits hedging of company shares (e.g., through the purchase of derivatives that protect executives from stock price swings)
- Companies must disclose whether they have a policy to address pledging of company shares (e.g., as collateral for a loan)
The SEC has yet to release guidance on these areas and the timing of future guidance is uncertain. As such, many companies have taken steps to implement policies on their own.
Clawbacks
Dodd Frank requires a broader definition of clawbacks compared to Section 304 of SOX, which applies to CEOs and CFOs. When clawback policies were first adopted by Dodd Frank many companies took a “wait and see” approach; however, with the continued delay in final regulations, companies have been more proactive in modifying their policies.
Nearly all of our research companies – 94 of 100 (94%) – have some form of clawback policy, compared to 86% and 80% in 2011 and 2010, respectively. In 2012, 10 companies adopted a new policy and 11 modified existing provisions. The two industries that saw the most changes to their clawback polices included automotive (45% of companies) and financial services (45% of companies). Typically financial services firms expanded their clawback policies to cover all incentive awards and situations beyond just financial restatements.
As was the case in prior years, a financial restatement (83%) and misconduct (75%) are the most common triggers for a clawback.
Under nearly all policies, it is most common for companies to include the ability to recoup compensation previously granted and it is less prevalent to clawback any future incentive compensation. While the final rules are not expected to include future compensation, we expect companies that already have this provision may continue to include it.
|
Compensation Subject to Clawback |
2012 |
2011 |
2010 |
|||
|
No. of cos |
% of Cos. n=94. |
No. of cos. |
% of Cos. N=98 |
No. of Cos. |
% of Cos. n=89 |
|
|
Prior LTI |
88 |
95% |
95 |
97% |
79 |
89% |
|
Prior Annual Incentive |
86 |
92% |
92 |
94% |
81 |
91% |
|
Future Annual Incentive |
19 |
20% |
16 |
16% |
20 |
22% |
|
Future LTI |
18 |
19% |
15 |
15% |
14 |
16% |
Note: Percentages add up to greater than 100% due to multiple responses
Coverage extends to NEOs in 91% of companies, which is consistent with our findings in 2010 and 2011. Of the other 9% of companies, most define coverage as, “executive officers, officers, senior executives or senior management.” Companies are not required to disclose the level of program detail in the proxy, but we expect most program provisions are more broad-based.
Similar to our findings in 2010 and 2011, less than a quarter of companies indicate the length of the look-back period during which compensation can be recovered after a financial restatement. Of the 20 companies that disclosed a time frame, the most common is 1 year (47% of companies) from date of restatement, followed by 3 years (26% of companies). While not common practice, some companies disclose a different time period for annual incentives and long-term incentives.
While many companies are waiting for the SEC to adopt final rules before making comprehensive changes to their policies, companies have been proactive over the last 3 years in adopting clawback policies. On their own merits, such provisions:
- Provide the Board with flexibility to clawback for unforeseen circumstances
- Allow flexibility for the Board to access whether the reinstatement had implications for shareholders (e.g., economic issue or accounting issue)
- Increase executive accountability
- Garner positive reaction from shareholders
- Receive credit by ISS in the QuickScore evaluation (under Equity Risk Mitigation topic)
As we await for the SEC to propose final rules, there are several practical challenges to clawing back compensation, such as how to clawback equity gains, how to claw back from former employees and the tax implications of clawbacks.
HeDGING AND PLEDGING
Hedging and pledging have become shareholder/ corporate governance issues, especially now that ISS views any hedging and significant pledging by insiders to be indicative of a potential failure of risk oversight on behalf of a company’s Board. The Board’s policy regarding these practices is most commonly reflected in the company’s insider trading policy, but it can be addressed through Board resolutions or a stand-alone policy.
Hedging is viewed as a poor practice as it insulates executives from stock price movement and reduces alignment with shareholders. Pledging, in modest amounts, may not be viewed as negatively as hedging, yet can become problematic if there were a significant decline in stock price and which necessitated a sale of shares. Given the potential negative perception of insider hedging and pledging, companies have begun to adopt policies to limit these provisions. Anti-hedging and pledging policies are in place at 91% and 59% of companies studied, respectively; 59% of companies have both policies in place and 32% only have a hedging policy.
|
Hedging / Pledging Policy |
2012 |
|
|
No. of cos |
% of Cos. n=100 |
|
|
Hedging |
91 |
91% |
|
Pledging |
59 |
59% |
|
Both |
59 |
59% |
|
Hedging Only |
32 |
32% |
Note: Percentages add up to greater than 100% due to multiple responses
An example of typical disclosure of a prohibition on hedging/pledging is reflected in PepsiCo’s proxy disclosure:
“Our insider trading policy prohibits executive officers from using any strategies or products (such as derivative securities or short-selling techniques) to hedge against the potential changes in the value of PepsiCo Common Stock. In addition, executive officers may not hold PepsiCo securities in a margin account or pledge PepsiCo stock or PepsiCo stock options as collateral for a loan.”
Pledging was not addressed in Dodd-Frank per se, and we do not know what the SEC’s position will be in the future. We do however expect more companies to adopt pledging policies going forward given ISS’ 2012 policy statement that identified pledging of company stock by executives as a poor practice.
To improve Say on Pay results, many companies have already have already implemented policies that prohibit hedging and pledging.
Perquisites
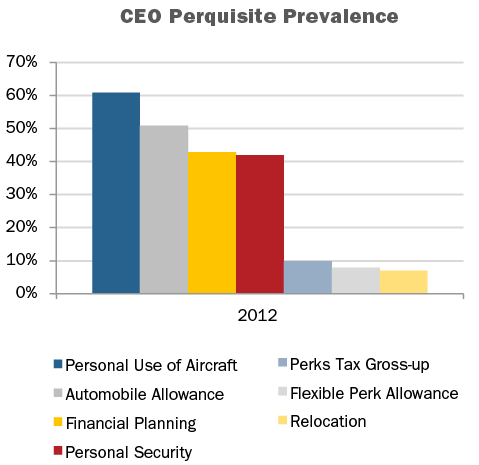
In 2012, companies in our research (91%) provided one or more perquisites to the CEO. Most commonly provided perquisites to the CEO include personal use of aircraft (61%), automobile allowance (51%), financial planning (43%) and personal security (42%).
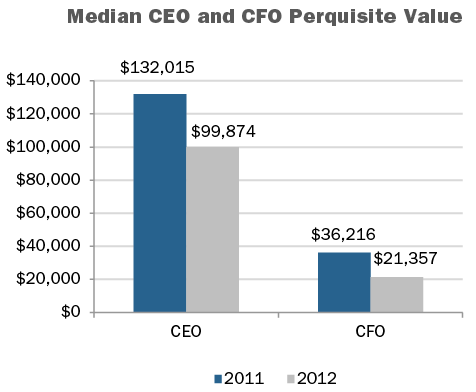
The value of perquisites offered to executives however, has continued to decrease. Median perquisite values disclosed for the CEO and CFO in 2012 were $99,874 and $21,357, respectively. This is a 32% decrease for CEOs and a 70% decrease in value for CFOs in our research. The manufacturing industry had the highest median perquisite values of $319,793 and $69,069 for the CEO and CFO, respectively.
Perquisites tend to be a small proportion of an executive’s total compensation, yet are often highly visible. Shareholders prefer to see pay delivered in performance-based vehicles vs. perquisite programs. Over the past few years, companies have been making changes to these programs in reaction to increased shareholder scrutiny and specific feedback received from shareholders or the likes of ISS or Glass Lewis. In 2012, 9 of 100 companies (9%) disclosed making a change to their perquisite program, a continuation of the trend to reduce perquisites that took hold several years ago.
|
Perquisite Change Reported in 2012 CD&A |
2012 |
2011 |
2010 |
|||
|
No. of Cos. |
% of Cos. n=9 |
No. of Cos. |
% of Cos. n=14 |
No. of Cos. |
% of Cos. n=20 |
|
|
Eliminated tax gross-ups on perquisites |
4 |
44% |
6 |
43% |
8 |
40% |
|
Eliminated perquisite |
2 |
22% |
9 |
64% |
11 |
55% |
|
Reduced perquisite program/value |
1 |
11% |
1 |
7% |
2 |
10% |
|
Changed perquisite program |
1 |
11% |
0 |
0% |
3 |
15% |
Note: Percentages add up to greater than 100% due to multiple responses
Occasionally, a company eliminates a perquisite and offsets some of the lost value or reduction through a salary increase or a one-time payment. An example from 2012 is Lear Corp, which disclosed the following:
“Effective January 1, 2012, we eliminated a separate annual perquisite allowance by adding this amount to the base salary of our Named Executive Officers. However, for purposes of determining incentive awards in 2012 and 2013, which are specified as a multiple of salary, the prior perquisite amount is excluded.”
Importantly, Lear excluded the amount of this increase for purposes of incentives, eliminating the potential to provide an even greater, unintentional increase, in total.
The changes in 2012 include two companies eliminating perquisite allowances, one company approving residential security measures for the CEO and one company reducing the allowance for personal use of aircraft for the CEO and CFO. We expect this trend to sustain as more and more companies are responding to the concerns of their shareholders, which can be voiced through a company’s Say on Pay vote.
Conclusions
With Say on Pay votes held annually for a majority of companies, we continue to see companies stay ahead of the curve and track “best practices” in order to satisfy shareholders and proxy advisory firms. This results in reevaluations of company pay and governance practices, and as our research shows, continued modification of perquisite programs and clawback policies, and adoption of hedging and pledging policies. The goal continues to be closer alignment of executive compensation with shareholder interests. We expect companies and Boards to more proactively monitor proxy advisory firm policies and Dodd-Frank legislation when considering changes to pay programs.
Among the 100 company sample, median revenue was $33B, median market capitalization was $37B and median Total Shareholder Return (TSR) was 19% in 2012. As indicated in the charts below, there is significant variation in company size and performance by industry.
COMPENSATION PHILOSOPHY
Nearly 60% of companies in our study disclose a target total pay position for the Named Executive Officers (“NEOs”). Of these companies, approximately 75% target total pay at median, up from 60% a year ago; indicating that companies are shifting their compensation pay philosophy to a market median standard in reaction to increased scrutiny from shareholders and proxy advisory firms.
|
Target Total Compensation Pay Positioning (n=57) |
CEO |
CFO |
|
Below Median |
1% |
0% |
|
At Median |
74% |
75% |
|
Above Median |
25% |
25% |
CAP Perspective: Change in targeted pay position to median reflects movement to adopt more conservative target pay practices that demonstrate a strong link to performance.
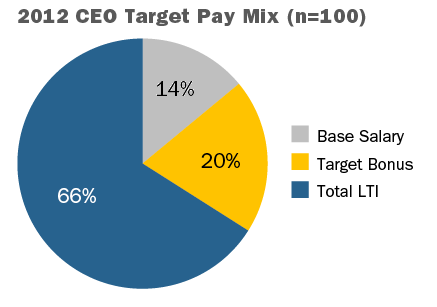
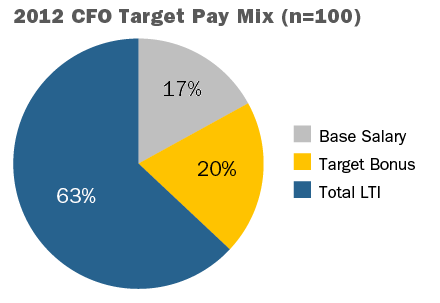
PAY MIX
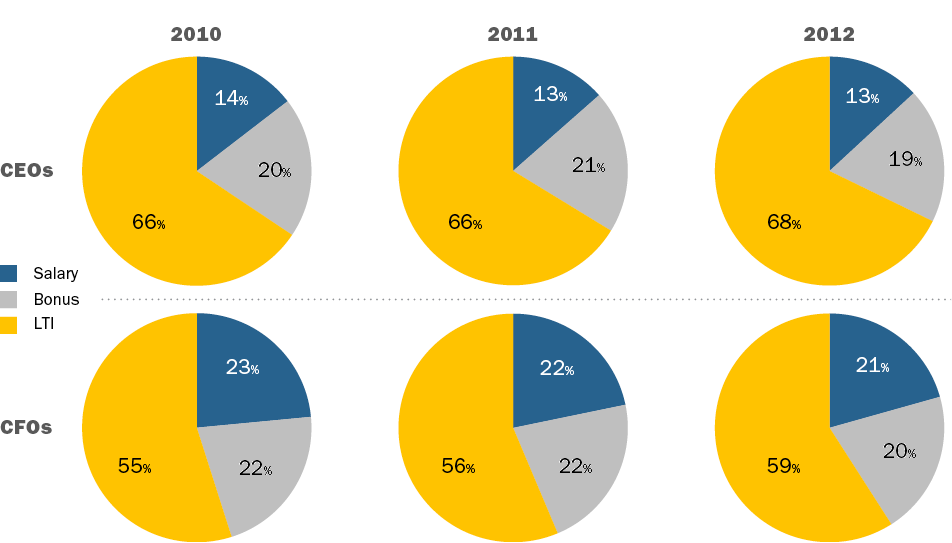
Overall, companies did not make significant shifts in the total pay mix in 2012 vs. 2011. CEO and CFO total pay continues to place significant emphasis on long-term incentives (“LTI”); on average, LTI reflects 66% of pay for CEOs and 63% for CFOs.
CHANGES IN TARGET PAY LEVELS
The chart below shows average year over year change in target pay levels for CEOs and CFOs in our study. 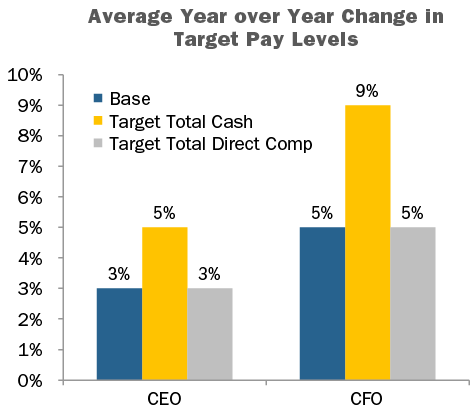
Note: Excludes newly hired/promoted executives and one-time sign-on/retention equity awards. Percentages include zeroes.
CAP Perspective: We see increases in target pay levels in the low single digits, though the most significant increase is in target annual incentive opportunities suggesting that companies are increasing performance-based pay to reinforce the pay-for-performance link.
Base Salary
CEO base salaries in 2012 increased 3%, on average, though only 46% of companies provided salary increases. Base salaries for CFOs increased by 5% though fewer companies provided an increase in 2012 (68%) vs. 2011 (78%) suggesting salary increases were made less frequently for senior executives than other employees.
Executives in the Health Care and Pharmaceutical industries were more likely to receive a salary increase (70% of CEOs in the Health Care industry and 90% of CFOs in the Pharmaceutical industry) than those in other industries. Financial Services, Insurance and Technology industries were less likely to provide a salary increase for the CEO in 2012.
|
Base Salary Action |
CEO |
CFO |
||
|
2012 |
2011 |
2012 |
2011 |
|
|
Increase |
46% |
47% |
68% |
78% |
|
No Change |
52% |
50% |
26% |
20% |
Note: Does not include newly hired CEOs or CFOs. Therefore, percentages do not add up to 100%.
Target Bonus
Target bonus for both the CEO and CFO increased modestly at median levels. At the 75th percentile, the bonus opportunity for CFOs increased by almost 20 percentage points. Target bonuses for CEOs in the Automotive, Consumer Goods and Technology industries increased the most in 2012. CFOs in the Automotive, Retail and Technology industries saw significant increases as well.
|
Summary Statistics |
Target Bonus as a % of Salary |
|||||
|
CEO |
CFO |
|||||
|
2012 |
2011 |
Change in %age Pts. |
2012 |
2011 |
Change in %age Pts. |
|
|
75th Percentile |
200% |
200% |
0% |
143% |
125% |
+18% |
|
Median |
157% |
153% |
+3% |
103% |
100% |
+3% |
|
25th Percentile |
133% |
135% |
-2% |
90% |
85% |
+5% |
Target Total Cash Compensation
Target total cash compensation increased for both the CEO (5%) and CFO (9%) in 2012, mainly due to increases in annual incentive opportunities.
Total Long-term Incentives (LTI)
Increases in total LTI in 2012, on average, were fairly modest; total LTI increased by 3% for CEOs and 5% for CFOs. However, some industries saw significant increases in LTI year over year: CEOs in the Health Care and Consumer Goods industries, on average, received increases in LTI of 30% and 20%, respectively. CFOs in the Technology and Retail industries received the highest increases of 24% and 9%, respectively.
Target Total Compensation
Target total compensation increased over 2011 levels primarily through increases in target annual incentives and, in some industries, through increases in LTI. These findings varied by industry. Financial Services, Pharmaceutical and Retail companies, on average, provided the most significant increases in target annual incentives over other pay components, while Consumer Goods and Health Care industries had the greatest increase in target LTI opportunities.
CONCLUSIONS
Overall, companies had modest increases in target pay levels for the CEO and CFO, through changes in annual and long-term incentives. The Consumer Goods and Health Care industries saw increases in the 15%-20% range driven by higher LTI opportunity while other industries saw more modest changes in total pay levels. Compensation philosophies continue to migrate to median as companies adopt a more conservative pay philosophy. Overall pay mix for the CEO continues to maintain a strong LTI component (66% of pay) with salary representing smaller component of pay (14%), on average. We expect shareholders and proxy advisory firms to continue to influence company pay strategy, as companies to continue to provide modest increases in target total pay mainly through incentive compensation.
|
Industry |
Average Year over Year Change in CEO Target Pay – Top 3 Industries and Overall Sample |
|||
|
Base |
Target Bonus |
LTI |
Target Total Compensation |
|
|
Health Care |
2% |
4% |
30% |
19% |
|
Consumer Goods |
3% |
13% |
20% |
17% |
|
Automotive |
4% |
7% |
7% |
6% |
|
Overall Sample |
3% |
8% |
3% |
3% |
Last year, the study showed an increase in compensation for both CEOs and CFOs, but at much lower levels than the prior year. This leveling off of pay was partially driven by a stabilizing economy and increased confidence in goal setting, leading to less volatility in corporate performance results in incentive plans. To determine if this trend is continuing, we conducted a similar study in 2013 using a sample set of 62 US public companies. The study analyzes executive pay data disclosed by companies with revenues ranging from $1 to $145 billion, with median revenues of $9 billion. Only companies with the same CEO and CFO incumbents from 2010 to 2012 were included in order to focus on year-over-year changes for an individual incumbent. Similar to our methodology in prior years, financial services firms were excluded from the study, as this industry’s compensation practices continue to evolve in the years post the financial crisis.
Our findings, summarized below, indicate that overall, increases in total compensation levels for both CEOs and CFOs slowed in 2011-2012 compared to double-digit pay increases in the 2009-2010 period and mid-single-digit increases in the 2010-2011 period. This dramatic slowdown suggests that the halting economic recovery is having an impact. Percentage pay increases in all three years were higher for CFOs compared to CEOs, driven by slightly higher increases in long-term compensation and smaller decreases in annual bonus. The slower rate of growth in CEO compensation may be driven by the continued focus on CEO pay by shareholders and proxy advisory firms and the increased demand for pay and performance alignment. On an absolute basis, CFO pay continues to be approximately one-third of CEO pay.
Study Results
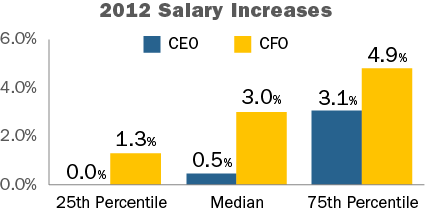
Salaries
In 2012, approximately 85% of CFOs received salary increases. The median increase was 3.0% and the 75th percentile increase was 4.9%. In comparison, only 53% of CEOs received salary increases and the increases were smaller — 0.5% at median and 3.1% at the 75th percentile. The prevalence of salary increases for CFOs remained similar to last year with about 85% of incumbents receiving a salary increase. Among CEOs, approximately 55% received a salary increase, similar to 2010.
|
Salary Increase Prevalence |
||||||
|
|
2009 – 2010 |
2010 – 2011 |
2011 – 2012 |
|||
|
|
No Increase |
Increase |
No Increase |
Increase |
No Increase |
Increase |
|
CEO |
43.8% |
56.3% |
34.4% |
65.6% |
46.8% |
53.2% |
|
CFO |
25.0% |
75.0% |
12.5% |
87.5% |
14.5% |
85.5% |
Actual Pay Levels
Overall, actual total direct compensation (salary plus actual annual incentive plus the grant date value of long-term incentives) for CEOs and CFOs leveled off in 2011-2012. These lower, single-digit changes in pay levels are consistent with the increased focus on pay for performance we have seen over the last few years. They also likely reflect the slow pace of economic recovery. At the median, salary increases were higher for CFOs than CEOs in 2011-2012. Bonus levels decreased for both CEOs and CFOs and long-term incentives increased modestly (2%) for CFOs and remained flat (0%) for CEOs.
|
Median Percentage Change in Pay Components |
||||||
|
|
2009 – 2010 |
2010 – 2011 |
2011 – 2012 |
|||
|
Pay Components |
CEO |
CFO |
CEO |
CFO |
CEO |
CFO |
|
Salary |
1.0% |
3.7% |
1.8% |
3.5% |
0.5% |
3.0% |
|
Actual Bonus |
19.0% |
22.7% |
0.0% |
3.5% |
-2.8% |
-1.2% |
|
Long-Term Incentives |
10.1% |
14.8% |
10.0% |
10.3% |
0.0% |
2.0% |
|
Actual Total Direct Comp. |
14.4% |
20.0% |
3.6% |
7.5% |
-0.3% |
1.4% |
|
Financial Performance (Median Levels) |
|||
|
Year |
Total Shareholder Return (as of 12/31) |
1-Year Revenue Growth |
1-Year Net Income Growth |
|
2010 |
24% |
10% |
19% |
|
2011 |
5% |
9% |
13% |
|
2012 |
14% |
3% |
2% |
While movement in pay among CFOs and CEOs was directionally aligned, absolute CFO total direct compensation levels, on average, have been approximately 30% of CEO total direct compensation levels over the last three years.
Target Pay Mix
In terms of target compensation levels, the overall pay mix remained largely unchanged from 2010 to 2012, with a greater emphasis on at-risk pay for CEOs than for CFOs.
Long-Term Incentive (LTI) Vehicle Prevalence and Mix
The use of at least two long-term incentive vehicles continues to be the majority practice when awarding LTI to CEOs and CFOs. The role of stock options has remained steady in the overall mix with companies delivering about 30% of LTI using this vehicle. On average, performance-based LTI continues to comprise approximately 50% of LTI for CEOs and CFOs. Data shows that 80% of CFOs and 85% of CEOs received some form of performance-based awards as part of their LTI program in 2012.
|
Number of LTI Vehicles Used in 2012 |
||
|
|
% in Total |
|
|
CEO |
CFO |
|
|
1 |
24% |
17% |
|
2 |
47% |
53% |
|
3 |
27% |
28% |
|
Average |
2 |
2 |
|
LTI Mix |
||||||
|
2010 |
2011 |
2012 |
||||
|
Vehicle |
CEO |
CFO |
CEO |
CFO |
CEO |
CFO |
|
Stock Options |
33% |
30% |
32% |
32% |
30% |
32% |
|
Time Vested Restricted Stock |
20% |
23% |
17% |
22% |
16% |
20% |
|
Perf. Based LTI |
48% |
47% |
51% |
46% |
53% |
48% |
Conclusion
As companies and Boards focus on the alignment between pay and performance, and the economic recovery continues at a slow pace, it is not surprising that pay increases have slowed over the last 3 years. The rates of increases continue to be for higher CFOs compared to CEOs; however, the increases for both have slowed dramatically in 2011-2012. We expect future changes in compensation for these positions to continue to be closely linked to overall company performance, as well stock price performance, since the majority of pay for CEOs and CFOs is delivered through long-term incentives.
For the 114 company sample, median revenue was $30B, median market capitalization was $29B and median Total Shareholder Return (TSR) was 3% for 2011.
What We Found
With the majority of companies in our sample holding annual Say-on-Pay votes, we are seeing companies review various aspects of their pay programs/practices more frequently and make incremental changes. Given the intense pressure from shareholders and proxy advisory firms, companies and their Compensation Committees and outside consultants are annually re-evaluating pay programs. Companies need to stay ahead of the curve and track emerging “best practices” in order to satisfy shareholders. In line with our findings last year, we are continuing to see comprehensive risk assessments, modification of clawback policies and elimination of perquisites and supplemental retirement benefits.
Compensation Risk Disclosure
Of the 114 companies in our study, 113, or 99% made some type of affirmative disclosure on risk assessment in the most recent proxy. This is up from 95% of companies in our 2010 analysis. This affirmative disclosure responds to shareholders who want to be assured that compensation programs are not encouraging risky behavior. Similar to 2010, none of the companies disclosed that their incentive programs create material adverse risks.
Most companies make their risk-related disclosure in the CD&A of the proxy statement, with the corporate governance section of the proxy statement ranking as the second most common place to provide risk disclosure. The table below summarizes where risk disclosures were made:
|
|
2011 |
2010 |
||
|
Section of the Proxy Statement |
No. of Cos. |
% of Cos. n=113 |
No. of Cos. |
% of Cos. n=105 |
|
CD&A |
45 |
40% |
49 |
47% |
|
Corporate Governance Section (Section 407) |
31 |
27% |
25 |
24% |
|
CD&A and Corporate Governance Section (Section 407) |
19 |
17% |
14 |
13% |
|
Separate Stand Alone Section |
13 |
12% |
11 |
10% |
|
CD&A and Compensation Committee Report |
4 |
3% |
4 |
4% |
|
Compensation Committee Report |
1 |
1% |
2 |
2% |
Responsibility for completing the risk assessment process varies by company. Of the companies disclosing a risk assessment, 40 companies (35%) reported that management and the Compensation Committee worked together to conduct the assessment, while 25 companies (23%) reported that the Compensation Committee worked alone to conduct the assessment. This year 96% of companies disclosed who conducted the risk assessment. The table below provides further detail on which groups were involved in the compensation risk review.
|
|
2011 |
2010 |
||
|
Approach to Compensation Risk Reviews |
No. of Cos. |
% of Cos. n=113 |
No. of Cos. |
% of Cos. n=105 |
|
Management and Compensation Committee |
40 |
35% |
35 |
33% |
|
Compensation Committee |
25 |
23% |
17 |
16% |
|
Compensation Committee and Consultant |
17 |
15% |
15 |
14% |
|
Management, Compensation Committee and Consultant |
15 |
13% |
12 |
11% |
|
Management |
8 |
7% |
13 |
12% |
|
Not Disclosed |
5 |
4% |
5 |
5% |
|
Management & Consultant |
3 |
3% |
8 |
8% |
Clawbacks
While the SEC initially planned to implement rules for recouping executive compensation during the first half of 2012, their proposed schedule has been eliminated and no new timetable has been set. Even with no SEC timetable, companies continue to be proactive in adopting clawback policies that go beyond Section 304 of Sarbanes-Oxley, which applies to CEOs and CFOs and the top 25 executives at companies under TARP. Further, while most companies were waiting for final rules, before changing their programs, we are seeing many companies make changes now to respond to the intensifying executive compensation environment.
A significant majority of our research companies – 98 of 114 (86%) – have some form of clawback provision, compared to 80% in 2010. In 2011, 16 of the 98 companies adopted a new clawback policy or amended their existing one: 8 companies adopted a new policy and the other 8 modified existing provisions.
As was the case in 2009 and 2010, a financial restatement is required to trigger a clawback in nearly all cases (84 companies or 86% of those with a clawback, compared to 83% in 2010). Further, 78 companies (80% of those with a clawback, compared to 74% in 2010) disclosed that misconduct is a triggering event and 49 companies (50% of those with a clawback, compared to 51% in 2010) disclosed fraud as a trigger.
It is most common for companies with a clawback policy to include the ability to clawback or recoup compensation previously granted. While it is not currently prevalent for companies to adjust future incentive compensation, this may change based on final rules by the SEC.
|
2011 |
2010 |
|||
|
Compensation Subject to Clawback |
No. of Cos. |
% of Cos. n=98 |
No. of Cos. |
% of Cos. n=89 |
|
Prior LTI |
95 |
97% |
79 |
89% |
|
Prior Annual Incentive |
92 |
94% |
81 |
91% |
|
Adjust Future Annual Incentive |
16 |
16% |
20 |
22% |
|
Adjust Future LTI |
15 |
15% |
14 |
16% |
Note: Percentages add up to greater than 100% due to multiple responses.
Clawback policies cover proxy named executive officers (“NEOs”) in 92% of companies, similar to our findings in 2010, with company’s typically defining coverage as, “executive officers, officers, senior executives or senior management.” The other 8% of companies do not define specific coverage. It is not, however, required to disclose this level of program detail in the proxy, and at many companies the use of clawbacks is broad-based.
Similar to our findings for 2010, a minority of companies (22 companies or 22%) indicate the time period which compensation can be recovered after a financial restatement. Of the 22 companies that disclosed a time frame, the most common is 1 year (41% of companies) from the date of restatement and the range is 1-3 years. Interestingly, some companies are also disclosing different time periods for annual incentives and long-term incentives.
The most comprehensive clawback policies seen in our research apply to executives in financial services companies. Large banks now typically have provisions that extend well beyond those required by SOX or suggested in Dodd-Frank. These detailed programs are likely due to the regulators involvement in the compensation design process, as a result of the financial crisis and TARP. Many of the large banks have multiple programs that can impact different employee populations or pay elements for varying reasons (i.e. financial restatement, fraud, misconduct, inattention to risk, inaccurate performance measurement or unacceptable performance). Morgan Stanley’s policy serves as an example of a comprehensive policy:
Morgan Stanley: “The clawback can be triggered if an individual’s act or omission causes a restatement of the Company’s consolidated financial results or constitutes a violation of the Company’s risk policies and standards, whether such action results in a favorable or unfavorable impact to the Company’s financial results. PSUs are subject to clawback following payment if the Committee determines that the payout was based on materially inaccurate financial statements or other performance metric criteria. Deferred-cash based awards are subject to clawback if an individual’s act or omission causes, or is reasonable expected to cause, a substantial financial loss on trading strategy, investment, commitment or holding in either the current year or any prior year.”
We believe most companies are waiting for the SEC to adopt final rules before changing their clawback provisions. But in light of the SEC’s delayed schedule and the attention of shareholders and the media on this topic, companies will continue to modify their programs to respond to current conditions. Currently, the proposed rules apply to both current and former executives and cover all incentive compensation within 3 years of a financial restatement, regardless of whether intentional misconduct exists.
Perquisites
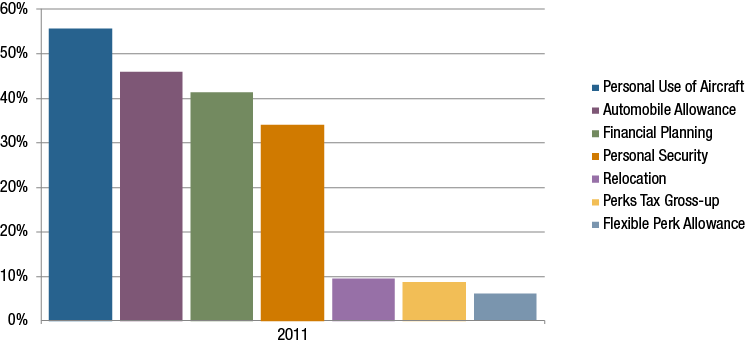
Notwithstanding the trend of decreasing executive perquisites, nearly all companies in our research provide some perquisites to CEOs that extend beyond the benefits provided to the broad employee population. Typical perquisites provided to the CEO include personal use of aircraft (54%), automobile allowance (46%), financial planning (41%) and personal security (35%).
While select perquisites are still somewhat prevalent for CEOs, the trend of reducing executive perks has continued in 2011. It is not surprising that as shareholders express concerns through annual Say-on-Pay votes, one area where companies are responding is by reducing perquisite programs in favor of more performance-based pay. Perquisites are often fairly low in total costs, but high in visibility and sensitivity. In 2011, 14 of 114 companies (12%) disclosed making a change to perquisite programs. Similar to 2009 and 2010, the most prevalent change was the elimination of certain perquisites.
|
|
2011 |
2010 |
||
|
Type of Change Reported in 2011 CD&A |
No. of Cos. |
% of Cos. n=14 |
No. of Cos. |
% of Cos. n=20 |
|
Eliminated perquisites |
9 |
64% |
11 |
55% |
|
Eliminated tax gross-ups on perquisites |
6 |
43% |
8 |
40% |
|
Reduced perquisites |
1 |
7% |
2 |
10% |
|
Changed perquisites |
0 |
0% |
3 |
15% |
Note: Percentages add up to greater than 100% due to multiple responses.
Among companies eliminating perquisites, the most common (in 4 of 9 companies) involved eliminating personal travel on the corporate aircraft or use of company automobile/automobile allowance. 2 of 9 (22%) eliminated home security benefits. Further, of the 9 companies that eliminated perquisites, 3 made up for the lost value in either annual base salary going forward or a one-time payment to cover the loss of the benefit.
Executive Retirement Benefits
16 of 114 companies (14%) disclosed making some type of change to executive retirement plans/benefits in 2011, a slight decrease from 2010 where 17% of companies disclosed a change. As was the case in 2010, t
Our findings, summarized below, indicate that overall, increases in pay levels for both CFOs and CEOs have moved from double-digit figures in the 2009-2010 period to single-digit figures in the 2010-2011 period, suggesting pay actions that are more reflective of a stabilizing economy. Pay increases in both periods were higher for CFOs compared to CEOs, driven by higher increases in short-term compensation. On an absolute basis, CFO pay continues to be approximately one-third of CEO pay.
Study Results
Salaries
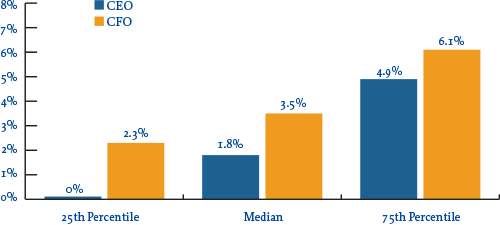
In 2011, 88% of CFOs received salary increases at a rate of 3.5% at median and 6.1% at the 75th percentile. In comparison, only 66% of CEOs received salary increases at lower levels (1.8% at median and 4.9% at the 75th percentile). The prevalence of salary increases for both CFOs and CEOs rose year-over-year, from 75% to 88% (CFOs) and from 56% to 66% (CEOs).
Salary Increase Prevalence |
||||
| 2009 – 2010 | 2010 – 2011 | |||
| No Increase | Increase | No Increase | Increase | |
| CEO |
43.8% |
56.3% |
34.4% |
65.6% |
| CFO |
25.0% |
75.0% |
12.5% |
87.5% |
2011 Salary Increases
Actual Pay Levels
Overall, actual total direct compensation (salary plus actual annual incentive plus the present value of long-term incentives) for both CFOs and CEOs continued to increase but at much lower rates in the 2010-2011 period compared to 2009-2010, as illustrated in the chart below. These lower, single-digit increases in pay levels are indicative of a stabilizing economy. The salary and actual bonus increase levels themselves continued to be higher for CFOs in the 2010-2011 period than for CEOs. Long-term incentives proved to be the biggest driver of pay increases from 2010 to 2011, however, rising by 10% for both CEOs and CFOs.
Median Percentage Change in Pay Components |
||||
| Pay Components | 2009 – 2010 | 2010 – 2011 | ||
| CEO | CFO | CEO | CFO | |
| Salary |
1.0% |
3.7% |
1.8% |
3.5% |
| Actual Bonus |
19.0% |
22.7% |
0.0% |
3.5% |
| Long-Term Incentives |
10.1% |
14.8% |
10.0% |
10.3% |
| Actual Total Direct Comp. |
14.4% |
20.0% |
3.6% |
7.5% |
Financial Performance (Median Levels) |
|||
| Year | Total Shareholder Return (as of 12/31) | 1-Year Revenue Growth | 1-Year Net Income Growth |
| 2009 |
31% |
-9% |
-7% |
| 2010 |
24% |
10% |
19% |
| 2011 |
5% |
9% |
13% |
While movement in pay among CFOs and CEOs was directionally similar, absolute CFO total direct compensation levels, on average, have been approximately 30% of CEO total direct compensation levels over the last three years.
Target Pay Mix
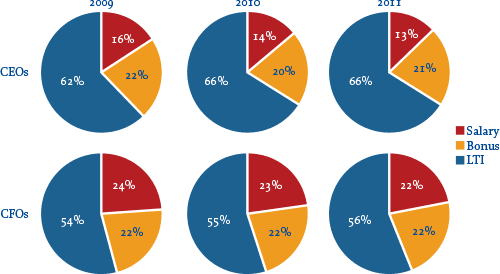
In terms of target compensation levels, the overall pay mix remained largely unchanged from 2009 to 2011, with a greater emphasis on at-risk pay for CEOs than for CFOs.
Long-Term Incentive (LTI) Vehicle Prevalence and Mix
The majority of companies continue to award LTI to both CEOs and CFOs using at least two incentive vehicles. The role of stock options has declined in the overall mix companies use to deliver LTI. And on average, performance-based LTI now comprises approximately 50% of LTI for CEOs and CFOs, an increase of approximately 10% over the past three years. Data shows 80% of CFOs and 85% of CEOs received some form of performance-based awards as part of their LTI program in 2011.
Number of LTI Vehicles Used in 2011 |
||
| % in Total | ||
| CEO | CFO | |
| 1 |
20% |
18% |
| 2 |
46% |
44% |
| 3 |
31% |
34% |
| Average |
2 |
2 |
LTI Mix |
||||||
| 2009 | 2010 | 2011 | ||||
| CEO | CFO | CEO | CFO | CEO | CFO | |
| Stock Options |
40% |
41% |
33% |
30% |
32% |
32% |
| Time Vested Restricted Stock |
19% |
21% |
20% |
23% |
17% |
22% |
| Perf. Based LTI |
40% |
38% |
48% |
47% |
51% |
46% |
Conclusion
In the last three years, trends in CFO pay have been directionally aligned with trends in CEO pay. While the rates of increases were higher for CFO’s 3 years ago, and have started to moderate compared to earlier years, trends for both positions indicate a pronounced linkage to performance, particularly through the long term incentive program.
While volatility in the economy may be stabilizing somewhat, we expect the performance linkages to remain strong for these two key positions. With the continued emphasis at the executive and board level on strong financial skills, talent and acumen, companies will continue to pay competitively for those in the CFO role.
This resulted in significant new reporting requirements for banks and other financial institutions with $1 billion or more in consolidated assets regarding incentive compensation arrangements for Tier 1, Tier 2 and Tier 3 Covered Employees.1,2
- The Federal Reserve Board (“FRB”) first proposed guidance on incentive compensation in 2009 that was adopted by all the federal banking agencies in 2010 (“Final Guidance”).
- As a result, the focus of compensation program design at large banking institutions expanded. Beyond pay-for-performance and attracting / retaining talent, the programs must provide a greater focus on appropriately balancing risk and rewards.
To “improve” practices and require conformance with the Sound Guidance, in late 2009 the FRB began a multi-disciplinary horizontal review of incentive compensation arrangements at 25 large complex banking organizations (“LCBOs”). This led to an iterative pay program design process, as regulators now need to “sign off” on compensation program design for all Covered Employees. Based on client experience and a review of 2012 LCBO proxy statements, we have identified key themes concerning what has been done to-date to move towards substantial conformance with FRB requirements.3
| Key Themes | |
| 1. | The Fed is highly involved in the compensation design process at large bank holding companies for a sizeable number of employees (ranging from senior executives to employees well below that level) |
| 2. | A majority of variable executive compensation is linked to long-term performance and risk outcomes; it is now typical that more than the required 50% of incentive pay (annual + long-term) be deferred over at least 3 years |
| 3. | Performance adjustments are now expected before and after the grant of incentive compensation, and the role of the Risk function and formal risk assessments in that process has increased |
| 4. | Long-term incentive goals must now balance business plan and shareholder goals (EPS, TSR, etc.) with risk-based ex-post performance features (capital goals, etc.) |
| 5. | It is majority practice to have stock ownership requirements for senior executives that go beyond a more traditional guideline (multiple of base or number of shares achieved within a certain number of years) |
| 6. | Clawback provisions go beyond what is required by Sarbanes-Oxley or expected under Dodd-Frank |
Overall Incentive Compensation: Annual and
Long-term
With the goal of “de-leveraging” incentive pay programs and placing more focus on long-term performance and risk outcomes, some LCBOs have re-balanced the pay mix for senior executives. This typically includes a combination of: 1) increasing base salaries; 2) reducing annual incentive award opportunities; 3) increasing the mandatory deferral rate for a portion of annual incentive awards.
To ensure alignment of compensation with long-term performance and risk outcomes, proposed regulations require that at least 50 percent of incentive compensation (annual + long-term) be deferred over a period of at least 3 years (ratable vesting is acceptable), for specific Tier 1 executives at covered financial institutions with total assets of at least $50 billion (minimum deferral under proposed regulations; Dodd-Frank §956).
| approx. (rounded) | % of Incentive Compensation Deferred Over At Least 3 Years (Actual Bonus + Grant Date LTI Value) |
|
| CEO | NEOs (avg.) | |
| 75th%ile | 80% | 75% |
| 50th%ile | 70% | 65% |
| 25th%ile | 65% | 60% |
Currently, the portion of incentive compensation deferred at LCBOs is substantial and exceeds the minimum guideline. Many of these companies have additional stock retention requirements after deferred compensation vests.
CAP Perspective: These high deferral rates reflect a meaningful shift from historic industry practice.
CAP Perspective: Near-term, medium-sized financial institutions are likely to migrate their practices towards increased deferral rates leading to a change in typical senior executive pay mix.
Regulators also require that the deferred amounts be subject to: “performance adjustment for losses (or other measures or aspects of performance) that are realized or become better known during the deferral period.” These risk (and performance) adjustments are expected prior to the grant of incentive compensation (ex-ante / upfront) as well as post-grant and prior to vesting (ex-post / look-back).
In terms of ex-ante adjustments, all but one LCBO (93 percent) disclosed in its most recent proxy statement an annual risk review prior to payment of incentive compensation that can modify payout. Most companies disclosed a highly discretionary process (more structure likely exists), while 20 percent specifically described use of a risk/compliance scorecard.
CAP Perspective: These new concepts / design will cascade down in organizations, and create additional work for cross-functional teams.
In terms of ex-post adjustments, companies are introducing formulaic and/or discretionary reduction features (see LTI discussion below).
CAP Perspective: The FRB does not recognize market-based (stock price) adjustments alone as an adequate form of risk-based performance adjustment.
Incentive Compensation: Annual Incentives
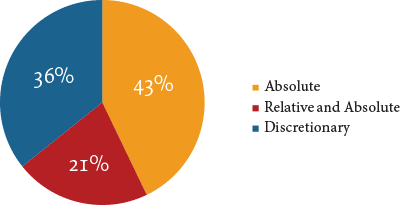
Measuring absolute (internal) performance against pre-established goals is the most common approach used by the LCBOs to determine bonus payments for senior executives. The goals are most often made up of multiple performance measures. The most prevalent metrics relate to profitability (for example, EPS), followed by return/efficiency metrics (for example, ROE).
Additionally, as a risk management technique, we observed that about 20 percent of LCBOs have reduced annual incentive plan upside leverage, by either reducing target opportunities or capping maximum payout opportunities.
Annual Incentive Plan Measurement
Relative vs. Absolute
CAP Perspective: Near-term, we expect large bank holding companies to add more structure to the annual incentive decision making process, including increased documentation and back-testing of decisions.
CAP Perspective: We also expect to see an increased use of risk-focused measures, such as use of a minimum capital level as a 162(m) funding requirement.
Incentive Compensation: Long-term Incentives
Most companies use two long-term incentive vehicles. Some form of long-term performance plan (LTPP; performance shares / cash) is the most widely used vehicle, followed by stock options. The most common LTPP performance period is 3 years, and the most common LTPP upside leverage is 150 percent of target.
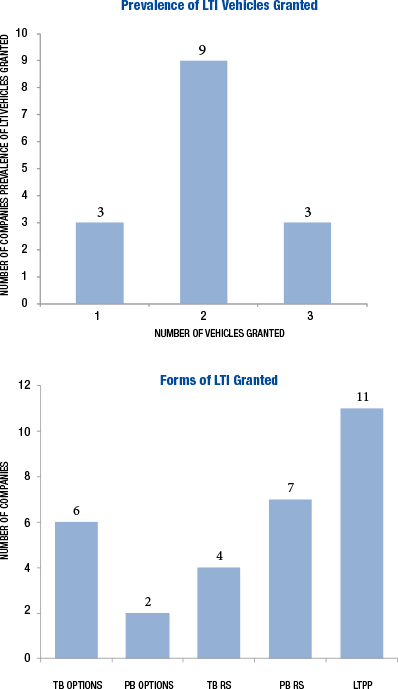
CAP Perspective: Stock options have been de-emphasized in the proportion of the long-term incentive award that they represent due to recent stock price volatility and outside criticisms.
CAP Perspective: Stock options are not seen as appropriately performance-based among regulators. There is concern that value can be realized based on macro economic conditions, rather than company-specific events/financials, particularly over a 10 year timeframe. Attaching some form of ex-post performance-based adjustment can provide risk-balancing features.
In addition to traditional long-term goals tied to the business plan, relative performance or stock price, companies have been adopting secondary performance conditions, in reaction to the Final Guidance, intended to significantly reduce or eliminate unvested deferred incentive payments (post grant, an ex-post adjustment) if a risk event were to occur. These adjustments are designed to be done on a formulaic basis, discretionary basis, or both.
| Select Examples | |
| PNC |
|
| Goldman Sachs |
|
| BNY Mellon |
|
When designing a long-term incentive program, it is also important for financial institutions to consider accounting implications.
CAP Perspective: Truly new designs are being implemented, and it seems that some may lead to variable accounting for equity vehicles. Awards may lack a true grant date, resulting in variable accounting, if a discretionary risk assessment subjects the awards to reduction up until vesting. This can lead to increased cost / volatility in expense and therefore create a reason to consider providing a portion of long-term incentive compensation through a cash-based vehicle.
Stock Ownership Requirements
While all of the LCBOs have some form of stock ownership requirement, most have requirements for senior executives that go beyond traditional ownership guidelines (multiple of base and/or number of shares that must be achieved within a certain number of years).
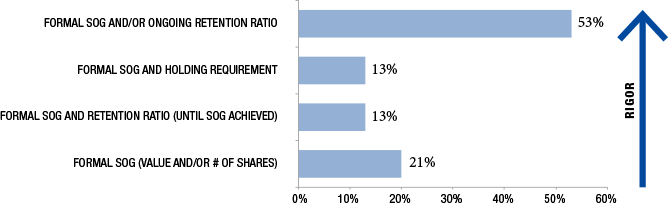
CAP Perspective: The most rigorous requirement for executives – an ongoing retention ratio – is most common.
CAP Perspective: Senior executive ownership standards in this industry exceed those typically found in the general industry.
Clawbacks
As most public companies await final SEC regulations, the horizontal review banks have begun to make comprehensive changes to their existing clawback policies. The horizontal review banks have a clawback provision that goes beyond what is required under Sarbanes-Oxley or Dodd-Frank legislation (SEC has not yet proposed rules). These clawback provisions are part of multiple programs and can impact different employee populations or pay elements for varying reasons.
CAP Perspective: Based on disclosed policies, it is noteworthy that “inattention to risk” is a triggering event among 40 percent of the horizontal review banks.
CAP Perspective: In our experience, most companies have yet to think through how they would implement a clawback of previously paid compensation, should one be triggered. This will likely be a complicated process, with a number of legal and tax considerations for both the employee and the company.
Conclusion
Compensation design and governance practices have been changing at LCBOs at an accelerated pace since the horizontal review process began and the Final Guidance was issued. Change will continue among these organizations, and will spread to other large (and smaller) financial institutions. While the regulations are focused on the largest banks ($50B+ in consolidated assets), the design practices discussed above will be increasingly relevant for financial institutions of all sizes.
There are now greater expectations for Board oversight, enhanced controls and related policies, and documentation for incentive plans and risk mitigation strategies. To comply, the Compensation Committee and a cross-functional senior management team must be fully involved, well-informed and possess an in-depth understanding of incentive arrangements for all Covered Employees.
Research assistance for this CAPFlash was provided by: Deep Patel, Devika Ray and Chelsea Carter.
1 These companies are required to disclose the structure of their incentive-based compensation arrangements to appropriate federal agencies.
2 As described in the Interagency Guidance, the full set of employees who may individually or collectively expose the firm to material amounts of risk are together referred to as “Covered Employees.”
3 16 LCBOs are U.S.-based. Our analysis focuses on these companies excluding Ally Financial (where the U.S. government remains the majority owner). Data found in proxy disclosures is most relevant to Tier 1 Covered Employees (senior executives).
Stronger Governance Practices
What We Found
In response to increased pressure from shareholders and proxy advisory firms, as well as recent Say on Pay legislation, companies continue to monitor their executive compensation programs. In the past, companies would re-evaluate their programs every 2-3 years. Given today’s intense scrutiny of executive compensation, we are seeing companies and compensation committees re-evaluate their programs annually. New governance standards include completing the annual risk assessment and implementing updated clawback policies. In addition, companies have removed excise tax-gross ups from change in control benefits and perquisites, continue to emphasize stock ownership guidelines and stock retention requirements, and have reduced supplemental retirement benefits.
Compensation Risk Disclosure
Clear and explicit disclosure of the compensation risk assessment process is becoming standard practice, especially after the recent economic downturn and passage of SEC rules on enhanced compensation disclosure. Of the 111 companies in our study, 105, or 95%, make some type of affirmative disclosure on risk assessment in the most recent proxy. Similar to 2009, none of the companies disclosed that their incentive programs create material adverse risks.
Most companies make their risk-related disclosure in the CD&A of the proxy statement, with the corporate governance section of the proxy statement ranking as the second most common place for this disclosure. The table below summarizes where risk disclosures were made:
| Section of the Proxy Statement with Compensation Risk Disclosure |
2010 | 2009 | ||
| % of Cos. | % of Cos. | |||
| No. of Cos. | n=105 | No. of Cos. | n=75 | |
| CD&A | 49 | 47% | 39 | 52% |
| Corporate Governance Section (Section 407) | 25 | 24% | 19 | 25% |
| CD&A and Corporate Governance Section (Section 407) | 14 | 13% | 7 | 9% |
| Separate Stand Alone Section | 11 | 10% | 8 | 11% |
| CD&A and Compensation Committee Report | 4 | 4% | 2 | 3% |
| Compensation Committee Report | 2 | 2% | n/a | n/a |
Responsibility for completing the risk assessment process varies by company. Of the companies disclosing a risk assessment, 35 companies (33%) had management and the compensation committee working together to conduct the assessment, while 17 companies (16%) reported that the compensation committee worked alone to conduct the assessment. One change we noted is that this year 95% of companies disclosed who conducted the risk assessment versus only 65% last year. The table below provides further detail on which groups were involved in the compensation risk review:
| Approach to Compensation Risk Reviews | 2010 | 2009 | ||
| % of Cos. | % of Cos. | |||
| No. of Cos. | n=105 | No. of Cos. | n=75 | |
| Management & Compensation Committee | 35 | 33% | 10 | 13% |
| Compensation Committee | 17 | 16% | 7 | 9% |
| Compensation Committee & Consultant | 15 | 14% | 9 | 12% |
| Management | 13 | 12% | 7 | 9% |
| Management, Compensation Committee & Consultant | 12 | 11% | 15 | 20% |
| Management & Consultant | 8 | 8% | 1 | 1% |
| Not Disclosed | 5 | 5% | 26 | 35% |
Clawbacks
Despite the SEC’s delay in proposing policies to recoup executive compensation under Dodd-Frank, companies have been proactively adopting clawback policies. Even though clawbacks are mandated by the SEC for all public company CEOs and CFOs under SOX and for the top 25 executives in TARP participants, companies have implemented their own clawbacks to obtain broader protection.
A significant majority of our research companies – 89 of 111 (80%) – maintain some form of clawback provision. For 2010, 17 of the 89 companies adopted a new clawback policy and 10 modified existing policies by expanding the type of compensation that can be recouped, the executives covered or the events that trigger a clawback. The majority of companies are awaiting final SEC regulations, however, before making comprehensive changes to update existing policies.
Similar to our findings in 2009, a financial restatement is required to trigger a clawback in nearly all cases (74 companies or 83% of those with a clawback). Further, 66 companies (74% of those with a clawback) disclosed that misconduct is a triggering event and 45 companies (51%) disclosed fraud as a trigger.
Based on our review of CD&A disclosures, companies with a clawback include the ability to clawback or recoup the following types of compensation: earned, exercised, outstanding, vested or unvested.
| Compensation Subject to Clawback | % of Cos. | |
| No. of Cos. | n=89 | |
| Prior annual incentive | 81 | 91% |
| Prior LTI | 79 | 89% |
| Future annual incentive | 20 | 22% |
| Future LTI | 14 | 16% |
Note: Percentages add up to greater than 100% due to multiple responses.
Of the type of compensation that is subject to a clawback, clawbacks of both cash and equity are equally prevalent.
While the majority of companies do not explicitly state who their clawback policy applies to, it is clear that coverage extends to the NEOs at 83 companies (93%).
A minority of companies (18 companies or 20%) indicate the time period which compensation can be recovered after a restatement. Of the 18 companies that disclosed a time frame, the most common is 1 year from the date of restatement and the range is 1-3 years.
It is apparent from reviewing CD&A disclosure that most companies are waiting for the SEC to rule before modifying their current policies. Companies will need to develop and implement a policy to provide for recovery of compensation that aligns final rules issued by the SEC. The proposed rules apply to both current and former executives and cover all incentive compensation within 3 years of a financial restatement (with or without intentional misconduct). It is unlikely that companies will make final modifications to their policies that apply to the 2012 proxy season, since the SEC is not expected to issue final rules until the first half of 2012.
Stock Ownership Requirement Changes
Companies continue to monitor their stock ownership requirements in order to align executives with shareholders. This year 25 companies (23%) initiated a change with respect to stock ownership or stock holding requirements. The most prevalent change was an increase in stock ownership guideline levels, with 12 of the 25 companies (48%) disclosing an increase. This is likely attributed to a recovery in the economy as well as stock prices, and increasing pressure from regulators and proxy advisory firms. Other common changes were 24% of companies added a new stock holding requirement and 20% modified or added a penalty for non-compliance. Further detail on changes made to executive stock ownership guidelines are below:
| Changes made to Executive Stock Ownership Guidelines | 2010 | 2009 | ||
| % of Cos. | % of Cos. | |||
| No. of Cos. | n=25 | No. of Cos. | n=17 | |
| Increased | 12 | 48% | 3 | 18% |
| Added holding requirement | 6 | 24% | n/a | n/a |
| Modified penalty for non-compliance | 5 | 20% | n/a | n/a |
| Changed to multiple of salary | 2 | 8% | n/a | n/a |
| Increased holding requirement | 2 | 8% | n/a | n/a |
| Decreased holding requirement | 2 | 8% | n/a | n/a |
| Newly adopted | 1 | 4% | 10 | 59% |
| Decreased | 1 | 4% | 1 | 6% |
| Adopted mandatory holding of shares through retirement | 1 | 4% | n/a | n/a |
Note: Percentages add up to greater than 100% due to multiple changes by several companies.
Stock Ownership Requirements Detail
For companies disclosing shares counted toward ownership requirements, it is interesting to note that one-third of companies count unvested restricted stock towards meeting the guidelines, since companies expect executives to vest in these shares. However, only 6% count vested/unexercised options and 5% count unearned performance shares since these shares are viewed as being subject to greater risk. See below for further detail:
| Shares Counting For Guideline Requirements | % of Cos. | |
| No. of Cos. | n=99 | |
| Shares directly owned | 55 | 56% |
| Unvested RS | 33 | 33% |
| Shares in 401(k) plan | 33 | 33% |
| Shares indirectly owned | 29 | 30% |
| Shares purchased on open market | 29 | 29% |
| Not disclosed | 29 | 29% |
| Deferred Compensation | 25 | 25% |
| Vested but unexercised options | 6 | 6% |
| Unearned performance shares | 5 | 5% |
| Unvested options | 1 | 1% |
Note: Percentages add up to greater than 100% due to multiple types of equity counted by various companies.
Among CEOs, most companies (82%) express their guidelines as a multiple of base salary and 17% of companies express their guidelines in fixed share amounts. The fixed share approach is more prevalent among financial services and technology companies.
The median guideline for all company CEOs in our study sample is a 5x multiple of base salary or a fixed share guideline of 150,000 shares. The median value of these guidelines is $6,700,000.
| CEO Stock Ownership Guidelines (n=99) |
Prevalence |
25th Percentile Level | Median Level | 75th Percentile Level |
| Multiple of Base | 82% | 5.0x | 5.0x | 6.0x |
| Fixed Share | 17% | 100,000 | 150,000 | 300,000 |
| Fixed Value | 1% | $5,000,000 | $5,000,000 | $5,000,000 |
| Total Value | – | $5,389,894 | $6,700,000 | $8,600,000 |
15% of companies disclose some type of penalty for non-compliance with stock ownership guidelines. The most common penalties disclosed include mandatory payment of a portion of the annual bonus in stock and requiring executives to hold shares after an option exercise or the vesting of stock awards.
Stock Holding Requirements Detail
Having stock holding or stock retention requirements in addition to stock ownership guidelines is a growing trend. In our sample of 111 companies, 30 companies (27%) disclose some type of stock holding requirement. Over half of the 30 companies have a stand-alone stock holding requirement. This type of requirement is most prevalent among financial services companies in place at 75% of financial services companies.
Most of these companies (46%) require executives to hold equity after vesting or exercise for 1 year. Holding shares until retirement (33%) is the second most prevalent holding period, although it is relatively rare. 70% of companies disclose that the equity to be held is the net after-tax shares retained by the executive after option exercise/equity vesting. See below for further detail:
| Definition of LTI subject to Hold | % of Cos. | |
| No. of Cos. | n=30 | |
| RS/RSUs | 25 | 83% |
| Options | 22 | 73% |
| Performance Shares | 12 | 40% |
| Net after tax shares | 21 | 70% |
Note: Percentages add up to