Partner Susan Schroeder and Principal Bonnie Schindler are interviewed on their 2014 survey private company incentive pay practices.
The increases that CAP observed in 2013 are much higher than seen last year. In 2012, our study showed almost no change in CEO compensation (-0.3% at median) and a very modest increase in CFO total direct compensation (1.4% at median).
Our findings indicate that the rate of increase in total direct compensation levels for both CEOs and CFOs accelerated in 2012-2013 compared to flat pay increases in 2011-2012. This increase suggests that the economic recovery is having an impact. The higher increase in 2013 among CEOs was driven by larger increases in actual bonuses paid for 2013 and slight increases in long-term incentives (LTI). The slower rate of growth in CFO compensation may signal a leveling off of CFO pay increases – which has been increasing at a faster rate than CEO pay since 2010. On an absolute basis, CFO total direct compensation continues to total approximately one-third of CEO total direct compensation.
Methodology
Our findings are based on a sample of 92 public companies. Similar to prior years, the study analyzes executive pay data disclosed by companies with revenues ranging from $1 to $130 billion, and median 2013 revenues of $8 billion. Only companies with the same CEO and CFO incumbents in the past three years are included allowing us to measure year-over-year changes for individual incumbents. In the past, we excluded financial services firms from the study, since this industry’s compensation practices were evolving in the years after the financial crisis. This year we expanded our sample to include financial services companies in our analysis, because we believe that compensation in the financial services industry has stabilized over the last couple of years.
Study Results
Salaries
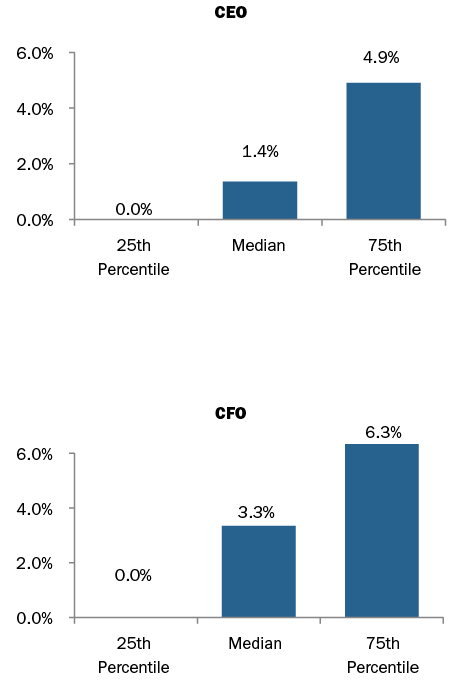
In 2013, approximately 73% of CFOs received salary increases compared to 85% in 2012. The median increase was 3.3% and the 75th percentile increase was 6.3%. In comparison, only 54% of CEOs received salary increases and the increases were smaller — 1.4% at median and 4.9% at the 75th percentile. The number of CEOs receiving a salary increase was similar to 2012. Less frequent and lower salary increases among CEOs may be explained by companies’ hesitancy to increase salaries beyond $1M.
|
% of Executives Receiving Salary Increases |
||||||
|
2010 – 2011 |
2011 – 2012 |
2012 – 2013 |
||||
|
No Increase |
Receiving Increase |
No Increase |
Receiving Increase |
No Increase |
Receiving Increase |
|
|
CEO |
34% |
66% |
47% |
53% |
46% |
54% |
|
CFO |
12% |
88% |
15% |
85% |
27% |
73% |
2013 Salary Increases
Actual Pay Levels
Our findings indicate that the rate of increase in total direct compensation levels for both CEOs and CFOs accelerated in 2012-2013 compared to flat pay increases in 2011-2012, supported by stronger performance in 2013. During 2012-2013, actual total direct compensation (salary plus actual annual incentive plus the grant date value of long-term incentives) for CEOs and CFOs increased by 5.2% and 3.2%, respectively. This year is the first year since 2010 that we see higher median increases in actual total direct compensation for the CEO versus the CFO. In addition to salary increases of 1-3%, annual bonuses were 4-5% higher at median and long-term incentives increased about 3% at median for both CEOs and CFOs.
Absolute CFO total direct compensation levels, on average, continue to be approximately 30% of CEO total direct compensation levels.
|
Median Percentage Change in Pay Components |
||||||
|
2010 – 2011 |
2011 – 2012 |
2012 – 2013 |
||||
|
Pay Components |
CEO |
CFO |
CEO |
CFO |
CEO |
CFO |
|
Salary |
1.8% |
3.5% |
0.5% |
3.0% |
1.4% |
3.3% |
|
Actual Bonus |
0.0% |
3.5% |
-2.8% |
-1.2% |
4.9% |
3.7% |
|
Long-Term Incentives |
10.0% |
10.3% |
0.0% |
2.0% |
3.2% |
3.3% |
|
Actual Total Direct Comp. |
3.6% |
7.5% |
-0.3% |
1.4% |
5.2% |
3.2% |
|
Financial Performance (Median Levels) |
|||
|
Year |
Total Shareholder Return (as of 12/31) |
1-Year Revenue Growth |
1-Year Net Income Growth |
|
2011 |
5% |
9% |
13% |
|
2012 |
14% |
3% |
2% |
|
2013 |
31% |
5% |
12% |
Since this was the first year financial services companies were included, we tested the results without financial services companies and found that the median increase in total direct compensation between the two data sets for CEOs and CFOs was within a 1% difference. However, total cash compensation yielded greater differences. For CFOs of non-financial services companies the median increase in total cash compensation was 1.9% vs. 4.6% median increase of the total sample. For CEOs the median increases were 3.1% vs. 4.2%, respectively. This is due to higher bonus payouts at financial services institutions in 2013.
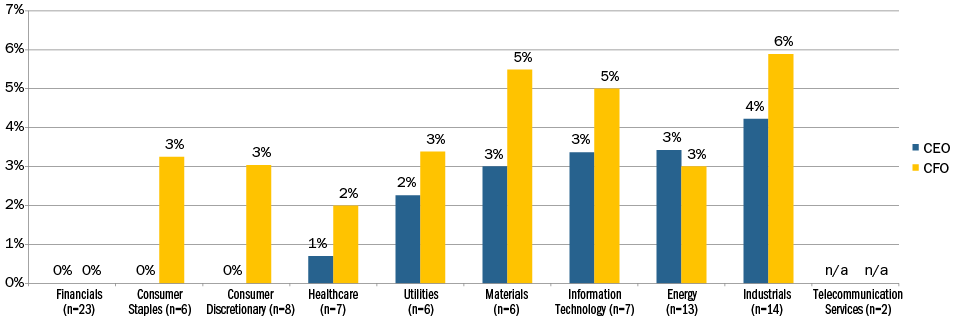
2013 Median Salary Increase by Industry
2013 Median Actual Total Direct Compensation Increase by Industry
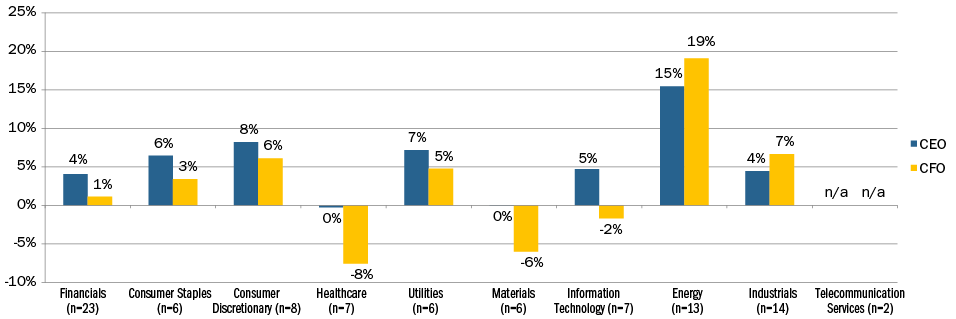
Our study breaks out 2013 CEO and CFO pay by industry classification (Financials, Consumer Staples, Consumer Discretionary, Healthcare, Utilities, Materials, Information Technology, Energy, Industrials, and Telecommunication Services). When looking at median increases in salary for both CEOs and CFOs, they tend to be in the range of 0-3%. Median salary increases over 3% occurred in the Materials and Information Technology industries for CFOs and in Industrials for both CEO and CFO. When looking at actual total direct compensation there is greater volatility in increases, which is primarily driven by industry and company performance.
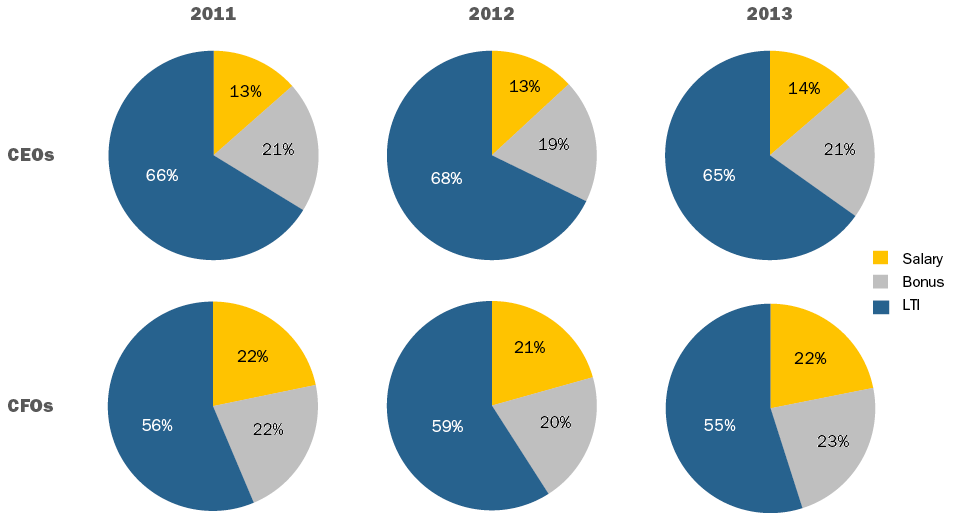
Target Pay Mix
In terms of target compensation levels, the overall pay mix remained largely unchanged from 2011 to 2013. We continue to observe a greater emphasis on at-risk pay for CEOs than for CFOs.
Long-Term Incentive (LTI) Vehicle Prevalence and Mix
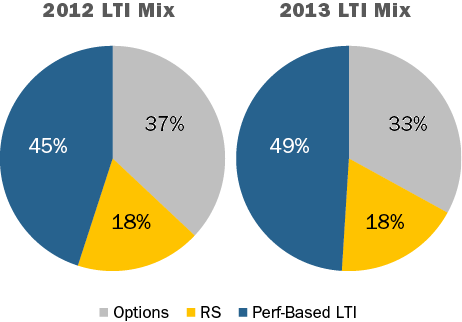
LTI vehicle prevalence and mix trends have been fairly consistent over the past few years. The use of at least two long-term incentive vehicles continues to be the majority practice for CEOs and CFOs. The role of stock options has been decreasing slowly in the overall mix with companies delivering about 30% of LTI using this vehicle. On average, performance-based LTI continues to comprise approximately 50% of LTI for CEOs and CFOs. Data continues to show that about 80% of CFOs and CEOs receive some form of performance-based awards as part of their LTI program.
|
# of LTI Vehicles Used |
% in Total |
|
|
CEO |
CFO |
|
|
1 Vehicle |
25% |
27% |
|
2 Vehicles |
49% |
43% |
|
3 Vehicles |
26% |
30% |
|
Average |
2 |
2 |
|
LTI Mix |
2011 |
2012 |
2013 |
|||
|
CEO |
CFO |
CEO |
CFO |
CEO |
CFO |
|
|
Stock Options |
32% |
32% |
30% |
32% |
29% |
29% |
|
Time Vested Restricted Stock |
17% |
22% |
16% |
20% |
19% |
22% |
|
Perf. Based LTI |
51% |
46% |
53% |
48% |
53% |
49% |
Conclusion
Given the improved economy and strong stock market it is not surprising that CEO and CFO pay levels increased in 2013. The fact that CEO pay increased at a faster rate than CFOs for the first time in four years, implies that Compensation Committees are recognizing CEO performance as overall company performance improves. In the future, we expect continued pay-for-performance alignment with CEOs experiencing a greater impact on compensation for good and bad performance.
Underlying the Fed’s input to financial institutions is a legitimate concern about the potential for incentives to encourage excessive risk taking. The Fed has stated that: “risk-taking incentives provided by incentive compensation arrangements in the financial services industry were a contributing factor to the financial crisis that began in 2007” and “Before the crisis, large banking organizations did not pay adequate attention to risk when designing and operating their incentive compensation systems.” Agree or disagree with these points, over the past several years compensation-related risk management processes have vastly improved.
In this CAPflash, we provide an overview of how compensation practices have evolved following the Fed’s guidance, what (in our view) the Fed has got “right” and where they may have gone too far, and what we expect to see from banks and regulators in the near future.
Where We Are Now
The Final Guidance was principles-based, leaving leeway for implementation to consider differences among the institutions subject to this new level of oversight. For example, companies with significant differences in their businesses, such as select investment banks, custody banks, regional banks, and credit card companies were all subject to the same guidance. In its October 2011 publication, the Federal Reserve noted, “The interagency guidance helps to avoid the potential hazards or unintended consequences that would be associated with rigid, one-size-fits-all supervisory limits or formulas.” In our experience, banks devoted considerable time and resources to demonstrate substantial conformance with the new requirements, but went about responding and demonstrating conformance to regulators in different ways.
The Interagency Guidance was founded on three key principles:
- Balance between risks and results. Incentive compensation arrangements should balance risk and financial results in a manner that does not encourage employees to expose their organizations to imprudent risks;
- Processes and controls that reinforce balance. A banking organization’s risk-management processes and internal controls should reinforce and support the development and maintenance of balanced incentive compensation arrangements; and
- Effective corporate governance. Banking organizations should have strong and effective corporate governance to help ensure sound incentive compensation practices, including active and effective oversight by the board of directors.
Improved Risk Management
In our experience, companies have come a long way in addressing all three key principles. Most banks have greatly strengthened their risk management processes and ensured that the risk function has a defined role in reviewing compensation design, as well as performance outcomes and their impact on compensation payments. Where the risk function seldom had any role in the incentive compensation process in the past, they are now integrated into the process. Similarly, great strides have been made to ensure that Compensation Committees are informed about risk-taking within the organization and how incentive compensation designs across the company address risk. Many banks have also formed internal committees responsible for maintaining controls and risk oversight of incentive compensation plans across their organizations.
Prescribing Plan Design
The Fed and other agencies have become more prescriptive in their “guidance” to banks, at times almost to the point of allowing for limited leeway in compensation practices. The table below provides a summary of the methods for linking compensation and risk outcomes described in the Final Guidance, and select examples of how current compensation design practices have evolved based on input from regulators.
|
Areas of Principles- based Interagency Guidance |
Select Examples of Design Practices Reacting to Fed Direction |
|
Deferred Incentive Compensation |
Significant Changes Reduced upside leverage in long-term performance plans (from 200% to 125%-150% of target) Elimination of stock options (or significant reduction to modest percentage of total long-term) |
|
Risk Adjustment of Incentives |
Significant Changes Risk-adjusting incentive pools Performance-based adjustments that apply to deferrals/long-term incentives over the full vesting period with ability to reduce awards to zero based on risk outcomes |
|
Other Methods that Promote Balanced Risk-Taking Incentives |
Modest Changes Discretionary annual incentives most common (some shifts where formula-based payouts had existed) Reduced upside leverage in annual incentive plans, at times with corresponding increases to fixed pay (salaries) Some reduction in the use of relative performance measures in annual and/or long-term incentive plans |
|
Enhanced Control Functions |
Modest Changes Risk management and internal control functions involved in designing, implementing, and evaluating incentive arrangements to ensure proper risk-balancing in a more formal way |
|
Strong Corporate Governance |
Modest Changes Increased Board/Committee oversight of incentive compensation arrangements below senior executive level, for other covered employees (including non-executives) Mechanisms to facilitate communication between the Compensation Committee and Risk and Audit Committees |
In our view, the area where the Federal Reserve has had the most positive impact on incentive compensation design is in requiring deferrals to be subject to performance adjustment, before and after grant, based on risk outcomes (generally not the case before the guidance). Other changes encouraged by the Fed (e.g., eliminating/reducing stock options, reducing upside incentive plan leverage to 125%-150% of target, reducing the use of relative measures, etc.) seem to be less well founded in the principles of risk balancing and more arbitrary. It is difficult to identify the role that these incentive design features played in the financial crisis and it seems to us that Fed input on these areas is based more on theoretical objections than any empirical data supporting the hypothesis that these incentive design features encouraged excessive risk-taking among executives at financial institutions.
Future Concerns and Expectations
U.S. regulators should be commended for maintaining a largely hands off approach thus far with respect to pay levels, focusing primarily on incentive compensation design and control features. This approach provides a strong focus on risk balancing of incentive compensation, while recognizing the need for the industry to maintain competitive compensation programs. In contrast, in the European Union, CRD-IV places caps on the level of incentive pay that may be delivered (as a ratio of fixed pay). This type of regulation severely limits the ability to implement a pay-for-performance compensation design and, in response, has led many companies to increase fixed pay. As a result, CRD-IV has potentially harmed shareholders by weakening the pay-for-performance relationship. Thankfully, to-date, the Fed has avoided this kind of heavy-handed approach in addressing compensation in U.S. financial institutions.
Still, we may have unanticipated consequences in the U.S. Many shareholders and shareholder advisory groups prefer formulaic performance-based incentive arrangements to discretionary incentives, as they fear that discretion will be used for the benefit of management. However, because regulators have discouraged formulaic, performance-based upside in incentive compensation plans, many financial institutions have moved to more discretionary incentive arrangements to allow for greater flexibility to compensate executives. Another potential response to the Fed’s input is that, over time, financial institutions may increase pay levels to address concerns that executive talent will depart for other industries (e.g., hedge funds, private equity, asset management) where there are no restrictions on incentive design.
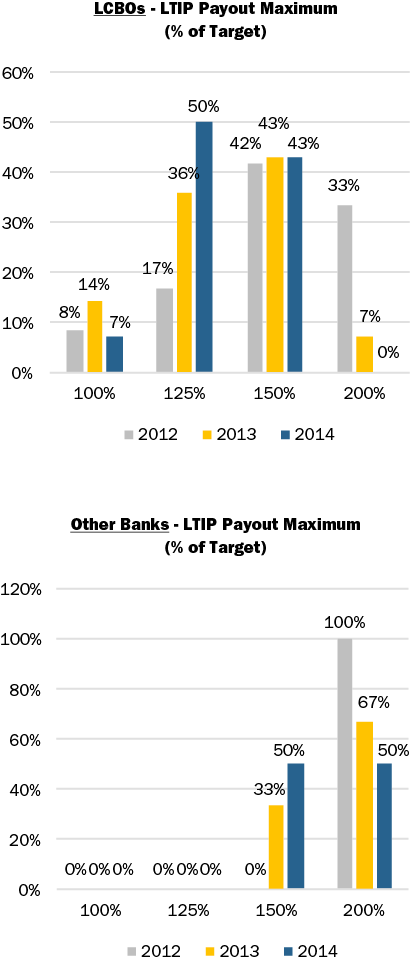
Going forward, we expect regulators to provide more guidance on monitoring and validation processes and results. Many companies developed approaches to retrospectively review risk outcomes and the corresponding impact on compensation decisions, but communicating these processes and results for all covered employees to regulators is still, generally, in early stages. Regarding incentive plan upside leverage, regulators have started to state more and more directly a belief that 125% is most appropriate, but many banks have held their ground at 150%. Some of the banks that moved to 125% may start to re-evaluate their program and consider moving back to 150% to remain competitive.
As companies and Committees try to “live with” the restrictions of the guidance, we expect to see a continued move away from formal targets and increased use of discretion, increases in pay levels to recognize decreased incentive plan upside leverage, and challenges in applying risk adjustments and clawbacks.
Conclusion
Incentive compensation processes and designs among financial institutions have changed a great deal over the past four years, to a large degree driven by regulatory input. If we look back at the principles (Final Guidance), most banks have come a long way in addressing them. At this point, we hope that regulators can step back and consider how much progress has been made and consider taking a pause to begin to evaluate what changes were necessary and effective and what changes may have been excessive.
Appendix – Summary Market Data
[company-by-company data available upon request]
Methodology
CAP reviewed 2012, 2013, and 2014 proxy statements and the most recent equity award agreements of the 23 large publicly-traded banks1 that were included as part of the Federal Reserve’s horizontal review of incentive compensation. Our analysis looked for year-over-year changes in compensation structure, annual and long-term incentive design, performance-based vesting, recoupment policies and stock ownership guidelines/retention requirements.
Select summary data is shown below. Findings have been divided into two data sets, large complex banking organizations (LCBOs) and other large banks with assets exceeds $50 billion. LCBOs are one year ahead of the other large banks in terms of their interaction with the Fed, and the related implications on compensation program design.
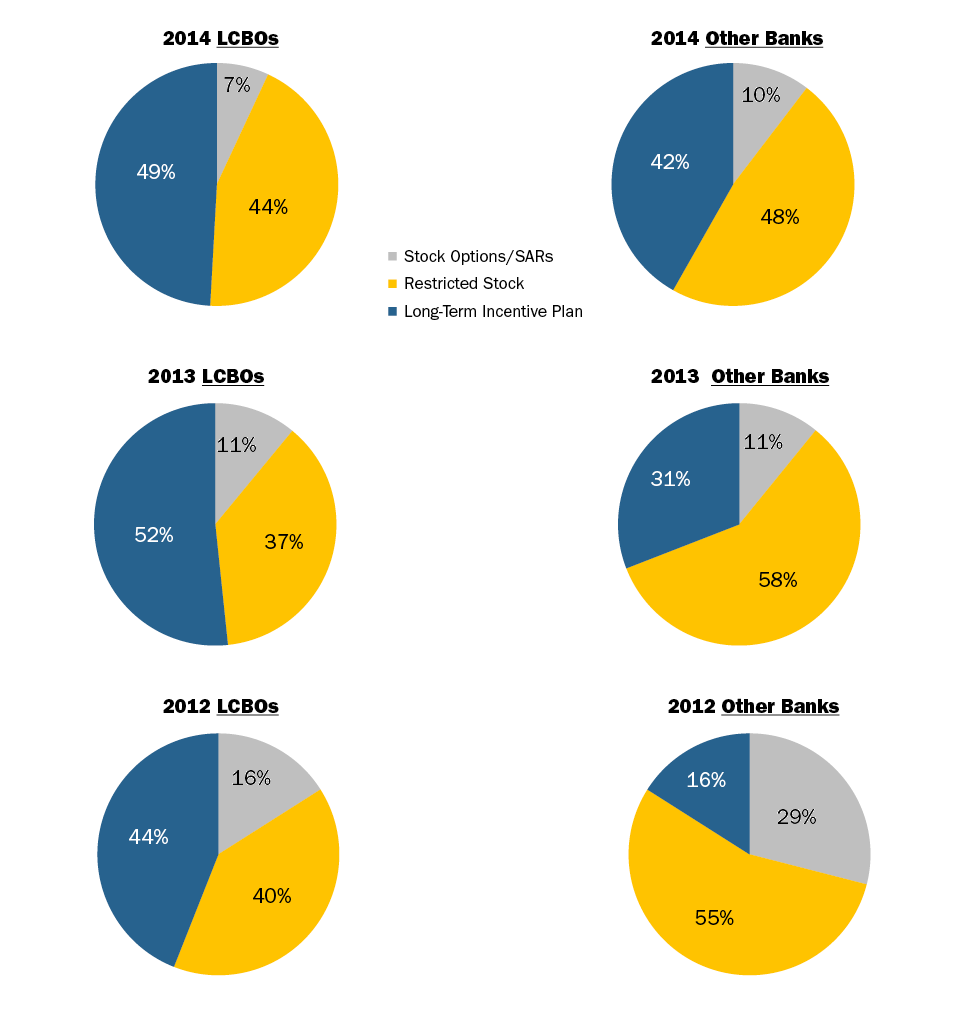
Long-term Incentive Mix, 2012-2014
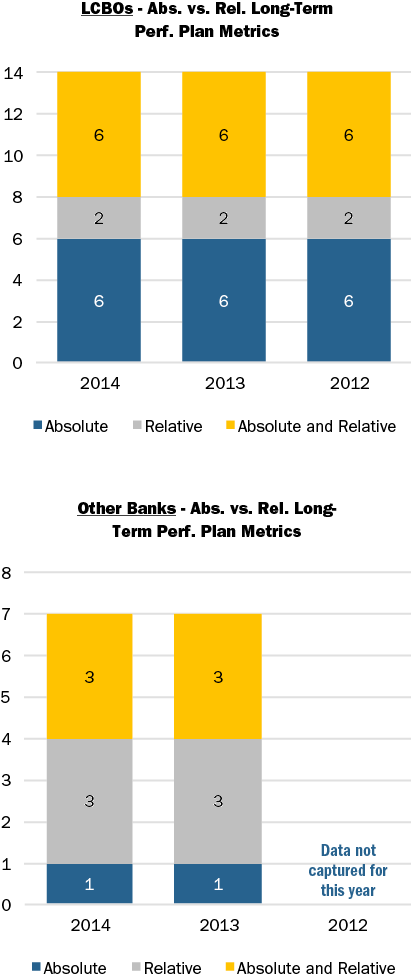
Long-term Incentive Absolute vs. Relative Performance Metrics, 2012-2014
Long-term Performance Plan Maximum Upside Leverage, 2012-2014
Stock Ownership Requirements
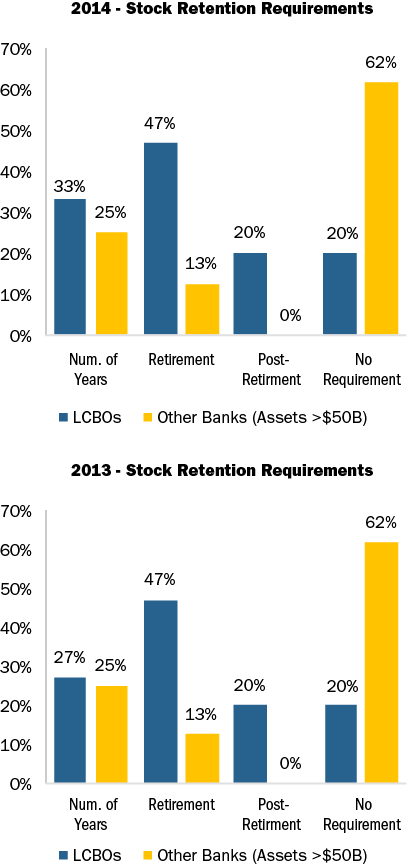
Some companies differentiate stock retention requirements for the CEO versus Other NEOs. Therefore in some instances the prevalence shown is greater than 100 percent.
Research assistance was provided by: Myron Lising, Roman Beleuta, Michael Biagi, Michael Bonner, Rachael Holland, and Jasmine Yanes.
1 Companies reviewed include American Express, Bank of America, BNY Mellon, Citigroup, Capital One Financial, Discover Financial Services, Goldman Sachs, JPMorgan Chase, Morgan Stanley, Northern Trust, PNC, State Street, SunTrust Bank, US Bancorp, Wells Fargo, BB&T, Comerica, Fifth Third, Huntington Bancshares, KeyCorp, M&T Bank, Regions and Zions Bancorp.
Among the 44 company sample, median revenue was $11B, median market capitalization was $23B and median 12 month Total Shareholder Return (TSR) was 27% at the end of February 2014.
What We Found
The early findings and trends from these filers generally showed a continuation of trends from the 2013 proxy season. Early in 2014 companies:
- Received high levels of shareholder Say on Pay support
- Awarded CEO bonuses that were slightly higher as a percent of target compared to prior year earned bonuses, and
- Shifted more of the long-term incentive “LTI” program to performance based vehicles and decreased the emphasis on stock options
Say On Pay (SOP) Vote Results
In 2014, all Early Filers that released SOP results to-date (n=38) received majority shareholder support and 87% of companies received greater than 90% support. Among these companies there has been a steady uptick in the level of support at the 25th percentile over the last four years.

CAP Comment: SOP levels in early 2014 to-date continue to be strong. We expect similar SOP support levels for calendar year-end companies as we approach the 2014 annual meeting dates.
CHANGES IN SHORT AND LONG-TERM COMPENSATION
Base Salary
Among Early Filers, 46% of companies disclosed an increase to the CEO’s base salary in 2013 and the overall average base salary increase was 2.7%.2 CEOs in the Industrials industry received the largest average base salary increase (8.7%) followed by Consumer Staples (3.9%).
CAP Comment: The average executive base salary increase among the Early Filers is consistent with projected merit increases in the broader market where we are generally seeing 3.0% increases for 2014.
Short-term Incentive Payouts
Bonus payouts as a percent of target for the Early Filers increased slightly at the median. The median CEO bonus payout for 2013 was 100% of target compared to 97% in 2012. In general, there was a slight shift upwards in the bonus payouts when compared to the prior year. This is in-line with overall expectations as companies’ earnings and income also had modest growth year-over-year.
|
|
Annual Incentive Payout as a % of Target |
|
|
Summary Statistics |
2012 |
2013 |
|
75th Percentile |
118% |
119% |
|
50th Percentile |
97% |
100% |
|
25th Percentile |
74% |
84% |
51% of Early Filers paid above target in 2013, compared to 46% in 2012. Of the companies that paid above target, median year-over-year increases in revenue, earnings and income growth were in the 10-20% range, compared to 5% for all Early Filers companies.
CAP Comment: Year-over-year financial performance results are aligned with CEO bonus payouts for the Early Filers. Companies are putting more time and effort into the goal setting process to ensure an appropriate pay and performance alignment; investors and proxy advisory firms increasingly focus on the performance goals and rigor of the incentive plan targets.
Long-term Incentive Mix
Over the last two years, the portion of the LTI mix delivered in a performance-based vehicle has increased in the general market. Early Filers showed a continuing, consistent shift, placing more emphasis on performance-based LTI and less emphasis on stock options; the weighting on time based restricted stock remained flat.
Approximately 85% of the Early Filers use two or three vehicles to deliver their long-term incentives.
CAP Comment: A general trend over the last couple of years has been a de-emphasis on stock options as part of the LTI program and an increase on the portion of performance based LTI. ISS is supporting this shift as they do not consider options to be performance-based.
Disclosed changes to compensation programs and polices
Companies continue to modify their compensation programs as they reassess program features in light of business/strategic changes and/or evolving shareholder and proxy advisory groups’ hot buttons. 36 of the 44 companies (82%) we researched disclosed making a change to their compensation programs or policies. The most prevalent change among the Early Filers was a modification to the company’s benchmarking peer group. Peer group changes are typically a result of companies trying to better align the peer group median size with that of their own company.
|
|
2013 |
% of Cos. |
|
Type of Change Reported in CD&A |
No. of Cos. |
n=44 |
|
Modified peer group |
22 |
50% |
|
Decreased weighting of options in LTI mix |
10 |
23% |
|
Increased weighting on perf.-based LTI |
9 |
20% |
|
Adopted / expanded clawback policy |
6 |
14% |
|
Adopted hedging and/or pledging |
5 |
11% |
Note: Percentages add up to greater than 100% due to multiple responses
CAP Comment: Modifications to a company’s peer group is common as Compensation Committees and management review appropriate peers for benchmarking on an annual or biennial basis. Given that ISS and Glass Lewis consider a company’s peer group when conducting their analyses, it is another reason that assessing the appropriateness of peer companies is a valuable exercise.
Similar to last year, companies continue to modify their clawback policy as a sign of good corporate governance. Companies are not universally waiting for final Dodd-Frank regulations before making adjustments to their policy. The uptick in the disclosure of hedging/pledging policies also continued, and overall, 86% of Early Filers disclose having both. Lastly, 14% of Early Filers voluntarily disclosed a supplemental table, graph or discussion of realized/realizable pay. In-line with CAP’s recent research on this topic and disclosure in 2013 proxies, these companies tend to compare realized/realizable pay with target or Summary Compensation Table pay values, as well as alignment with TSR.
Conclusions
While the Early Filers research is a sneak preview into the upcoming proxy season, we expect to see directionally consistent trends with these changes and practices indicated from our research. Companies are continuing to demonstrate good corporate governance and policies / programs that enhance company performance and pay linkages. Since there have not been significant changes in proxy advisory firm policies or expanded Dodd- Frank legislation, we do not expect to see significant program overhaul in the current proxy season. Companies with low SOP support will likely disclose more significant program modification.
1 Calendar year-end companies were not included in the analysis.
2 Based on companies whose current CEO has held the position for two years.
The survey, based on 2013 survey data, provides a rare look at how non-profit/government organizations attract, motivate and incentivize their employees. Data includes hard-to-find statistics on the size and nature of short-term and long-term incentive pay practices, including the types of plans and vehicles used. More than 175 participants from nonprofit and government organizations responded to the survey.
Previously conducted in 2007 and 2011, this year’s incentive pay compensation surveys represent our third collaboration with WorldatWork. With this longitudinal data, we provide insight on the key compensation trends and explain the reasons behind them.
Compensation Trends: Nonprofit/Government Organizations:
- In 2013, 78% of nonprofit and government organizations reported using short-term incentive plans, while 16% reported using cash long-term incentive plans.
- Nonprofit and government organizations favor simplicity by operating a limited number of short-term incentive plans. Of the respondents, 68% report having three or fewer short-term incentive plans in place.
- The majority of organizations (62%) rely on 4 to 6 performance measures in their Annual Incentive Plans in order to reward performance across several different dimensions.
The survey, based on 2013 survey data, provides a rare look at how private companies attract, motivate and incentivize their employees. Data includes hard-to-find statistics on the size and nature of short-term and long-term incentive pay practices, including the types of plans and vehicles used, as well as private company equity sharing ratios, liquidity, and valuation provisions. More than 190 participants from private, for-profit organizations responded to the survey.
Previously conducted in 2007 and 2011, this year’s incentive pay compensation surveys represent our third collaboration with WorldatWork. With this longitudinal data, we provide insight on the key compensation trends and explain the reasons behind them.
Compensation Trends: Privately Held Organizations:
- More than 75% of companies with a short-term incentive plan offer more than one program, with 39% of respondents reporting four or more short-term incentive plans.
- Annual Incentive Plans, the most prevalent short-term incentive plan at private companies, are offered to employees at the exempt, salaried level and above at most organizations.
- In 2013, 56% of companies offered long-term incentive plans, down from 61% in 2011. Long-term cash plans are the most prevalent long-term incentive vehicle with 51% prevalence in 2013.
CHANGES IN ANNUAL INCENTIVE PLAN DESIGN
Overall, 37% of companies made changes to their annual incentive plan design in 2012 or 2013. The most common changes were to increase the target incentive opportunity for the CEO and/or CFO (43% of companies making a change to increase target award opportunities) or to change to the annual incentive performance metrics (35%). Companies continue to review and enhance the pay-for-performance relationship through changes to the annual incentive program.
|
Type of Change Reported in CD&A |
2012 No. of Cos. |
% of Cos. Reporting Changes |
|
|
2012 (n = 37) |
2011 (n = 43) |
||
|
Increase target award opportunities (CEO and/or CFO) |
16 |
43% |
28% |
|
Change in performance metrics used to fund awards |
13 |
35% |
42% |
|
Change in performance metric weighting/mix |
4 |
11% |
21% |
|
Adopt mandatory deferral mechanism |
4 |
11% |
n/a |
|
Change in maximum award payout |
3 |
8% |
12% |
|
Other Changes |
8 |
22% |
19% |
Note: Due to multiple responses, does not add up to 100%.
Change in Target Bonus Opportunity
Last year median target bonus opportunities for the CEO and CFO positions increased by 6 and 1 percentage points to 159% and 101% of salary, respectively. The target bonus opportunity for CEOs in the Technology industry increased by 50 percentage points in 2012 due to an increase in the target opportunity at Apple (from 50% to 100% of salary) and Verizon (from 187.5% to 250%). Conversely, in the Consumer Goods industry, target bonus opportunities decreased year over year due to new incumbents in these roles.
|
Industry |
Median Target Bonus as a % of Salary |
|||||
|
CEO |
CFO |
|||||
|
2012 |
2011 |
Change in %age Pts. |
2012 |
2011 |
Change in %age Pts. |
|
|
Automotive |
138% |
130% |
+8% |
88% |
88% |
0% |
|
Consumer Goods |
160% |
170% |
-10% |
90% |
100% |
-10% |
|
Financial Services |
n/m |
n/m |
n/m |
n/m |
n/m |
n/m |
|
Health Care |
145% |
145% |
0% |
101% |
100% |
+1% |
|
Insurance |
200% |
200% |
0% |
130% |
120% |
+10% |
|
Manufacturing |
142% |
156% |
-14% |
93% |
95% |
-2% |
|
Pharmaceutical |
150% |
150% |
0% |
97% |
91% |
+6% |
|
Retail |
190% |
168% |
+12% |
90% |
85% |
+5% |
|
Technology |
250% |
200% |
+50% |
135% |
121% |
+14% |
|
Total Sample |
159% |
153% |
+6% |
101% |
100% |
+1% |
Note: Financial Services industry is excluded since most companies in our study do not disclose target bonus opportunities for the Named Executive Officers.
Change in Performance Metrics
Of the companies that changed or plan to change the performance metric:
- Nine (9) companies added metrics to the current plan
- Two (2) companies reduced the number of metrics, and
- Two (2) companies kept the same number of metrics but replaced a metric in the incentive plan.
Several companies indicated that their rationale for changing annual incentive metrics was, in large part, to better align executive pay with the business strategy and shareholder interests:
- Caterpillar: Incorporated Operating Profit After Capital Charge (OPACC) as a measure, to reflect how the Company is utilizing its assets in order to generate shareholder value
- CIGNA: Added a customer loyalty metric in 2013 to emphasize its business strategy and focus on the customers it serves
- Hewlett Packard: Introduced year over year improvement in Return on Invested Capital as an annual incentive metric to focus executives on the business turnaround
ANNUAL INCENTIVE PLAN DESIGN / PRACTICES
Award Leverage
Most companies reviewed did not disclose a threshold level of performance required to receive a bonus payment. Instead, these companies disclosed a minimum bonus of $0. For the 37 companies that did disclose a threshold bonus, 50% of target is the most prevalent payout percentage. However 20 companies, disclose a minimum bonus payout of less than 50% of target with a majority of these companies paying out for results based on one of multiple plan metrics. A majority of companies (58%) have a maximum bonus opportunity of 200% of target bonus. Thirteen (13) companies have a maximum bonus of 250% of target or higher. Four (4) of these companies are in the Consumer Goods industry and three (3) are in the Technology industry.
|
Threshold as a % of Target (n=37) |
||
|
Range |
# of Cos. |
% of Cos. |
|
< 25% |
10 |
27% |
|
25% < 50% |
10 |
27% |
|
50% |
12 |
32% |
|
50% < 75% |
1 |
3% |
|
75 <100% |
4 |
11% |
|
Maximum as a % of Target (n = 78) |
||
|
Range |
# of Cos. |
% of Cos. |
|
100% < 150% |
2 |
3% |
|
150% < 200% |
16 |
21% |
|
200% |
45 |
58% |
|
200% < 250% |
2 |
3% |
|
> 250% |
13 |
17% |
Of the six (6) companies that made changes to their maximum bonus potential in 2012/2013, three (3) companies increased the maximum bonus potential and three (3) companies reduced the maximum. Two (2) of these companies (Allstate and Colgate-Palmolive) changed the maximum payout for the CEO only.
Annual Incentive Plan Metrics
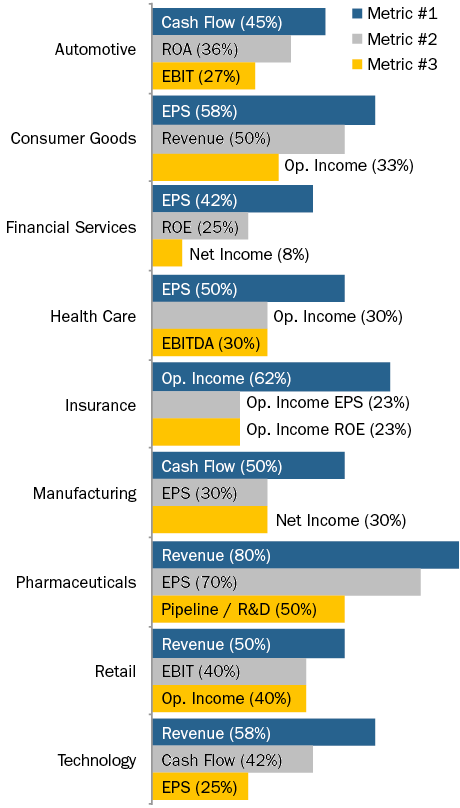
Similar to 2011, Revenue, EPS, Cash Flow and Operating Income continue to be the most prevalent metrics used across all companies, although we see some variation in metrics by industry. In 2013, 30% of companies disclose using two (2) metrics in their annual incentive programs, 29% use three (3) metrics, and 12% of companies use four (4) or more metrics. Approximately 85% of these companies use a profit-based metric in combination with Revenue and/or Cash Flow.
Refer to the chart below for the three (3) most prevalent metrics by industry:
|
Industry |
Actual Bonus as a % of Target Bonus – CEO |
|||||
|
2012 |
2011 |
|||||
|
25th%ile |
Median |
75th%ile |
25th%ile |
Median |
75th%ile |
|
|
Automotive |
69% |
102% |
131% |
130% |
153% |
186% |
|
Consumer Goods |
94% |
103% |
137% |
78% |
132% |
149% |
|
Financial Services |
44% |
80% |
120% |
111% |
114% |
130% |
|
Health Care |
103% |
127% |
157% |
116% |
127% |
159% |
|
Insurance |
112% |
130% |
144% |
85% |
106% |
130% |
|
Manufacturing |
100% |
107% |
146% |
119% |
136% |
162% |
|
Pharmaceutical |
125% |
142% |
156% |
130% |
144% |
161% |
|
Retail |
79% |
117% |
136% |
112% |
129% |
147% |
|
Technology |
90% |
99% |
124% |
75% |
100% |
149% |
|
Total Sample |
93% |
112% |
144% |
105% |
133% |
156% |
Note: Most companies in the Financial Services industry does not disclose target bonus. Figures for the Financial Services industry reflects actual bonus as a percentage of 3-year average actual bonus.
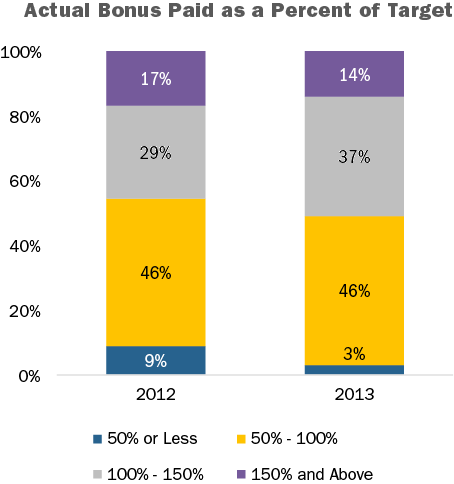
2012 Actual Bonus Payout
Similar to 2011, approximately 95% of companies awarded bonuses to their Named Executive Officers for 2012 performance. Overall, the median CEO bonus was 112% of target compared to 133% in 2011, indicating that 2012 performance generally exceeded par, but was not as strong as 2011 performance. Median 2012 bonus payouts in the Health Care, Insurance, Pharmaceutical and Retail industries exceeded target by 15 – 40 percentage points while payouts in the Automotive, Consumer Goods, Manufacturing and Technology industries were closer to target.
15% of companies in our study require executives to defer all or a portion of their annual incentive payout. Nearly 50% of companies that require a portion of the annual incentive award to be deferred are in the Financial Services industry. Among companies with mandatory deferrals outside of the Financial Services industry, two (2) companies pay a portion of the annual incentive in restricted stock units if the total payout exceeds a specific level:
- HCA Holdings: Any bonus payout above target is delivered 50% in cash and 50% in restricted stock units
- 3M: Annual incentive payouts in excess of 200% of target are paid in the form of restricted stock units
CONCLUSIONS
Companies are continuing to refine their annual incentive program to ensure executive pay is aligned with the Company’s business strategy and key success indicators. These recent trends also indicate that companies are modestly increasing CEO pay through the bonus opportunity and award leverage. Actual payouts for 2012, however, indicate stronger performance goals and moderately above target payouts, yet lower than the previous year. Revenue, EPS, Cash Flow and Operating Income continue to be the most prevalent annual incentive plan metrics with a majority of companies using two (30%) or three (29%) metrics to reward executives for company performance. We expect companies to continue to refine metrics and performance goals / leverage linkages in the annual incentive plan as shareholders and proxy advisory firms scrutinize the executive compensation program.