CAP reviewed chief executive officer (CEO) pay levels among 50 companies with fiscal years ending between August and October 2024 (defined as the Early Filers). 2024 financial performance was generally flat, which resulted in median bonus payouts of around target. However, bonus payouts for the CEO were up +14%, driven by companies with large increases that saw significant growth year over year. This report covers 2024 financial performance, CEO actual pay levels and annual incentive payouts for the Early Filers.
Key Findings
Performance: 2024 median financial performance – as measured by revenue, earnings before interest and taxes (EBIT), and earnings per share (EPS) – was generally flat and consistent with 2023 performance. In 2024, median revenue grew slightly (+1.6%), EBIT grew modestly (+3.9%) and EPS was flat (0.0%). One-year total shareholder return (TSR) was up double digits year-over-year (+15.2%).
CEO Pay: Median CEO total direct compensation increased +9% year over year, driven by a +14% increase in actual bonus payout and a +7% increase in the grant-date value of long-term incentives (LTI).
Annual Incentive Payout: For the second year in a row, median bonus payouts for CEOs were around target (i.e., 104% of target). Although financial performance was generally flat and annual incentive achievement was around target, CEO bonus payouts were up significantly. This is because, in general, companies with significant increases in bonus payouts (on average, approximately +280% increase) either rebounded from low payouts in 2023 or had continued sustained performance in 2024 and these increases were larger than the percentage change for companies that saw a decline in bonus (approximately 45%, on average).
2024 Performance
Financial performance for the Early Filers was generally flat for the second year in a row. Median revenue was up +1.6%, EBIT was up +3.9% and EPS was flat. In contrast, the S&P 500 experienced significant growth over the same period, fueled primarily by performance in the Financial Services and Technology sectors.
Median TSR performance continued to be strong among Early Filers and, for the second year in a row, was ahead of 1-year financial performance. At median, TSR was up +15.2% year over year. Macroeconomic factors, such as lower interest rates, easing of inflation and some improvement in the supply chain, impacted stock price results. The Technology sector saw significant increases given the advancements in artificial intelligence and related expectations for commercialization. One-year financial and TSR performance for the Early Filers underperformed the S&P 500, which experienced significant growth in 2024.
| Financial Metric (1) | 2023 Median 1-year Performance | 2024 Median 1-year Performance | ||
| S&P 500 | Early Filers | S&P 500 | Early Filers | |
| Revenue Growth | 5.6% | 3.7% | 4.3% | 1.6% |
| EBIT Growth | 6.2% | 0.2% | 6.4% | 3.9% |
| EPS Growth | 3.2% | 0.3% | 8.0% | 0.0% |
| TSR | 15.9% | 11.6% | 31.1% | 15.2% |
(1) Reflects companies in the S&P 500 as of February 2025. For the S&P 500, financial performance and TSR are as of September 30, 2024 and September 30, 2023. For Early Filers, financial performance and TSR are as of each company’s fiscal year end.
2024 CEO Actual Total Direct Compensation
CEO pay was up in 2024. Median total direct compensation – base salary plus actual bonus payout plus grant-date value of LTI – for the CEO was up +9%. This increase was largely delivered in the form of incentive compensation; actual bonus payout was up +14% and LTI was up +7% in 2024. LTI awards are generally approved in the first quarter (i.e., September 2023 – January 2024 for Early Filers) and increases in award value are typically to recognize strong company and/or individual performance from the prior year. Median base salary was generally flat (+1%) in 2024.
Note: Reflects same incumbent CEOs.
Although bonus payout continues to be around target (see Annual Incentive Plan Payout section), about one-third of the companies in our sample had significant increases in bonus payout year over year (on average, approximately +280% increase); some of the companies rebounded from 2023 performance while others had continued sustained performance. These increases were much larger than the declines for companies with lower bonus payout than prior year (on average, approximately -45% decline).
| Year over Year Change in Bonus Payout | # of Cos. | Avg. Bonus % Change | 2024 Median 1-year Performance | |||
| Revenue | EBIT | EPS | TSR | |||
| Increase: >30% | 15 | 279% | 1.6% | 14.6% |
(6.2%) |
19.4% |
| Increase: 0 – 30% | 13 | 15% | 4.2% | 4.3% |
(0.8%) |
24.5% |
| Decrease | 13 |
(46%) |
(4.0%) |
(2.0%) |
(10.9%) |
(0.1%) |
Annual Incentive Plan Payout
The median annual incentive payout was around target (104%) in 2024. Median and 75th percentile payouts as a percentage of target were consistent year over year. However, there was a modest increase in the 25th percentile bonus payout (73% of target in 2024 vs. 61% of target in 2023).
| Summary Statistics | Annual Incentive Payout as a % of Target | ||
| 2022 | 2023 | 2024 | |
| 75th Percentile | 151% | 130% | 135% |
| Median | 119% | 102% | 104% |
| 25th Percentile | 86% | 61% | 73% |
For the second year in a row, approximately 50% of companies in our sample had an annual incentive payout that was at or above target (median payout of 134% of target for these companies). While performance was robust for the “at or above target payout” companies, it was not as strong as 2023 performance. However, median payouts for these companies were higher than prior year.
For companies with below target payouts, financial performance was flat or down year over year while TSR was up modestly. Median payout for these companies was also up from last year (71% of target in 2024 vs. 60% of target in 2023).
| Financial Metric (1) | 2023 Median | 2024 Median | ||
| Below target payout (n=22) | At/above target payout (n=24) | Below target payout (n=22) | At/above target payout (n=24) | |
| Revenue Growth |
(2.6%) |
9.9% |
(0.2%) |
2.3% |
| EBIT Growth |
(15.3%) |
11.2% | 1.6% | 4.6% |
| EPS Growth |
(11.4%) |
8.7% |
(9.7%) |
10.6% |
| TSR Growth | 2.3% | 17.8% | 7.4% | 17.9% |
| Annual incentive payout | 60% of target | 129% of target | 71% of target | 134% of target |
(1) 1-year financial performance and TSR is as of each company’s fiscal year end.
Similar to last year, annual incentive payouts had a normal distribution though fewer companies had a payout below 50% of target in 2024 (13%) than in 2023 (20%). Three factors – the distribution of payouts, the median payout of 104% of target, and the significant increase in CEO bonus payout year over year – suggest that, even when a company provided a higher payout, it was generally within the same payout bucket as 2023 (e.g., if the payout was between 50% – 100% of target in 2023, it was likely between 50% – 100% of target in 2024).
Note: N = 46. Reflects corporate payout factor and excludes companies with a discretionary bonus plan.
Approximately 75% of companies in our sample provided a payout to the CEO that was +/-5 percentage points from the corporate funding factor (i.e., the percentage at which the annual incentive funds based on company performance). If a company wanted to adjust an executive’s payout, as approximately 25% of the Early Filers did, there are a couple of ways in which it could be accomplished – through individual performance or discretionary adjustment. Less than half of the Early Filers use individual performance as a component of the annual incentive payout. Companies use individual performance to align the incentive payout with an executive’s contribution to the company and the results can raise or lower an executive’s payout relative to corporate performance. Companies can also make discretionary adjustments to recognize overall company performance (more broadly than incentive plan metrics). Similar to individual performance, these adjustments may raise or lower the bonus payout. Only a handful of Early Filers made discretionary adjustments in 2024.
Nearly 10% of companies reduced the CEO’s payout from the corporate funding factor in 2024. On average, companies that lowered the payout reduced it by 30 percentage points in both 2024 and 2023. The number of companies that increased the CEO’s payout was the same as last year (15% of companies). However, the average increase was somewhat higher in 2024 (23 percentage points) than in 2023 (16 percentage points).
Looking Ahead
2024 was a year of modest performance among the Early Filers, which resulted in around target bonus payouts at median. Some companies saw some improvement in financial performance, which resulted in a significant increase, overall, in bonus payouts year over year. Given the strong 2024 TSR performance, we would anticipate modest increases to LTI awards for the CEO in 2025.
There is uncertainty ahead for 2025 because of tariffs and continued geopolitical unrest. We anticipate that some companies will pass along the impact of tariffs to their customers while others may take a wait and see approach, particularly if the company’s industry is not significantly impacted. This macroeconomic uncertainty is already impacting TSR, which is slightly down since September 30, 2024; it is unknown the full impact tariffs will have on the economy and resulting company performance. Since tariffs are still being implemented with more proposed, as of the time of this publication, companies may or may not have incorporated the impacts of tariffs on incentive plan targets during the goal setting process. Therefore, companies should monitor the impact during the year and, at year end, ensure final incentive plan payouts align with overall company performance and the shareholder experience.
Early Filers’ Company Sample
CAP’s study reflects 50 companies with fiscal years ending between August and October 2024. Industry sectors reviewed include: Communication Services, Consumer Discretionary, Consumer Staples, Financials, Health Care, Industrials, Information Technology and Materials. Revenues for these companies ranged from $1.5 billion – $391 billion (median revenues of $11.9 billion); median fiscal-year-end market capitalization was $16.1 billion.
Rebecca Friday, Grace Tan and Alex Barrionuevo provided research assistance for this report.
Compensation Advisory Partners (CAP) conducted a study of executive compensation trends in the regional banking industry. The study examined 2023 CEO compensation levels and pay practices among 40 regional banks across three groups based on FY’23 asset size: $1B – $5B in assets (“small banks”; n=13), $5B – $10B in assets (“medium banks”; n=13) and $10B – $20B in assets (“large banks”; n=14). This report compares both compensation levels and incentive plan design across the groups and highlights current issues facing the banking industry in 2024.
Highlights
1 |
2023 Performance and Pay Outcomes Total CEO compensation in 2023 decreased 2 percent on average across all asset groups, compared to a 6 percent average increase in 2022 and an 11 percent increase in 2021. Banks across the board experienced declines in earnings, profitability and Total Shareholder Return (TSR) in the wake of industry-wide turmoil and economic uncertainty. CEO pay for the medium and large banks decreased, primarily driven by sharp year-over-year declines in bonus payouts and the small banks had a modest increase year-over-year, as their bonuses were modestly up from prior year. Despite a modest increase among the small banks and decreases among the medium and large banks, compensation levels year-over-year would have been lower if banks had not intervened to adjust their financial metrics or pay discretionary bonuses to account for the impact of the 2023 regional banking crisis. Common adjustments included the interest rate environment, the special FDIC assessment, and deposit volumes. |
2 |
Total Pay Mix As asset size increases, a higher percentage of banks’ CEO total pay shifts from fixed compensation to at-risk or variable compensation, and a larger emphasis is placed on long-term vs. annual incentives. However, lower bonus payouts due to poor financial performance placed greater emphasis on base salaries and long-term incentives in 2023 for medium and large banks. |
3 |
Annual and Long-term Incentive Plan Metrics The most prevalent metrics for annual and long-term incentive plans remained consistent to prior years. For annual incentives, the most prevalent metrics generally include Earnings Per Share (EPS), Efficiency Ratio, Asset Quality and Return on Assets (ROA), with the small and medium banks also considering Loan and Deposit levels more frequently than large banks. Performance against individual goals is prevalent at over half the banks in our sample. For long-term plans, relative TSR, Return on Equity (ROE), EPS and ROA are frequently used together. |
4 |
Use of Environmental, Social and Governance (ESG) Metrics in Incentive Plans Among all banks in our study, the inclusion of ESG metrics in annual incentive plans continues to be a minority practice, and it decreased slightly year-over-year. Overall, in 2023 20 percent (n=8) of the banks considered ESG as part of the bonus decision – primarily as an award component – compared to 25 percent (n=10) in 2022. The ESG categories banks most frequently disclose relate to Human Capital and Diversity, Equity & Inclusion (DE&I). There has been a general push-back on ESG-related priorities and their use in incentive plans. We expect this area of plan design to evolve as organizations confirm their ESG objectives and their link to business outcomes. |
5 |
Looking Ahead Given the current banking landscape and operational environment, there continues to be uncertainty surrounding the performance outlook for 2024. Against the backdrop of moderating inflation, looming rate cuts and the upcoming presidential election, banks’ shareholder returns have moderately increased year-to-date; however, bank returns and profitability are down in the first half of 2024 compared to the first half of 2023, highlighting the industry’s challenges in the wake of last year’s regional banking crisis. |
2023 Performance and Pay Outcomes
Performance Results
Bank financial performance was down in 2023 as banks shifted their priorities to focus on deposit gathering vs. loan growth following bank shutdowns at Silicon Valley Bank, Signature, and First Republic early in 2023. Many banks also undertook cost-cutting measures to rein in pandemic-era overexpansion and withstand persistent economic uncertainty. Amid this environment, earnings, profitability and return metrics largely declined in 2023 vs. 2022.
Among the three groups, small banks performed the best in 2023, with EPS and Net Income declining at a slower rate compared to medium and large banks. As of December 31, 2023, small banks also outperformed in TSR over 1- and 3-year periods, although the 1-year TSR still reflected a 4.5 percent decline compared to the previous year.
|
Metric |
Median Percent Change |
||
|
$1B – $5B |
$5B – $10B |
$10B – $20B |
|
|
EPS |
-4.4% |
-6.1% |
-15.1% |
|
Net Income |
-4.2% |
-6.8% |
-9.4% |
|
Pre-Tax Operating Income |
-3.4% |
-6.5% |
-10.4% |
|
Pre-Provision Net Revenue |
-2.3% |
-8.5% |
-7.7% |
|
Return on Equity |
21 (bps) |
-127 (bps) |
-122 (bps) |
|
1-Year TSR at 12/31/23 |
-4.5% |
-6.8% |
-11.4% |
|
1-Year TSR at 12/31/22 |
-3.9% |
4.4% |
-1.7% |
|
3-Year TSR at 12/31/23 |
8.5% |
7.3% |
3.6% |
|
3-Year TSR at 12/31/22 |
2.0% |
5.7% |
2.1% |
Note: bps – Basis points. Source: S&P Capital IQ Financial Database.
CEO Annual Incentive Payouts
At median, CEO annual incentive payouts were at or below target across all groups and notably decreased 18 percent, 40 percent and 46 percent year-over-year for the small, medium and large banks, respectively; 28 banks (70 percent of total sample) paid bonuses below target compared to 11 last year. Payouts among the three groups notably decreased at all percentiles year-over-year, which can be attributed to the banks’ weaker performance in 2023.
Annual incentives would have decreased further if not for adjustments to financial metrics. In response to the banking crisis, just over one-third of companies with formulaic or goal-based plans modified their bonus plan metrics or provided a discretionary payout. 8 percent of these banks (n=3) would have paid no annual incentive but opted to adjust their metrics or provide a discretionary bonus. Banks commonly adjusted for the interest rate environment, the special FDIC assessment, and deposit volumes.
Total Pay Changes
Consistent with 2023 financial performance and annual incentive payouts as a percent of target, CEO actual total compensation1 (base salary, annual incentive payouts, and long-term incentives) increased modestly for the small banks and decreased for the medium and large banks. Large banks experienced the steepest decline in total compensation (-7 percent), followed by medium banks (-1 percent), while CEO pay at small banks rose by 3 percent. The 7 percent decline at large banks was primarily driven by a 30 percent drop in annual incentive payouts. Medium banks saw a 1 percent decrease, also largely due to a 26 percent reduction in annual incentives, though this was partially offset by a 6 percent increase in long-term incentives. Small banks saw modest increases of 3 percent to 4 percent in CEO cash compensation, while long-term incentive values remained flat year-over-year for both small and large banks. Long-term incentive grant values were less influenced by company performance and were generally determined by competitive market positioning. The significant decrease in annual bonuses for medium and large banks was attributable to their weak financial performance in a challenging operating environment. Additionally, bonuses fell because performance goals had been set prior to the 2023 banking crisis, as banks shifted their strategy to focus on new priorities. Approximately 75 percent of medium and large banks paid bonuses below target, while around 60 percent of small banks did the same. Like in 2022, base salary values remained steady across the banks, with median increases ranging from 4 percent to 6 percent.
Note: Excludes companies with a CEO transition.
Chief Executive Officer Pay Mix
Similar to our findings from prior years, CEOs at the larger banks have higher overall pay levels and more of their total pay delivered in at-risk or variable compensation (i.e., annual or long-term incentives). Conversely, CEOs at smaller banks are often paid more fixed compensation (i.e., base salary). The portion of total compensation delivered in the form of annual incentives shrunk for both medium banks – from 32 percent in 2022 to 19 percent in 2023 – and large banks – from 34 percent in 2022 to 24 percent in 2023 – stemming from the steep year-over-year decline in payouts for these groups. Since the CEO pay mix reflects actual compensation, greater emphasis is placed on base salary and long-term incentives in 2023 for medium and large banks. The pay mix for small banks was similar year-over-year.
Pay Practices
Annual Incentive Plans
The most common approach to funding annual incentive plans is "goal attainment," where actual financial performance is measured against pre-established targets set at the start of the fiscal year. The banks in our sample typically utilize several corporate metrics when determining their annual incentive payouts. Approximately 75 percent of the small, medium and large banks use three or more weighted financial metrics. EPS, Efficiency Ratio, Asset Quality (i.e., non-performing assets, non-performing loan ratio) and ROA are among the most prevalent metrics used at these banks. Among the banks that use them, Earnings (EPS and Net Income) were typically weighted more (on average approximately 40 percent of the total plan) than Returns (ROA or ROE), Efficiency Ratio and Asset Quality metrics (approximately 15 to 25 percent of the total plan). The small and medium banks differ from the large banks in that they more frequently use Loan or Deposit measures in their plans, with these metrics accounting for no more than 25 percent of the total plan.
Individual goals are prevalent among all asset groups. The small and medium banks predominantly incorporate individual performance as a standalone weighted metric (typically 20 percent weighting), while over half of the large banks that measure individual performance use a discretionary assessment. The medium and large banks are more likely to incorporate strategic goals such as audit quality, risk management, net promoter score, succession planning, and customer service.
Long-term Incentive (LTI) Plans
The most common long-term incentives used across industries, including banking, are stock options, time-vested stock (restricted stock or restricted stock units), and performance-vested stock. Similar to the broader market, the banks in our sample take a portfolio approach to their LTI plans, with around 70 percent of them granting two or three types of LTI vehicles. The small and medium banks more frequently use a single LTI vehicle (37 percent, on average), and only one bank in the entire sample does not grant equity. The LTI mix among the three groups is consistent, with stock options continuing to be the least utilized equity vehicle – on average about 0 to 8 percent of the overall LTI mix. Time-vested RS typically comprises about 30 to 45 percent of the LTI mix among these banks, with performance plans making up the bulk (about 55 to 65 percent) of LTI plans in the total sample.
Performance-based awards are typically granted annually and have overlapping 3-year performance periods. Payouts can fluctuate based on achievement of performance measures, and the upside is normally limited to 150 to 200 percent of the target level. Approximately 80 percent of companies in each asset grouping (that utilize performance plans) measure performance against two to four metrics. The most prevalent metrics used are Returns, relative TSR and EPS for all three groupings, and it is common that two of these measures are paired together to determine all, or the majority of, the payout.
TSR is almost exclusively measured on a relative basis, often measured against either the company-defined peer group or an industry index. In our sample, relative TSR is used mostly as a weighted metric, and only 5 percent of all banks use it as a modifier of the calculated payout. Other common relative metrics include ROE, ROA and EPS growth. Among the total sample, approximately 60 percent of banks use a relative measure other than TSR.
ESG in Incentive Plans
Among our sample, 20 percent of banks included ESG goals in their annual incentive plans for 2023. Over the past year, ESG issues have become increasingly politicized and remain a hot-button issue for employees, activist investors, institutional investors, politicians, and the public. Companies across industries have modified their DE&I policies following threats of legal action from conservative groups; some have reduced or removed DE&I components from their executive pay structures, while others are shifting from DE&I metrics to broader human capital or workforce-related measures. Against this backdrop, among the banks in both this and last year’s study we have seen a slight decline in the use of ESG metrics in incentive plans. Two banks removed ESG-related metrics from their plans while one added it, generating a net loss of one ESG-using bank. This year, three banks have standalone weighted components in their annual incentive plans tied to ESG (weighted 10 to 20 percent), a unique practice among the sample. The remaining banks measure performance on a qualitative basis either as part of a standalone strategic or individual component (weighted 15 to 25 percent). None of the banks in this year's sample made discretionary adjustments to plan funding. Given the rise in anti-ESG sentiment and fears of backlash, banks may be hesitant about adding new goals and may rethink the ways in which they currently incorporate ESG into their incentive plans. Wall Street banks have already begun to deemphasize DE&I initiatives, which may have a cascading effect throughout the financial services industry.
Looking Ahead
The year 2024 has been marked by unpredictability. As November draws near, the market is bracing for the outcome of one of the most divisive and turbulent campaign cycles in recent history. The Supreme Court’s recent decision to overturn the Chevron doctrine has raised questions about existing federal agency rules, creating short-term uncertainty for regulated industries, including banking. Meanwhile, with inflation showing signs of easing, the Federal Reserve is widely expected to cut interest rates at its September meeting, a move that could have significant implications for bank financial performance and incentive plan outcomes.
As of the 2nd quarter of 2024, regional banks have announced negative year-over-year earnings and returns, lower net interest margins and slower loan growth, though year-to-date TSR is up in the high single digits. However, it remains to be seen how the banking industry will respond to the evolving political and economic landscape for the remainder of the year. The economy remains resilient and fears of a damaging recession are waning, with jobless claims staying relatively low in the face of high interest rates and consumer spending increasing.
Each bank's financial performance is influenced by various factors, including asset size, product mix, sector concentration, growth strategy, and loan portfolio. As we approach the end of 2024, all banks will need to strike a balance between aligning pay with financial results and shareholder returns.
For questions or more information, please contact:
Kelly Malafis
Partner
[email protected]
212-921-9357
Shaun Bisman
Partner
[email protected]
212-921-9365
Theo Allen
Associate
[email protected]
646-568-1157
Hanna Borsack and Becca Friday provided research assistance for this report.
Regional Banks in CAP’s Study (n=40)
Small Banks
($1B – $5B in assets)
- Bar Harbor Bankshares
- Capital City Bank Group, Inc.
- Community West Bancshares
- Enterprise Bancorp, Inc.
- Evans Bancorp, Inc.
- Farmers National Banc Corp.
- First Business Financial Services, Inc.
- First Financial Northwest, Inc.
- LCNB Corp.
- MVB Financial Corp.
- National Bankshares, Inc.
- Oak Valley Bancorp
- Sierra Bancorp
Medium Banks
($5B – $10B in assets)
- 1st Source Corporation
- Amerant Bancorp Inc.
- Camden National Corporation
- CNB Financial Corporation
- German American Bancorp, Inc.
- Heritage Commerce Corp
- Heritage Financial Corporation
- Independent Bank Corporation
- National Bank Holdings Corporation
- Park National Corporation
- Stock Yards Bancorp, Inc.
- Univest Financial Corporation
- Westamerica Bancorporation
Large Banks
($10B – $20B in assets)
- Banner Corporation
- Berkshire Hills Bancorp, Inc.
- Brookline Bancorp, Inc.
- Community Financial System, Inc.
- Enterprise Financial Services Corp
- First Busey Corporation
- First Commonwealth Financial Corporation
- First Foundation Inc.
- First Merchants Corporation
- Heartland Financial USA, Inc.
- Renasant Corporation
- Seacoast Banking Corporation of Florida
- Trustmark Corporation
- WesBanco, Inc.
1 For 2023, includes 2023 base salary, annual incentive payout based on 2023 performance and 2024 long-term incentive grants. For 2022, includes 2022 base salary, annual incentive payout based on 2022 performance and 2023 long-term incentive grants.
CAP reviewed chief executive officer (CEO) pay levels among 50 companies with fiscal years ending between August and October 2023 (defined as the Early Filers). 2023 financial performance was generally flat, which resulted in median bonus payouts of around target. Median CEO total direct compensation was up +7%, largely delivered in the form of long-term incentive awards. This report covers 2023 financial performance, CEO actual pay levels and annual incentive payouts for the Early Filers.
Key Findings
Performance: 2023 median financial performance – as measured by revenue, earnings before interest and taxes (EBIT), and earnings per share (EPS) – was generally flat. This is in stark contrast to 2021 and 2022 where companies experienced tremendous growth after weaker 2020 performance (impacted by COVID). In 2023, median revenue grew slightly (+3.7%), and EBIT and EPS were flat (+0.2% and +0.3%, respectively). One-year total shareholder return, or TSR, was up double digits year-over-year (+11.6%) as stock prices rebounded from 2022.
CEO Pay: Median CEO total direct compensation increased +7% year over year, driven by an +11% increase in the grant-date value of long-term incentives (LTI). Median bonus payout was down year over year (-11%), reflective of more modest performance.
Annual Incentive Payout: Overall, 2023 median bonus payouts for CEOs were at target (i.e., 102% of target). Payout for the CEO was generally in line with the corporate funding factor (i.e., the percentage at which the annual incentive funds based on company performance), although companies who made a discretionary adjustment (up or down) were more likely to do so when funding was below target.
2023 Performance
Financial performance in 2023 was generally flat compared to 2022. Median revenue was up +3.7%, and EBIT and EPS were flat (up +0.2% and +0.3%, respectively). In contrast, performance in 2022 was strong, with median growth of +9 to +12% for revenue, EBIT and EPS.
TSR growth was strong in 2023 and, at median, ahead of 1-year financial performance. Median TSR was up +11.6% year over year. The stock market has been volatile post-pandemic and further impacted by macroeconomic issues such as inflation, higher interest rates, supply chain difficulties, and geopolitical instability. One-year financial and TSR performance for the Early Filers slightly underperformed the S&P 500, which experienced modest growth in 2023.
|
Financial Metric (1) |
2022 Median 1-year Performance |
2023 Median 1-year Performance |
||
|
S&P 500 |
Early Filers |
S&P 500 |
Early Filers |
|
|
Revenue Growth |
11.1% |
11.9% |
5.7% |
3.7% |
|
EBIT Growth |
8.8% |
9.6% |
4.8% |
0.2% |
|
EPS Growth |
8.9% |
8.9% |
2.5% |
0.3% |
|
TSR |
(13.8%) |
(14.6%) |
15.0% |
11.6% |
(1) Reflects companies in the S&P 500 as of December 2023. For the S&P 500, financial performance and TSR are as of September 30, 2023 and September 30, 2022. For Early Filers, financial performance and TSR are as of each company’s fiscal year end.
CEO Actual Total Direct Compensation
CEO pay continued to rise in 2023. Median total direct compensation – base salary plus actual bonus payout plus grant-date value of LTI – for the CEO was up +7%. This increase was largely delivered in the form of LTI (+11%). Long-term incentive awards are generally approved in the first quarter (i.e., September 2022 – January 2023 for Early Filers), and significant increases in award value are typically provided to recognize strong company and/or individual performance from the prior year.
For the second year in a row, median bonus payout was down year over year (-11%), reflective of the flat financial growth (although 2022 financial performance was strong, bonus payout was down from record highs in 2021). Median base salary was up (+3%) in 2023.
Note: Reflects same incumbent CEOs. Excludes companies that did not pay a bonus in the prior year (and, therefore, 1-year growth for these companies is not meaningful).
When considering the tenure of the CEO, those with less than three years of service received larger salary and LTI increases (than those who have been in their role for more than three years) to position pay more competitively with market. Interestingly, those who have less tenure also saw steeper declines in the bonus payout year over year, driven by above target-payouts in 2022 and well-below-target payouts in 2023. Approximately half of these companies have a transformation plan in place to improve performance in the coming years, which combined with actual payouts, suggested more volatile performance outcomes during this transition time. One-year change in pay for CEOs who have been in the role for more than three years aligned with overall findings for the Early Filers.
Annual Incentive Plan Payout
The median annual incentive payout was around target (102%) in 2023 and reflective of flat financial performance. This is down from 2022, with 75th and 25th percentiles also lower than prior year.
|
Summary Statistics |
Annual Incentive Payout as a % of Target |
||
|
2021 |
2022 |
2023 |
|
|
75th Percentile |
177% |
147% |
130% |
|
Median |
149% |
119% |
102% |
|
25th Percentile |
122% |
86% |
64% |
Approximately 50% of companies in our sample had an annual incentive payout that was at or above target in 2023 (median payout of 129% of target). These higher performing companies saw modest growth at median for revenue, EBIT and EPS growth, and had strong TSR performance. For companies with below target performance (median payout of 61% of target), median revenue growth was down slightly (-2.6%) while EBIT and EPS performance was down double digits (-15.6% and -11.4%, respectively). Median TSR increased for both groups. TSR was up significantly (+17.8%) for at or above target performers and up slightly (+2.3%) for below target performers.
|
Financial Metric (1) |
2022 Median |
2023 Median |
||
|
Below target payout (n=14) |
At/above target payout (n=31) |
Below target payout (n=22) |
At/above target payout (n=24) |
|
|
Revenue Growth |
6.4% |
14.3% |
(2.6%) |
9.8% |
|
EBIT Growth |
(5.7%) |
18.0% |
(15.6%) |
9.6% |
|
EPS Growth |
(4.4%) |
10.3% |
(11.4%) |
6.4% |
|
TSR Growth |
(24.0%) |
(6.8%) |
2.3% |
17.8% |
|
Annual incentive payout |
74% of target |
129% of target |
61% of target |
129% of target |
(1) 1-year financial performance and TSR is as of each company’s fiscal year end.
In 2023, annual incentive payouts had a normal distribution with companies nearly evenly split in receiving payout either above or below target. This is a change from the prior two years when a majority of companies paid out at or above target. The distribution of payouts coupled with the median incentive payout around target suggests the difficulty in setting goals amid unpredictable macroeconomic factors.
Note: N = 46. Reflects corporate funding factor and excludes companies with a discretionary bonus plan.
Approximately one-third of Early Filers incorporate individual performance in the annual incentive payout for the CEO. This means that the CEO’s payout as a percentage of target may be higher or lower than that of the corporate funding factor (i.e., the percentage at which the annual incentive funds based on company performance). 70% of companies in our sample provided a payout to the CEO that was +/-5 percentage points from the corporate funding factor in 2023.
Nearly 15% of companies reduced the CEO’s payout from the corporate funding factor in 2023, which is up from 2022 (4% of companies) and 2021 (7% of companies). However, the average reduction in payout was lower in 2023 than in prior years. On average, companies that lowered the CEO payout in 2023 reduced it by 30 percentage points compared to 39 points in 2022 and 102 points in 2021. The number of companies that increased the CEO’s payout by more than 5 points above the corporate funding factor was up slightly from last year (17% in 2023 vs. 11% in 2022) but down from 2021 (when it was 33%). However, the increase in payout was more modest, with companies raising the CEO’s payout by, on average, 15 points in 2023 compared to 20 points in 2022 and 34 points in 2021.
Looking Ahead
2023 financial performance was generally flat compared to 2022. We continued to see an increase in total direct compensation for CEOs, although bonus payouts were down moderately year over year. These increases in total direct compensation were largely delivered through LTI and reflective of strong financial performance in 2022 or providing more competitive pay for newer CEOs. We anticipate that companies will provide modest increases in LTI in 2024 given 2023 outcomes although CEOs newer in their roles will likely continue to receive more significant increases. Given the continuing macroeconomic factors (U.S. presidential election, geopolitical unrest, continued supply chain disruptions), 2024 performance expectations are still largely unknown.
Early Filers’ Company Sample
CAP’s study reflects 50 companies with fiscal years ending between August and October 2023. Industry sectors reviewed include: Communication Services, Consumer Discretionary, Consumer Staples, Financials, Health Care, Industrials, Information Technology and Materials. Revenues for these companies ranged from $1.4 billion – $383 billion (median revenues of $11.9 billion); median fiscal-year-end market capitalization was $16.4 billion.
Kristine Stanners, Rebecca Friday and Grace Tan provided research assistance for this report.
The challenging stock market conditions of the last two years may have companies questioning their continued use of stock options. Our analysis of stock options granted in 2022 among S&P 500 companies finds that the majority of stock options (54% of all option grants) granted are underwater (i.e., the current stock price is below the option exercise price) and on average, the stock options are 23% underwater. That means that for the average executive holding stock options granted in 2022, the stock price would have to increase by more than 30% for the stock option to have any intrinsic value.
Recent Stock Option Struggles
CAP analyzed CEO equity grants among S&P 500 companies to understand the degree to which stock options were out-of-the-money, given the challenging stock price environment. It should be noted that many companies have moved away from granting stock options. In fact, among the S&P 500, only 43% of CEOs received stock options. This reflects a broad market shift where options have been replaced by performance share units and restricted stock units.
|
S&P 500 |
% |
|
Companies Granting Stock Options |
43% |
|
Stock Option Grants Currently Underwater |
54% |
|
Average % Change from Exercise Price |
-23% |
As of November 30, 2023, 54% of these awards are underwater which means they currently have no value. Among these underwater awards, the current share price is 23% below the exercise price, on average. While it is still early in the vesting schedule for these awards, share price depreciation at such levels may leave employees wondering if their options will have realizable value as it will take significant stock price appreciation to get back to break-even.
In looking more closely at the sample, we find that there is a broad range of how far out-of-the-money stock options are across companies. For example, 11% of the stock options are more than 50% out-of-the-money, meaning that the stock price would have to more than double for them to begin to have intrinsic value. A full third of the options granted are more than 30% underwater.
|
Percent Change From Exercise Price |
Underwater Grants |
% of Underwater |
|
0% to -10% |
29 |
25% |
|
-10% to -20% |
32 |
28% |
|
-20% to -30% |
16 |
14% |
|
-30% to -40% |
19 |
17% |
|
-40% to -50% |
5 |
4% |
|
-50%+ |
13 |
11% |
|
Total |
114 |
– |
When we look at the underwater stock options by industry, we find that there are differences in the percentage of underwater options and the degree to which they are underwater across industry sectors. For example, all five Communications Services companies had underwater options that were on average 33% underwater. Underwater options were much less of an issue in the Information Technology sector, where companies have recently been rallying and recovering from share price depression.
|
Industry Sector |
Annual Option Grants |
% of Grants Underwater |
Average % Underwater |
|
|
Underwater |
Total |
|||
|
Communication Services |
5 |
5 |
100% |
-33% |
|
Consumer Discretionary |
10 |
20 |
50% |
-25% |
|
Consumer Staples |
15 |
22 |
68% |
-22% |
|
Energy |
0 |
4 |
0% |
– |
|
Financials |
12 |
25 |
48% |
-22% |
|
Health Care |
33 |
46 |
72% |
-28% |
|
Industrials |
18 |
46 |
39% |
-24% |
|
Information Technology |
7 |
21 |
33% |
-23% |
|
Materials |
10 |
15 |
67% |
-18% |
|
Real Estate |
1 |
4 |
25% |
– |
|
Utilities |
3 |
5 |
60% |
-25% |
|
Total |
114 |
213 |
54% |
-23% |
Handling Underwater Stock Option Concerns
Underwater stock options can create retention issues throughout organizations. In times of economic uncertainty and poor stock market conditions, employees rightfully may worry that underwater stock options will never achieve the upside that was once promised. Executives may feel that their outstanding underwater stock option awards are worthless, which may leave them feeling demotivated to remain at the company for the long haul. Similarly, younger employees who are holding stock options that are deeply underwater may look for more attractive opportunities at high-growth potential organizations. Moving on to a new company may become more appealing, especially if the offer includes a sign-on award at a new employer which may represent a fresh start from an equity compensation perspective. In general, employees may not consider the long-term potential of their stock options and instead focus on the current lack of value.
To mitigate these potential retention concerns, employers need to provide clear messaging to employees about the long-term potential provided by stock options, and potentially consider redesigning their equity grant practices. Among the S&P 500 sample, the most common (84%) exercise term for stock option grants is 10 years. This decade-long time horizon should provide plenty of opportunity for the share price to recover, and potentially grow far beyond the exercise price. On the flip side, currently depressed share prices also mean that the next annual stock option awards will be granted at a lower exercise price and therefore should have more upside potential over the new term.
If employees have been put off by multiple cycles of underwater options, another alternative to consider is redesigning and rebalancing the equity compensation mix. Among the S&P 500 sample, stock options represent 19% of the average equity compensation package. Excluding CEOs who do not receive options, the average CEO receives 38% of equity compensation in stock option awards. Most S&P 500 companies use multiple equity vehicles and place more weight on full-value share awards in their long-term incentive plans, which is a market best practice and shields executive compensation packages from excessive macroeconomic risk. While stock options continue to make sense at growth-stage companies, the associated retention and recruitment risks in times of share price depression may cause mature companies to fall behind in the war for talent.
Conclusion
Periods of economic uncertainty raise many compensation issues as companies look to properly incentivize and retain key talent despite depressed stock prices. While stock options remain appropriate for incentivizing employees at growth-stage companies, mature organizations must strike the right balance of equity compensation to navigate the retention and recruitment risks during these periods. With extreme stock market volatility expected to continue in the coming years, companies may benefit from emphasizing equity compensation based on multi-year financial goals and relative stock price performance rather than boom-or-bust stock option grants. Whether or not an equity program redesign is under consideration, clear communication about the future potential of equity awards, including underwater options, remains vital.
Compensation Advisory Partners (CAP) is conducting a market pulse survey to get a sense of banks’ compensation expectations for the balance of 2023 and initial thinking for 2024. Questions will cover salary increases, 2023 projected bonus funding and retention awards. We estimate the survey will only take 5 minutes to complete and are asking for submissions no later than Friday, June 30. We will distribute results on an aggregate basis to all participants at no cost. Individual results will be kept confidential.
2022 Results
Following an exceptional 2021 for the banking industry, 2022 performance results were mixed with results varying significantly from bank to bank based on business mix. Overall, revenue increased in 2022, driven by high interest rates. At the same time, net Income declined somewhat but remained well-above 2020 levels. In line with these results, CEO compensation increased in 2022 but more modestly than it did in 2021.
|
Summary Data (n=55) |
Change in Total CEO Compensation |
|
|
2021 vs. 2020 |
2022 vs. 2021 |
|
|
75th Percentile |
+30.1% |
+15.9% |
|
Median |
+21.5% |
+7.0% |
|
25th Percentile |
+12.6% |
+0.0% |
2022 bonuses, which payout based on annual performance results, paid out above target, though to a lesser degree than 2021.
|
Summary Data (n=51) |
CEO Bonus as a % of Target |
|
|
2021 |
2022 |
|
|
75th Percentile |
162% |
155% |
|
Median |
143% |
130% |
|
25th Percentile |
128% |
112% |
2023 Results To-Date and Outlook
The first half of 2023 has been a volatile period in the banking industry, marked by the failures of Silicon Valley Bank, Silvergate, Signature, and First Republic in the U.S. and Credit Suisse internationally. In the wake of these bank failures, the macroeconomic uncertainty that lies ahead and potential regulation and the impact it could have on performance has led to depressed stock prices for many banks. The S&P 500 Banking index has decreased 14% since the end of 2022 compared to the broader S&P 500, which has increased 10% over the same period.
Many banks are beginning to consider the impact these dynamics will have on their compensation programs. CAP is conducting a market pulse survey to get a sense of banks’ compensation expectations for the balance of 2023 and initial thinking for 2024.
Please use the link below to participate in the survey. The survey should only take 5 minutes to complete and the deadline to participate is Friday, June 30. We will distribute results on an aggregate basis to all participants at no cost. Individual results will be kept confidential.
Click here to participate in the survey.
If you have any questions, please contact Kelly Malafis ([email protected]), Eric Hosken ([email protected]), Mike Bonner ([email protected]), or Shaun Bisman ([email protected])
Kelly Malafis and Michael Bonner discuss compensation practices and trends in the banking and financial services industry.
CAP’s report examines compensation outcomes for Chief Financial Officers (CFOs) relative to Chief Executive Officers (CEOs). This analysis summarizes 2021 compensation actions among 130 companies with median revenue of $14 billion. Additional information on criteria used to develop the sample is included in the Appendix.
Study Highlights
Base Salary
More CFOs received increases in 2021 compared to 2020, with the median increase generally in line with 2020
- Approximately 7% more CFOs received base salary increases this past year. Overall, 62% of companies made salary increases for CFOs in 2021 and 42% made increases for CEOs
- Among executives who received salary increases, the median increase was 4.0% for both CEOs and CFOs. This increase was generally in line with the prior year’s increases (4.1% and 4.3% for CEOs and CFOs, respectively)
- Among the total sample, the median increase for CFOs was 2.5%, similar to last year’s 2.7% increase. Since 58% of CEOs did not receive an increase, the median increase for CEOs is 0%.
Bonuses
Strong 2021 financial performance, compared to performance challenges in 2020, supported higher bonuses in 2021
- Among our sample, approximately 75% of CFOs had higher bonus payouts in 2021. Median change in actual bonus payouts increased significantly – up 34% for both CEOs and CFOs
- The bonus payouts were mostly aligned with company performance during 2021. Companies whose operating income fell in 2021 paid bonuses approximately 12% lower than 2020 for CFOs (17% lower for CEOs). Companies who improved operating income paid bonuses approximately 43% higher for CFOs (36% for CEOs).
- Median target bonus opportunities remained unchanged for both CEOs (150% of salary) and CFOs (100% of salary), with the median CEO target bonus level unchanged for the last 8 years
Long-Term Incentive (LTI)
LTI awards were also up in 2021, reflective of stronger company and stock price performance
- LTI awards increased 12% for CEOs and 11% for CFOs, up from CEO and CFO increases last year (5.3% and 8.7%, respectively)
Total Compensation
2021 saw the largest year over year increases at median in the last 10 years; the last time we saw increases in the 15% – 20% range was after the financial crisis in 2008/2009
- Median 2021 increases in actual total direct compensation (i.e., cash plus equity) for CEOs and CFOs were 18% and 17%, respectively, substantially higher compared to 2020 (3% and 4%, respectively) driven by large increases in variable incentives (annual incentive payouts and long-term incentive awards)
- As in prior years, CFO total compensation continues to approximate one-third of CEO total pay
Pay Mix
The use of stock options slightly decreased in 2021 over 2020 as companies continue to emphasize performance-and time-based stock
- The emphasis on variable over fixed pay, and performance-based equity over time-based equity continues
- Use of stock options shifted down slightly (3-4%) compared to last year, and prevalence of performance- and time-based stock is consistent with 2020
- As we predicted last year, the slightly greater emphasis on time-based equity continued from 2020 into 2021
Study Results
Salaries
In 2021, prevalence of salary increases stayed consistent for CEOs (42% received increases in 2021 compared to 44% in 2020) and rose for CFOs (62% received increases in 2021 compared to 55% in 2020). At many companies, salary increases planned for 2020 may have been delayed to 2021 due to the COVID-19 pandemic. As indicated in the charts below, median 2021 salary increases were 2.5% for CFOs (or 4% for those receiving an increase) and 0% for CEOs (or 4% for those receiving an increase).
2021 Salary Increases

Changes in Actual Pay Levels
The actual total cash compensation for 2021 increased among our sample, driven by significant increases in bonus payouts. On a total compensation basis (including long-term incentive awards), the median rate of increase continued to trend much higher for both CEOs and CFOs (18% for CEOs and 17% for CFOs).
|
Median Percentage Change in Pay Components |
||||||
|
|
2018 – 2019 |
2019 – 2020 |
2020 – 2021 |
|||
|
Pay Components |
CEO |
CFO |
CEO |
CFO |
CEO |
CFO |
|
Salary |
2.5% |
3.0% |
0.0% |
2.7% |
0.0% |
2.5% |
|
Actual Bonus |
-2.2% |
-3.2% |
0.0% |
0.0% |
33.5% |
34.1% |
|
Long-Term Incentives |
6.1% |
8.3% |
5.3% |
8.7% |
11.8% |
11.0% |
|
Actual Total Direct Compensation |
4.4% |
3.6% |
3.3% |
4.1% |
17.6% |
16.7% |
As indicated above, though salary increases are consistent over year, there was a significant increase in bonus payouts and long-term incentive award values in 2021 compared to prior years.
Bonus payouts were generally aligned with performance outcomes for most companies. For companies with lower operating income in 2021, bonus payouts were down 12% at median for CFOs and 17% for CEOs, compared to +43% for CFOs and +36% for CEOs at companies with operating income growth.
Median Total Compensation Increase by Industry1

Median total compensation increases varied by industry. In 2021, industrials, consumer discretionary, IT and financials sectors had the biggest increases. Consistent with the overall study, these increases are higher than in prior years given stronger performance and higher payouts in 2021.
Target Pay Mix
The pay program structure for CEOs and CFOs over the last 10 years has remained largely unchanged. CEOs continue to receive less in the form of salary and more in variable pay opportunities, especially LTI, than CFOs.

Target Bonuses
Median target bonus opportunities as a percentage of salary remained consistent at the median and 25th percentiles, and fell at the 75th percentile. We expect target bonus will continue to remain at similar levels.

Long-Term Incentive (LTI) Vehicle Prevalence and Mix
The majority of companies (approximately 60%) deliver LTI using two different vehicles. Approximately 30% of companies in the sample use stock options, time-based stock awards, and performance plan awards.
The portion of LTI awards granted in performance plans decreased slightly in 2020 at the expense of higher time-based awards but bounced back in 2021. Stock option usage decreased in 2021. The minor increase in time-based awards was expected in 2020 due to the COVID-19 pandemic, and performance shares rebounded in 2021 when goal setting became more manageable.

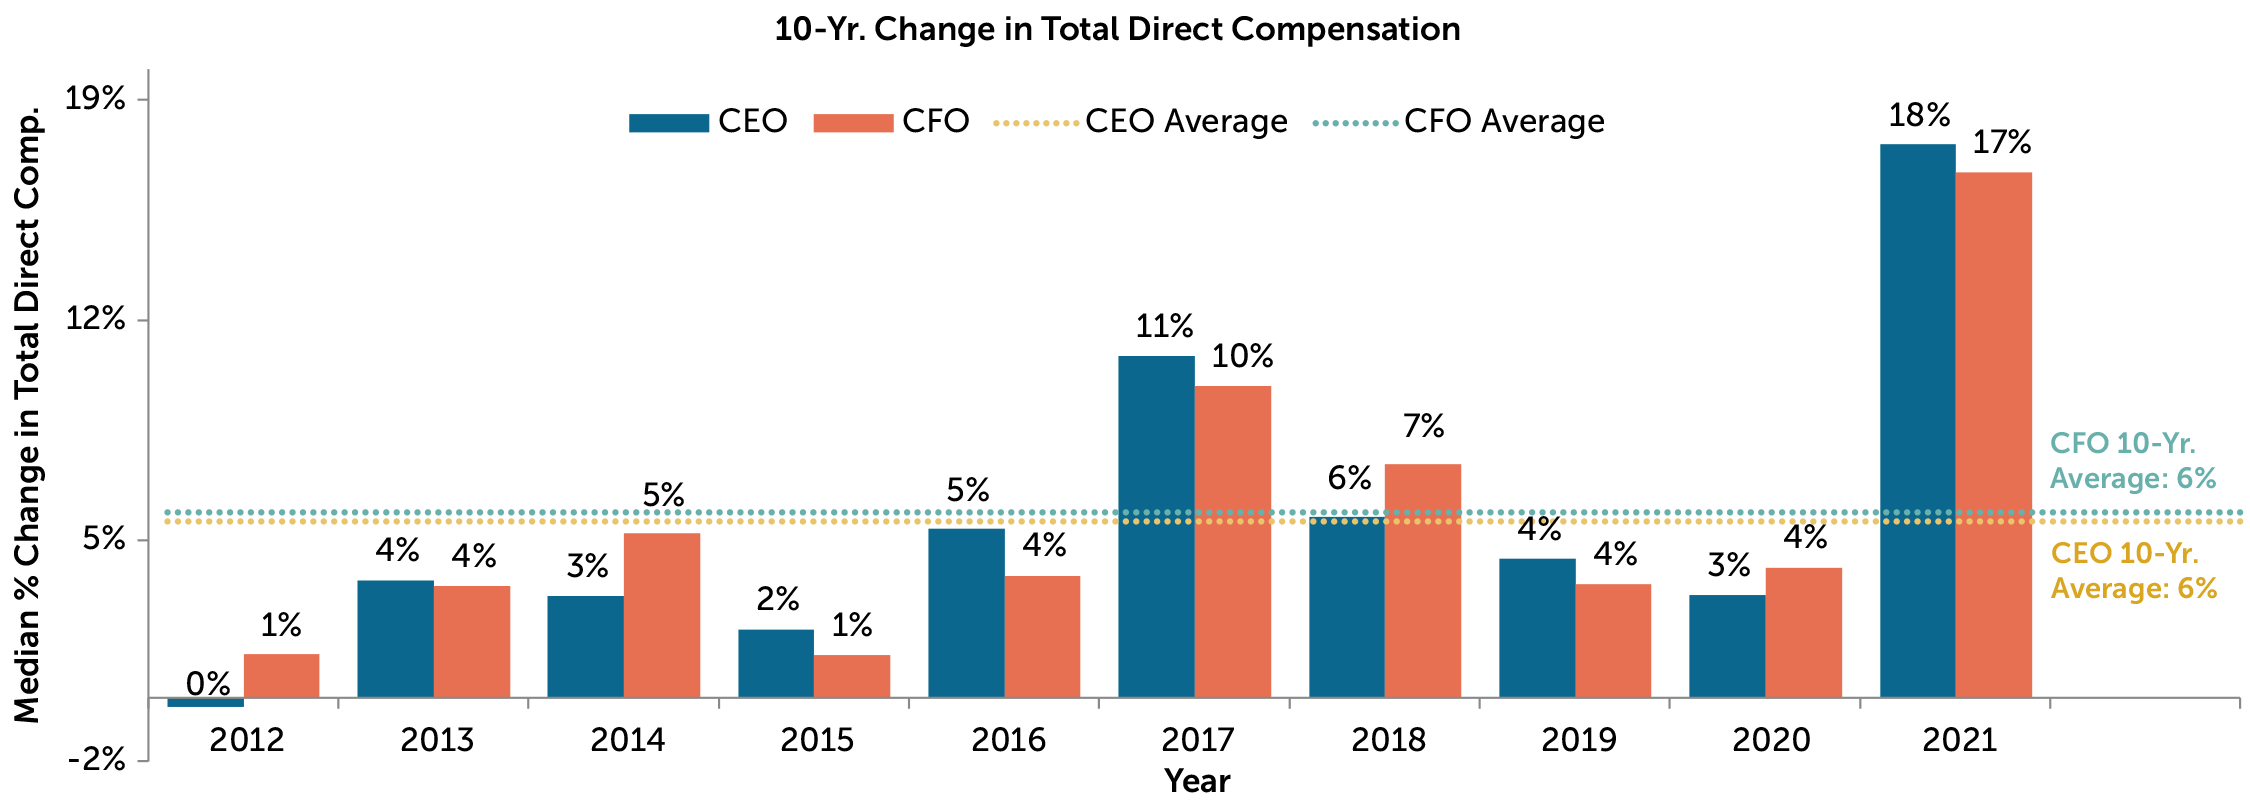
10-Year Changes in Total Direct Compensation
For its 10th year producing its annual CFO report, CAP reviewed historical changes in compensation from 2012 through 2021. CFO pay has generally tracked with CEO pay, though CEO pay has had higher highs and lower lows, as is expected for the top role. There is only one year – 2012 – that CEO pay fell compared to the prior year, but increases at median were less than 5% for most of the last 10 years for both CEOs and CFOs. 2021 saw by far the largest increases in total compensation, reflective of strong 2021 performance and compounded by below-average increases in 2020.
Conclusion
Financial performance improved dramatically in 2021 compared to the prior year. Revenue grew 18% at median and operating income increased 33%. Such exceptional financial performance explains the drastic incentive increases and indicates an overall alignment of pay outcomes and company financial performance.
Since many companies made equity grants early in 2021, prior to the impact of economic contraction into 2022, we do not expect to see increases of this magnitude next year.
APPENDIX
Sample Screening Methodology
Based on the screening criteria below, we arrived at a sample of 130 public companies with median 2021 revenue of $14B.
|
Revenue |
At least $5 billion in revenue for fiscal year 2021 |
|
Fiscal year-end |
Fiscal year-end between 9/1/2021 and 1/1/2022 |
|
Proxy Statement Filing Date |
Proxy statement filed before 3/31/2022 |
|
Tenure |
No change in CEO and CFO incumbents in the past three years |
|
Industry |
All industries have been considered for this analysis |
1 Excludes industries which had a sample less than five companies. Total compensation equals the sum of base salary, actual bonuses, and LTI awards granted in 2021.