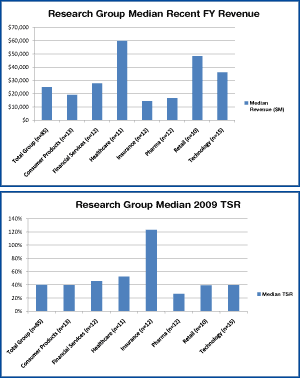
The component companies are large industry leaders. The total sample had median revenue of $25B, market cap of $37B and Total Shareholder Return (TSR) of 40% during 2009. The charts below include summary statistics by industry group. Practices at these leading companies are scrutinized closely by shareholders and the shareholder advisory groups. The responses of these companies to the financial strains in the economy during 2009 gives valuable insight into current practice and changes we expect to see in 2010.
What We Found
Highlights of our research results for the entire sample are below. Future CAP-Flashes will focus on particular industry groups and important topical areas, such as annual and long-term incentive design trends.
Compensation Strategy Changes
Outside of Financial Services, few companies reported changes to compensation strategy—i.e., the targeted pay positioning for executives and the targeted pay mix. Most stayed the course despite the challenging economic conditions in 2009.
Within the Financial Services group, most companies reported changes to compensation strategy, responding to their experience under TARP. Changes within the financial services industry include different pay mixes—examples include:
- Increased emphasis on fixed compensation by reducing incentive compensation and increasing base salary
- Increased emphasis on at risk, incentive compensation
- Majority of compensation delivered in restricted stock, deferred for 5 years
- Reduced portion of bonuses paid in cash and increased the portion of bonuses paid with deferred long-term awards subject to clawback
We expect Financial Services companies to continue to re- evaluate their compensation strategies as they exit TARP and emerge from the financial crisis and enter a more steady state.
Peer Groups Used For Benchmarking
Most companies did not make significant changes to their peer groups used for compensation benchmarking. Of those that did make changes, the majority of changes reported were primarily due to M&A activity in the Consumer Products, Insurance and Pharmaceutical industries. Others tweaked their selection criteria to focus more on companies in their industry and within a reasonable size range.
Base Salary Actions
Senior executive base salary actions continued to be restrained by the poor economy in 2009. Slightly more than half the sample did not increase or reduced salaries in 2009. Industry groups where salary freezes and reductions were widespread included Consumer Products, Health Care, Retail and Technology. Industries where salary increases were more common included Insurance and Pharmaceuticals. Merit increases were generally in the range of 2 – 3% when they were awarded.
| Type of Salary Change Reported in 2010 CD&A | No. of Cos. | % of Cos. (n = 85) |
| No Increase / Salary Freeze – All NEOs | 32 | 38% |
| No Increase / Salary Freeze – CEO Only | 6 | 7% |
| No Increase / Salary Freeze – Select NEOs | 1 | 1% |
| Salary Reduction – All NEOs | 4 | 5% |
| Salary Reduction – CEO Only | 1 | 1% |
| Salary Increase – All NEOs | 17 | 20% |
| Salary Increase – Select NEOs | 14 | 16% |
| Salary Increase – CEO Only | 1 | 1% |
| Salary Increase – TARP Related | 6 | 7% |
| Not Specified | 11 | 13% |
Note: Percentages do not add up to 100% due to multiple responses.
Annual Incentive Plan Design
Overall, 34 companies (40% of the full sample) disclosed making a change to their AIP design in 2009 or for 2010. While there was not a universal trend in the type of design changes being made, most companies are dealing with challenges in the goal setting process and maintaining meaningful performance linkages, linking rewards to the company’s ability to pay, and appropriately considering the impact of overall market conditions. In a nutshell, companies are trying to maintain a precise pay and performance calibration while also allowing for appropriate recognition of significant executive accomplishments.
The breakdown of reported AIP changes is as follows:
| Type of Change Reported in 2010 CD&A | No. of Cos. | % of Cos. Reporting Changes (n = 34) |
| Change in performance metrics used to fund awards | 15 | 44% |
| Increased target award opportunities | 9 | 26% |
| Reduced maximum award payout leverage | 4 | 12% |
| Added discretionary award component | 3 | 9% |
| Use of performance scorecard | 3 | 9% |
| New annual incentive plan (overhaul) | 2 | 6% |
| Other changes | 3 | 9% |
Note: Percentages do not add up to 100% due to multiple responses.
Change in Performance Metrics
Of the companies that changed their performance metrics and/or the mix of those metrics, a majority created a stronger linkage to corporate performance results and strategic priorities to support business changes forced by economic conditions. For example,
McKesson: For FY 2010, bonus goals need to significantly exceed the strategic plan to earn a target payout
Computer Sciences: Reduced the number of performance criteria to focus on key financial goals consistent with the company’s business strategy
T. J. Maxx – Eliminated divisional performance measures and focused on total company income
Sara Lee: Eliminated individual objectives and reallocated to corporate adjusted operating income goal
Merck: For 2010 incentive pool will be determined solely on company performance (as reflected by company scorecard)
There was no distinct trend in the changes made to the financial metrics used, though many changes included more emphasis on earnings, and to a lesser degree, revenue growth. Companies in the Insurance, Pharmaceutical and Retail industries made the most changes to metrics.
Discretion and Broad Performance Assessments
Some companies are increasing the role of discretion or broader retrospective performance assessment, to help ensure that significant market factors are considered at year end. For example, Genworth’s compensation committee uses discretionary judgment of performance against strategic objectives, including key financial criteria, to determine payouts. Microsoft’s compensation committee uses business judgment to help determine awards, and considers executive performance across a range of financial, operational, and strategic measures.
Another approach used by some companies includes use of a scorecard, which typically provides parameters for financial, operational, strategic, customer, and/or individual performance measurement. BNY-Mellon adopted such an approach to determine annual bonuses; and for 2010 Merck disclosed new incentive pool funding based on a company scorecard (solely company performance).
Changing Long-Term Incentive Practices
Most companies made changes to long-term incentive programs that either took effect in 2009 or will become effective in 2010—70% (60 out of 85) of companies reported changes. The most commonly reported changes involved changes to the mix of long-term incentive award vehicles granted and changes to the metrics used for long-term incentives. Here is a breakdown of what we found:
| Type of Change Reported in 2010 CD&A | No. of Cos. | % of Cos. Reporting Changes (n = 60) |
| Different mix of award vehicles | 33 | 55% |
| Different long-term performance metrics | 23 | 38% |
| Change in size of long-term award guidelines | 12 | 20% |
| Limits on dividend equivalents | 7 | 12% |
| Change in leverage in performance scales | 6 | 10% |
| Other changes | 9 | 15% |
Note: Percentages do not add up to 100% due to multiple responses.
Long-Term Award Mix
Among the companies that changed the mix of long-term award vehicles, two trends emerged. More than 50% of companies reporting a change in long-term award mix increased the emphasis on performance-based awards. Increased use of time-based awards – particularly among companies that had difficulty setting long-term financial goals during the recent period of economic uncertainty—was also common, but much less so. Finally, a few companies used options to a greater extent citing the difficulty in setting goals and attractive stock prices.
| Changes In Long-Term Incentive Award Mix | No. of Cos. | % of Cos. Reporting Changes (n = 33) |
| Greater emphasis on performance-based awards | 18 | 55% |
| Greater emphasis on time-based restricted stock/unit awards | 8 | 24% |
| Greater emphasis on options | 3 | 9% |
| Other | 4 | 12% |
Size of Long-Term Award Guidelines
Relatively few companies – only 14% of the total sample of 85 companies and 20% of the companies reporting changes to long-term programs—reported changing the size of long-term award target guidelines in 2009. Of the companies reporting a change, 67% decreased award guidelines and 25% increased award guidelines. One company reported migrating from fixed share guidelines to value-based guidelines, but did not indicate whether the change represented an increase or a decrease in value.
Long-Term Performance Metric Changes
Changes in long-term performance metrics were widespread. 25% of the total sample reported changing long-term incentives by adding new metrics; an additional 4% reduced the number of metrics used. Both relative and absolute TSR were selected as metrics by a number of companies. Return on equity/capital, revenue growth and cash flow were also popular choices.
| New Performance Metric | No. of Cos. | % of Cos. (n = 21) |
| Relative TSR | 5 | 24% |
| Absolute TSR of Stock Price Growth | 3 | 14% |
| Return on Equity or Capital | 4 | 19% |
| Revenue Growth | 3 | 14% |
| Cash Flow | 3 | 14% |
| Other Financial Metrics | 7 | 33% |
Note: Percentages do not add up to 100% due to multiple responses
Treatment of Dividend Equivalents and Other Plan Changes
Changes in the treatment of dividend equivalents was the most common plan design change reported. Seven companies moved to limit the payment of dividend equivalents until shares were earned or vested. Other design changes were more subtle, such as changes to the length of performance periods or the amount of leverage in performance scales.
Conclusions
Absent regulatory constraints, we did not see wholesale changes in 2009. Companies tended to stay the course in 2009 as the economic cycle bottomed out and the first signs of a recovery began to appear, but several clear trends did emerge. These include continued restraint on base salary increases, refinements to annual incentive and long-term incentive plan metrics and greater use of performance based long term incentives. These are all shareholder friendly developments that should improve the alignment between executive compensation and shareholders. We expect companies to continue to re-examine their programs as the economy improves and shareholders continue to demand performance and compensation program alignment.
***
Please contact us at (212) 921-9350 if you have any questions about the issues discussed above or would like to discuss your own executive compensation issues. You can access our website at www.capartners.com for more information on executive compensation.
Based on the dialogue we have seen among compensation committees, we believe the 2010 proxy season will demonstrate that a new level of responsibility has taken hold. Management and committees are struggling to ensure they are doing the right thing when it comes to compensation and that pay is closely aligned with performance. Additionally, some of the incentive program designs and governance practices imposed on financial services companies operating under TARP have had an impact on other industries.
Some of the early trends we are seeing in 2010 are detailed below.
Base Salaries
In 2009, roughly one-third of companies did not give salary increases. Many companies even cut salaries for executives, typically by 5-10%. With the economy showing early signs of a recovery, close to 90% of companies are planning for salary increases in 2010. Merit pools are expected to be lower than pre-recession levels, typically ranging from 2-3%. While many companies are providing salary increases, they will use these smaller pools more strategically, by targeting top performers and highest potential executives, and withholding increases to others.
RiskMetrics Group Problematic Pay Practices
While not a complete list, RMG views the following as problematic pay practices:
- Multi-year guarantees for salary increases, non-performance based bonuses, and equity compensation;
- Including additional years of unworked service that results in significant additional benefits, without sufficient justification, or including long-term equity awards in the pension calculation;
- Perquisites for former and/or retired executives, and extraordinary relocation benefits (including home buyouts) for current executives;
- Change-in-control payments exceeding 3 times base salary and target bonus; change-in-control payments without job loss or substantial diminution of duties (“single triggers”); new or materially amended agreements that provide for ‘modified single triggers’ (under which an executive may voluntarily leave for any reason and still receive the change-in-control severance package); new or materially amended agreements that provide for an excise tax gross-up (including “modified gross-ups);
- Tax reimbursements related to executive perquisites or other payments such as personal use of corporate aircraft, executive life insurance, bonus, etc;
- Dividends or dividend equivalents paid on unvested performance shares or units;
- Executive using company stock in hedging activities, such as “cashless” collars, forward sales, equity swaps or other similar arrangements; or
- Repricing or replacing of underwater stock options/stock appreciation rights without prior shareholder approval (including cash buyouts and voluntary surrender/subsequent regrant of underwater options)
In the financial services industry, given the impact of TARP and other regulatory initiatives, compensation is being re-mixed. Many financial service firms had increases to rebalance the mix between fixed and variable compensation. This helps avoid any perception that leveraged compensation packages encourage excessive risk-taking. In addition an annual risk assessment is becoming integral to the committee’s process across industries (this topic will be covered in the upcoming CAPflash on Risk Assessment).
Annual Incentives
Many companies’ experiences during two recessions within the last decade have highlighted the challenges with setting targets for incentive plan purposes. Beginning in 2009, many companies have started to incorporate a greater level of discretion in their annual incentive plans.
Companies found that strictly formulaic incentive plans sometimes failed to capture the true quality of the financial performance delivered. Additionally, Committees increasingly want the ability to improve the alignment between pay and performance. Providing for a level of discretion over incentive payouts allows Committees to recognize non-financial factors, individual performance and the challenges management faced in delivering the financial results on a retrospective basis.
For 2009 payouts, we expect to see an increased use of discretion by compensation committees, with more in-depth analysis of the factors influencing payout decisions. This may include a review of multiple financial metrics, analysis of performance relative to peers, strategic and operational results.
While results will vary by industry, we expect 2009 annual incentives payouts to exceed 2008 levels, when many companies paid zero or below target awards.
Long-term Incentives
In 2009, companies struggled to reconcile collapsing share prices with the need to recognize and reward their top performers and rising stars. Many companies did not grant equity as deeply or as broadly as they had in the past. In many cases, we saw a reduction in long-term incentive awards ranging from 10% – 30%. This decrease was partly due to efforts to manage annual share usage in a year with significantly lower stock prices In 2010, we are expecting grant values to level off or increase slightly as stock prices recover. We also expect to see a continued focus on performance-based long-term incentive plans and a decline in the use of or emphasis on stock options.
In 2010, individual differentiation will continue to be a key theme in long-term incentives as companies continue to manage their share usage and overall expense. The most dramatic examples occur deeper in the organization. At middle management levels, 100% may be eligible for awards, but typically 50%, and in some companies as few as 25%, actually receive awards.
Time-vested restricted stock and “salary stock” has become commonplace for companies operating under TARP. Outside of financial services, however, compensation committees have sharpened their focus on performance, employing a variety of performance-based awards. Shareholders and the various shareholder advocacy groups support these approaches, encouraging the trend.
Pay Mix
In 2009, many companies reviewed the mix of pay they offered. Companies want to ensure there is an appropriate balance between short and long-term compensation as well as fixed vs. variable pay. Within financial services, many companies re-balanced the amounts executives received in salary, annual cash incentives and equity. This rebalancing is intended to align the time horizon of compensation with the risk profile of the company and will vary by industry.
Clawbacks
Clawback provisions for annual and long-term incentives are becoming more common across industries. This is another example of a practice required by TARP spilling over into general industry. Clawbacks come in a variety of flavors. Some require employees to forfeit or reimburse compensation for a period of time if an executive engages in conduct that results in a restatement of financial results. Other clawbacks are fashioned more broadly, allowing companies to recoup compensation if results deteriorate over time for any reason. Providing for clawbacks helps further align pay and performance and mitigates the potential risks of executives making short-term decisions that have a detrimental impact on the company over time. Some companies, especially in financial services, are increasing the use of deferred compensation to make it easier to recoup compensation later, if the need arises.
Stock Holding Requirements
The requirement to hold stock for a period of time following vesting or exercise of options has become increasingly prevalent over the last few years, although still not a majority practice. Companies with such requirements generally ask executives to hold 50% to 100% of net shares for a period of one to three years, or even to retirement or beyond for a minority of companies. Stock holding requirements continue to be a focus for companies as they are viewed as another practice to mitigate risk in compensation programs. Stock ownership guidelines, most often expressed as a multiple of base salary, are common for most companies. Some companies are re-evaluating their stock ownership guidelines and denominating the guideline in shares as opposed to a multiple of salary as a response to the volatility in the market.
Change in Control Protections
Pressure from shareholder advisory groups and activist investors are leading to reductions in change in control protections. As companies review their programs, many are committing to eliminate gross-ups on 280(g) excise taxes going forward. Some of these companies are grandfathering this provision for existing participants, while select companies are eliminating them completely for all participants. A few companies are asking executives with contractual rights to gross-ups to waive them. These companies recognize that gross-ups are a red flag in the current environment and acknowledge that the potential cost to the company, or acquiring company, far exceeds the benefit to the executive. As companies eliminate the gross-up feature, some provide the executive with the choice to receive the full amount of their change in control benefits and pay the excise tax themselves or reduce the benefits to a level just below the level which would trigger the excise tax payment.
In addition to eliminating gross-ups, more companies are moving to double-trigger vesting on equity following a change in control (i.e., executive must be terminated without cause or terminate for good reason following the change in control).
Summary
The magnitude of the economic crisis increased the level of scrutiny of executive compensation practices over the past two years to unprecedented levels. The actions we have seen companies take in 2009 have been greatly impacted by the environment. As companies release their proxy statements in the next few months, we will get a better sense of the final decisions, but we believe that both senior leaders within companies and compensation committees are supporting a new level of responsibility and accountability.
Please contact us at (212) 921-9350 if you have any questions about the issues discussed above or would like to discuss your own executive compensation issues. You can access our website at www.capartners.com for more information on executive compensation.
We view the report as required reading for outside directors, senior management and HR professionals. The report amounts to a call for action for boards of directors and compensation Committees to re-examine their compensation programs to ensure that the link between pay and performance is strong and the programs reflect best practices and high governance standards.
The report recommends that executive compensation programs reflect the five guiding principles:
- Principle One – Paying for the right things and paying for performance
“Compensation programs should be designed to drive a company’s business strategy and objectives and create shareholder value, consistent with an acceptable risk profile and through legal and ethical means. To that end, a significant portion of pay should be incentive compensation, with payouts demonstrably tied to performance and paid only when performance can be reasonably assessed.” - Principle Two – The “right” total compensation
“Total compensation should be attractive to executives, affordable for the company, proportional to the executive’s contribution, and fair to shareholders and employees, while providing payouts that are clearly aligned with actual performance.” - Principle Three – Avoid controversial pay practices
“Companies should avoid controversial pay practices, unless special justification is present.” - Principle Four – Credible board oversight of executive compensation
“Compensation committees have a critical role is restoring trust in the executive compensation setting process and should demonstate credi ble oversight of executive compensation. To effectively fulfill this role, compensation committees should be independent, experienced, and knowledgeable about the company’s business.” - Principle Five – Transparent communications and increased dialogue with shareholders
“Compensation programs should be transparent, understandable and effectively communicated to shareholders. When questions arise, boards and shareholders should have meaningful dialogue about executive compensation.”
In addition to the guiding principles, the report contains concrete recommendations on how to implement effective executive compensation programs. Click on the link http://www.conference-board.org/pdf_free/ExecCompensation2009.pdf to access the full report of Conference Board?s Task Force on Executive Compensation.
Please contact us at (212) 921-9350 if you have any questions about the issues discussed above or would like to discuss your own executive compensation issues. You can access our website at www.capartners.com for more information on executive compensation.