The challenging stock market conditions of the last two years may have companies questioning their continued use of stock options. Our analysis of stock options granted in 2022 among S&P 500 companies finds that the majority of stock options (54% of all option grants) granted are underwater (i.e., the current stock price is below the option exercise price) and on average, the stock options are 23% underwater. That means that for the average executive holding stock options granted in 2022, the stock price would have to increase by more than 30% for the stock option to have any intrinsic value.
Recent Stock Option Struggles
CAP analyzed CEO equity grants among S&P 500 companies to understand the degree to which stock options were out-of-the-money, given the challenging stock price environment. It should be noted that many companies have moved away from granting stock options. In fact, among the S&P 500, only 43% of CEOs received stock options. This reflects a broad market shift where options have been replaced by performance share units and restricted stock units.
|
S&P 500 |
% |
|
Companies Granting Stock Options |
43% |
|
Stock Option Grants Currently Underwater |
54% |
|
Average % Change from Exercise Price |
-23% |
As of November 30, 2023, 54% of these awards are underwater which means they currently have no value. Among these underwater awards, the current share price is 23% below the exercise price, on average. While it is still early in the vesting schedule for these awards, share price depreciation at such levels may leave employees wondering if their options will have realizable value as it will take significant stock price appreciation to get back to break-even.
In looking more closely at the sample, we find that there is a broad range of how far out-of-the-money stock options are across companies. For example, 11% of the stock options are more than 50% out-of-the-money, meaning that the stock price would have to more than double for them to begin to have intrinsic value. A full third of the options granted are more than 30% underwater.
|
Percent Change From Exercise Price |
Underwater Grants |
% of Underwater |
|
0% to -10% |
29 |
25% |
|
-10% to -20% |
32 |
28% |
|
-20% to -30% |
16 |
14% |
|
-30% to -40% |
19 |
17% |
|
-40% to -50% |
5 |
4% |
|
-50%+ |
13 |
11% |
|
Total |
114 |
– |
When we look at the underwater stock options by industry, we find that there are differences in the percentage of underwater options and the degree to which they are underwater across industry sectors. For example, all five Communications Services companies had underwater options that were on average 33% underwater. Underwater options were much less of an issue in the Information Technology sector, where companies have recently been rallying and recovering from share price depression.
|
Industry Sector |
Annual Option Grants |
% of Grants Underwater |
Average % Underwater |
|
|
Underwater |
Total |
|||
|
Communication Services |
5 |
5 |
100% |
-33% |
|
Consumer Discretionary |
10 |
20 |
50% |
-25% |
|
Consumer Staples |
15 |
22 |
68% |
-22% |
|
Energy |
0 |
4 |
0% |
– |
|
Financials |
12 |
25 |
48% |
-22% |
|
Health Care |
33 |
46 |
72% |
-28% |
|
Industrials |
18 |
46 |
39% |
-24% |
|
Information Technology |
7 |
21 |
33% |
-23% |
|
Materials |
10 |
15 |
67% |
-18% |
|
Real Estate |
1 |
4 |
25% |
– |
|
Utilities |
3 |
5 |
60% |
-25% |
|
Total |
114 |
213 |
54% |
-23% |
Handling Underwater Stock Option Concerns
Underwater stock options can create retention issues throughout organizations. In times of economic uncertainty and poor stock market conditions, employees rightfully may worry that underwater stock options will never achieve the upside that was once promised. Executives may feel that their outstanding underwater stock option awards are worthless, which may leave them feeling demotivated to remain at the company for the long haul. Similarly, younger employees who are holding stock options that are deeply underwater may look for more attractive opportunities at high-growth potential organizations. Moving on to a new company may become more appealing, especially if the offer includes a sign-on award at a new employer which may represent a fresh start from an equity compensation perspective. In general, employees may not consider the long-term potential of their stock options and instead focus on the current lack of value.
To mitigate these potential retention concerns, employers need to provide clear messaging to employees about the long-term potential provided by stock options, and potentially consider redesigning their equity grant practices. Among the S&P 500 sample, the most common (84%) exercise term for stock option grants is 10 years. This decade-long time horizon should provide plenty of opportunity for the share price to recover, and potentially grow far beyond the exercise price. On the flip side, currently depressed share prices also mean that the next annual stock option awards will be granted at a lower exercise price and therefore should have more upside potential over the new term.
If employees have been put off by multiple cycles of underwater options, another alternative to consider is redesigning and rebalancing the equity compensation mix. Among the S&P 500 sample, stock options represent 19% of the average equity compensation package. Excluding CEOs who do not receive options, the average CEO receives 38% of equity compensation in stock option awards. Most S&P 500 companies use multiple equity vehicles and place more weight on full-value share awards in their long-term incentive plans, which is a market best practice and shields executive compensation packages from excessive macroeconomic risk. While stock options continue to make sense at growth-stage companies, the associated retention and recruitment risks in times of share price depression may cause mature companies to fall behind in the war for talent.
Conclusion
Periods of economic uncertainty raise many compensation issues as companies look to properly incentivize and retain key talent despite depressed stock prices. While stock options remain appropriate for incentivizing employees at growth-stage companies, mature organizations must strike the right balance of equity compensation to navigate the retention and recruitment risks during these periods. With extreme stock market volatility expected to continue in the coming years, companies may benefit from emphasizing equity compensation based on multi-year financial goals and relative stock price performance rather than boom-or-bust stock option grants. Whether or not an equity program redesign is under consideration, clear communication about the future potential of equity awards, including underwater options, remains vital.
2020 was a particularly robust year for initial public offerings (IPOs) and special purpose acquisition companies (SPACs). Many companies took advantage of favorable capital markets, and we saw much-anticipated IPOs such as Snowflake, DoorDash and Airbnb hit the public markets in 2020. Founders, employees, and investors unlocked significant value in these IPO events.
CAP’s review of technology company equity practices around IPO reveals several emerging compensation trends: a shift in equity award vehicles from stock options to restricted stock units (RSUs), increased use of double-trigger vesting for restricted stock, and large, company-friendly equity authorizations. Additionally, some companies implemented noteworthy founder compensation practices.
Pre-IPO Equity Grant Practices
CAP reviewed a sample of 20 high-profile, technology companies with IPOs in recent years to understand their equity practices leading up to the IPO.
List of companies:
| Airbnb | Fitbit | Palantir | Slack | Square |
| Asana | GoPro | Peloton | Snap | Uber |
| DoorDash | Grubhub | Snowflake | Unity Software | |
| Dropbox | Lyft | Roku | Sonos | Zoom Video |
Options are still predominant. For companies anticipating growth, options continue to be the favored equity award for a variety of reasons. For employees, there is no tax burden at vest, and the employee has control over the settlement of the award and associated taxation. If incentive stock options (“ISOs”) are used, the employee receives capital gains treatment upon disposition of shares, assuming the required holding period is met. Options are also favorable from the shareholder (often financial sponsors) perspective. Options align the interests of employees with their shareholders, as no award value is realized unless the company value appreciates. Typically, stock options are granted at-hire and allow employees to share in the value of the company as it grows and matures.
Increased use of RSUs with unique features. Some companies (such as Lyft, Uber, and Dropbox) shifted to granting more RSUs in the years leading up to IPO. In these cases, RSUs have double-trigger vesting, which requires both time-based service (typically four years) and event-based requirements (typically a qualifying capital event such as an IPO) be satisfied in order for the RSUs to vest.
Companies naturally shift from granting options to RSUs as they grow and mature. Reasons for this include changes in a company’s growth expectations post-IPO, the need to conserve shares, and a desire for differentiated equity grant programs as companies grow in size and complexity. However, as seen with recent IPOs, favoring RSUs could be attributed to the fact that award values are easier to understand and are somewhat protected, even if company valuations fluctuate between funding rounds. Companies also benefit, from an accounting perspective, with vesting being dependent on a qualifying capital event as no accounting charge is incurred until such event takes place.
Adopting double-trigger RSUs has potential downsides, though. These include mounting pressure to go public (as evidenced by media coverage of the long-delayed IPO of Airbnb), and a significant tax burden for employees whose equity vests upon IPO. Employees are exposed to the financial risk of being taxed on stock compensation that has since declined in value since IPO. Also, when employees leave the company before the IPO event, their unvested shares are forfeited. This may pose an issue for recruitment unless the IPO timeline is clear. For the company, event-based vesting triggers a major accounting expense, and the large number of shares being sold may temporarily impact the company’s share price.
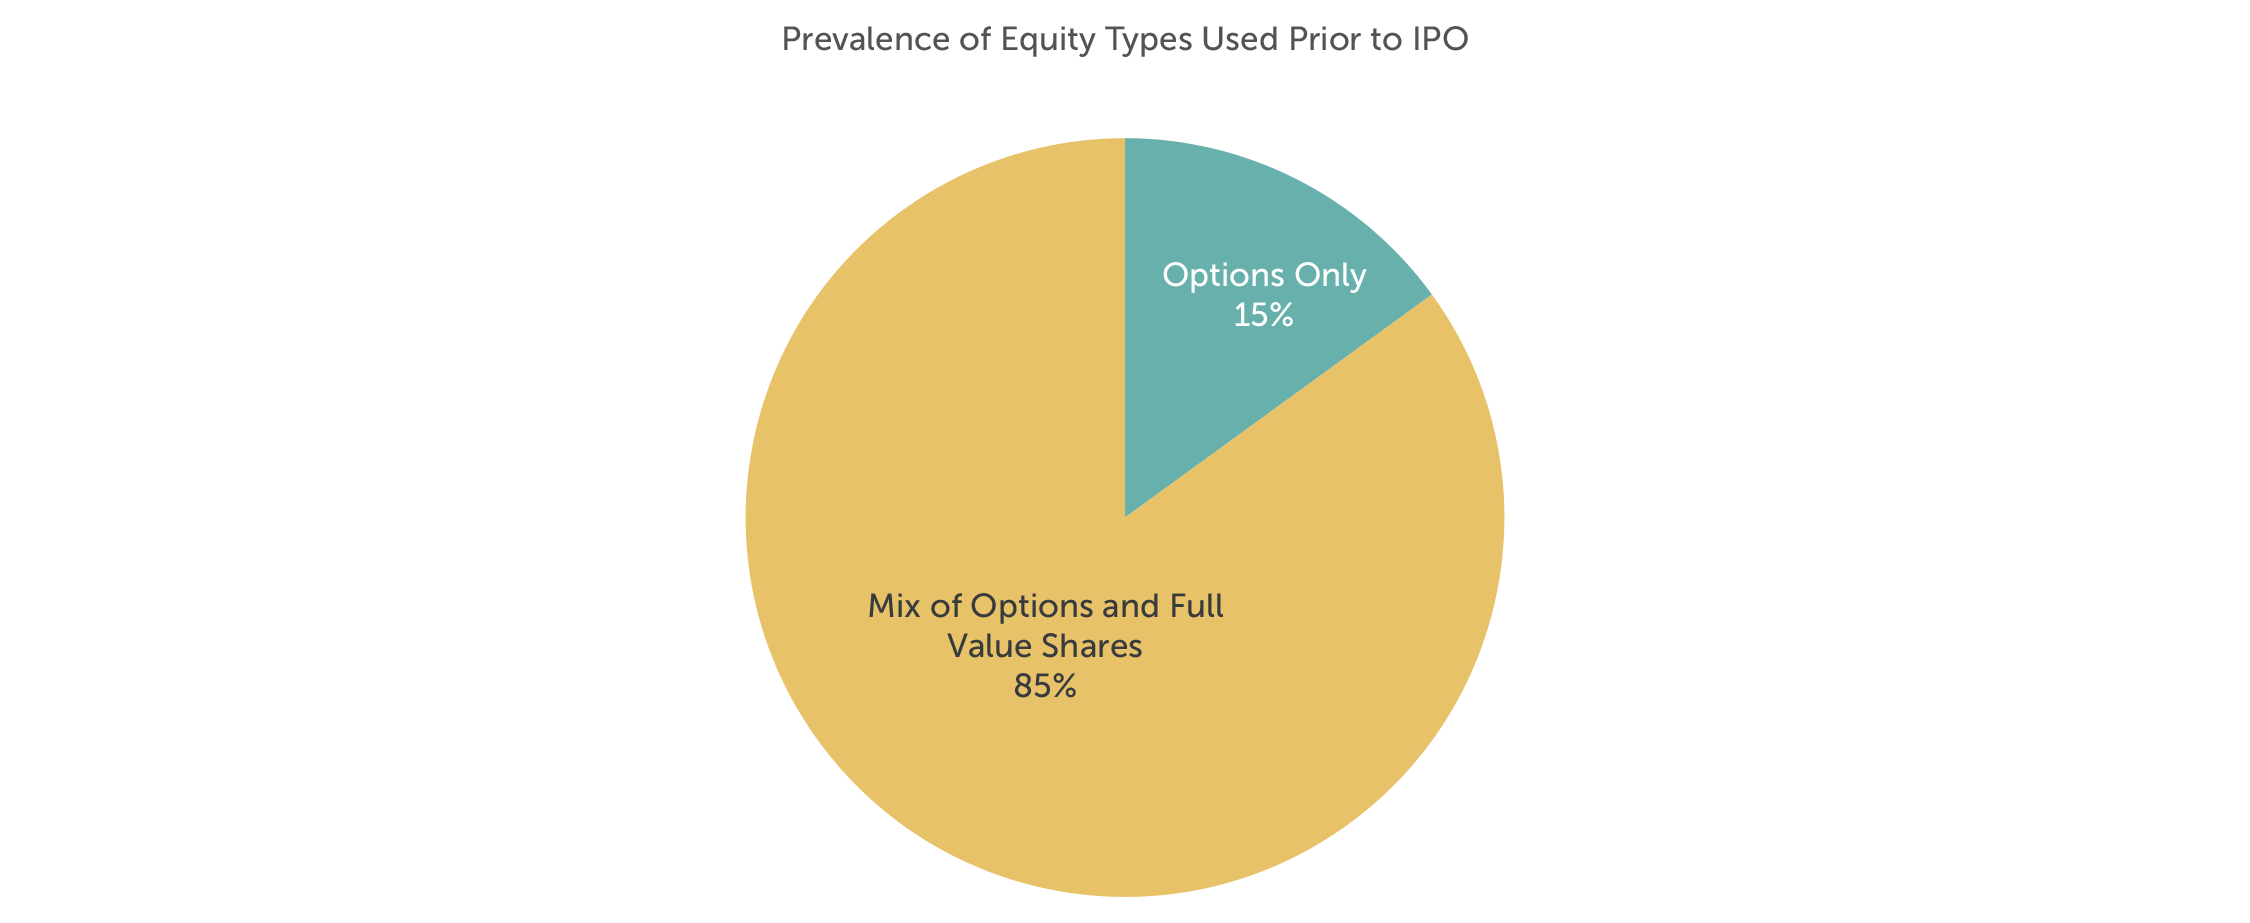
Note: No companies in the sample granted only full value shares prior to IPO.
Equity Authorization Pre- and At-IPO Practices
Before going public, companies often need to adopt multiple equity plans for incentive purposes. Not surprisingly, long time horizons and numerous funding rounds before IPO require companies to authorize additional equity share pools for compensation purposes. Private company investors are asked to approve incentives so that the company has enough “dry powder” to scale the executive team and grow its employee base. At median, equity overhang1 pre-IPO is 21.5% among the sample group.
In conjunction with the IPO, most companies (95% of companies in the sample), asked for an additional equity authorization. Median at-IPO overhang is 27.7% of common shares outstanding (CSO). In addition to the share request, companies often seek annual evergreen provisions (typically 5% of CSO per year) and liberal share recycling provisions.

Note: Pre-IPO and At-IPO equity overhang reflects the sample of 20 companies. Equity overhang for mature companies2 reflects sample (n=195) of S&P 1500 companies in the Information Technology sector, excluding companies that have gone public in the past three years.
Employee Stock Purchase Plans (ESPPs)
Many of the technology companies that went public implemented ESPPs in conjunction with their IPOs. ESPPs enable employees to purchase company stock, often at a discount, through payroll deductions. Most ESPPs are designed to be qualified plans under Internal Revenue Code Section 423, and from the standpoint of proxy advisory firms, such as ISS and Glass Lewis, are considered non-controversial. ESPPs are an appealing way for all employees to voluntarily acquire company shares after the IPO event. This is especially important as companies shift from granting equity to all employees to granting equity on a more selective basis (e.g., senior manager and up). An ESPP is an employee benefit that can be structured in ways (such as rollover provisions or extended offering periods) that make it an attractive recruiting and retention tool.
Founder Compensation
Every company has a different growth trajectory in its early years after formation. Founders typically must dilute personal ownership of the company in order to raise necessary capital. Companies in our study typically had multiple founders; however, not all founders contribute in the same way as the company evolves. Founders are often uniquely positioned and are key assets to their companies, which makes their retention crucial especially since finding a suitable replacement may be both difficult and expensive.
Founders who remain in executive roles after IPO have varied compensation packages depending on the specific circumstances. In some cases (Snap and Airbnb) founders reduced their base salaries to $1 post-IPO in exchange for significant equity grants in conjunction with the IPO. This is not typical as most founders maintain cash compensation (base salary and target bonuses) at market competitive levels.
With respect to equity compensation, some companies (including Airbnb and DoorDash) provided significant equity grants at or just prior to IPO. These grants often vest based on the achievement of performance criteria (e.g., stock price or market capitalization goals) and have long vesting periods that correspond with the magnitude of the award. Companies view these additional, often significant, equity grants to founders as necessary to incent continued service and focus, to maintain alignment with stockholder interests, and to mitigate the dilutive effects of public offerings on founder equity stakes.
Conclusion
Despite no “one-size-fits-all” approach to compensation, it is important to understand the various equity compensation tools available for companies preparing for an initial public offering. CAP’s review of recent technology IPOs highlights the latest trends in equity compensation needed to attract and retain skilled talent. Equally important is proactively and frequently communicating the value and mechanics of equity to participants for these awards to have maximum impact. Aligning pay philosophy with company culture and shareholder interests are important guiding principles to consider as companies design their equity incentive practices around IPO.
1 Overhang for IPO companies: Numerator = [Outstanding full value shares & options + shares available for grant + additional share requests] / Denominator = [Numerator + common shares outstanding as per the record date of the S-1 filing]
2 Overhang for Mature Companies: Numerator = [Outstanding full value shares & options + shares available for grant + additional share requests] / Denominator = [Diluted weighted average shares outstanding]
More than six months have passed since the COVID-19 pandemic began. In February, American businesses were hit hard by shutdowns, shifting demand, operational disruptions, and significant new challenges for employee health and safety. Many S&P Composite 1500 companies responded with changes to their compensation programs for executives and employees. Initial pay actions in March, April and May focused on conserving cash, mainly through salary cuts. Over the summer, companies adapted, and pay actions began to focus on annual and long-term incentive plans.
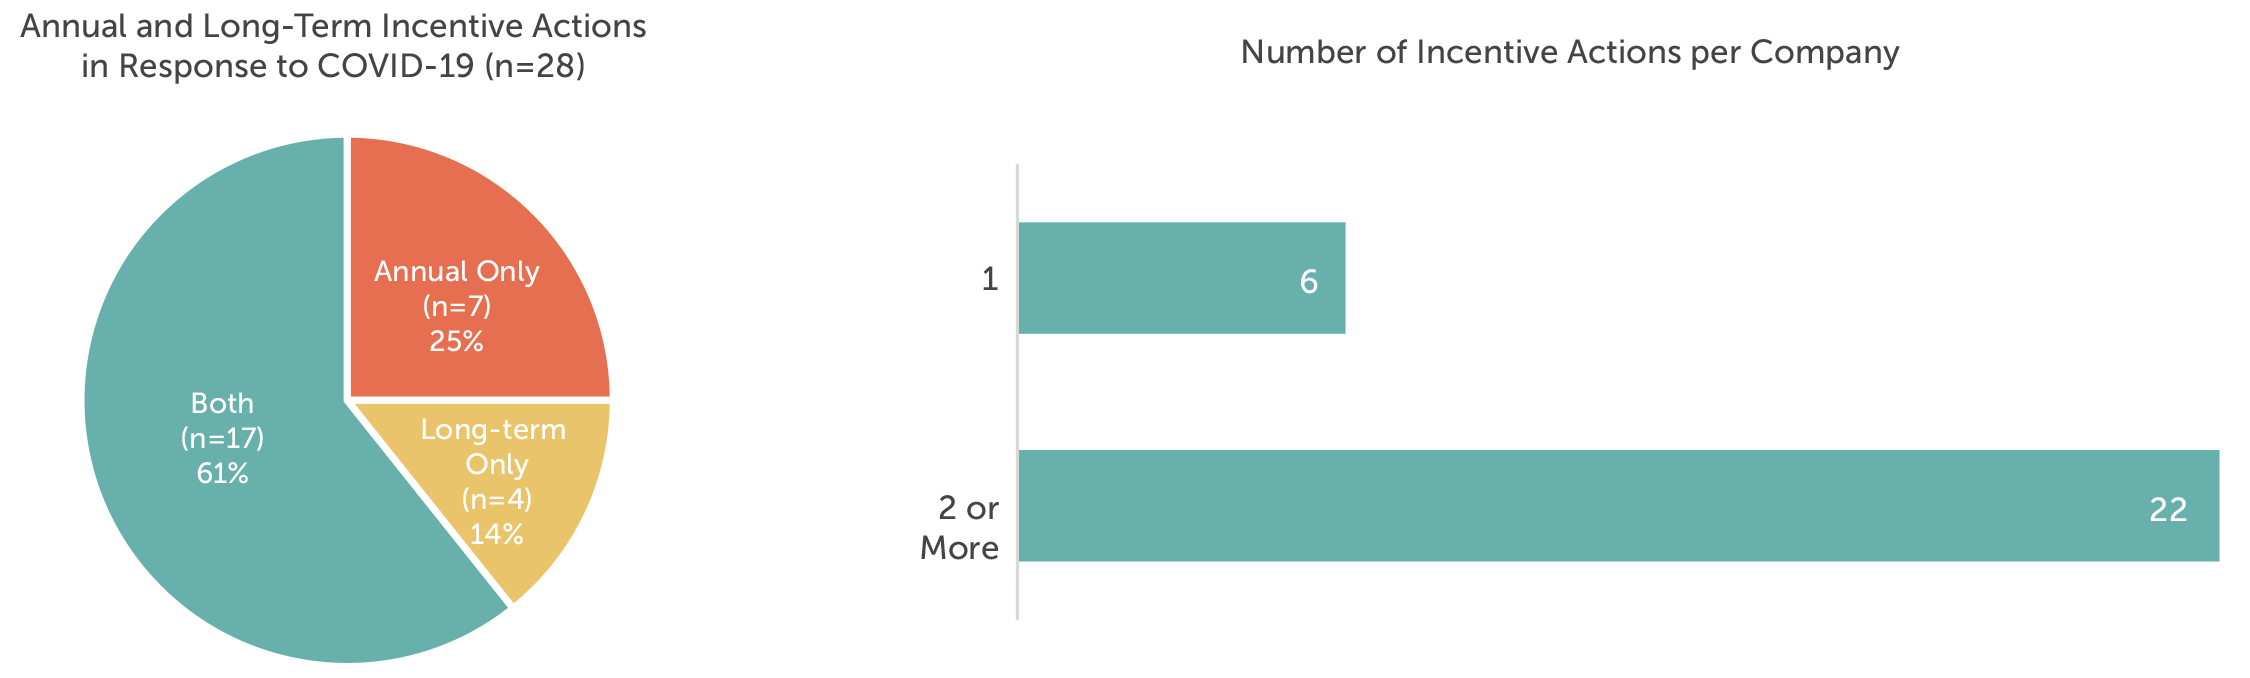
Public filings in September and October offered the first detailed look at how U.S. public companies adjusted their executive compensation plans in response to COVID-19. Public companies with fiscal year ends (FYEs) on or near June 30 recently filed their proxy statements, which included robust discussions of the impact of COVID-19 on 2020 executive compensation decisions and plans for 2021. Of the S&P Composite 1500 companies – which Compensation Advisory Partners (CAP) has been closely tracking – 65 companies with FYEs between May 30 and July 3 filed their annual proxy statements by October 7. Of the 65 companies, 28 – or 43 percent – announced changes to their outstanding and go-forward incentive plans because of COVID-19. Approximately 60 percent of the 28 companies had responded at the start of the pandemic with immediate human capital actions, including temporary reductions to executive base salaries, and adverse broad-based employee actions.
It is too early to say whether actions taken by the June FYE companies are indicative of trends we will see when most companies file their proxy statements in the spring of 2021. From an industry-sector standpoint, the June FYE companies show significant representation from Information Technology (28%), Industrials (15%), and Consumer Staples (15%). While not a completely representative sample, this group of companies still provides an interesting early look at executive compensation responses to COVID-19 beyond annual pay reductions.
The majority of the 28 companies that reported COVID-19-related pay actions adjusted both their annual and long-term incentive plans. About 85 percent of the companies made changes to their annual incentive plans, and 75 percent made changes to long-term incentives. Twenty-two of the companies took more than one incentive action.
Annual Incentives
Of the 28 companies, 24 made changes to their outstanding and/or go-forward annual incentive plans. The most common changes were modifying the performance period, exercising discretion to determine award amounts, revising the payout scale, delaying goal-setting and adding or changing performance metrics.

Prevalent annual incentive actions are discussed below.
Adjusted Performance Period
Several June FYE companies adjusted the performance period for an outstanding plan. For these companies, COVID-19 only impacted fourth-quarter results, so most of their 2020 fiscal years were business as usual. In go-forward plans, shorter performance periods are intended to focus executives and employees on immediate priorities, and to recognize that goal-setting will be difficult because of COVID-19.
|
Action |
# of Companies |
|
Outstanding Plan |
|
|
Shortened the performance period to exclude the pandemic. |
9 |
|
Go-Forward Plan |
|
|
Bifurcated annual performance periods. |
2 |
|
Set quarterly goals. |
2 |
Use of Discretion
Eight companies applied discretion to outstanding incentive awards. The disclosed rationale for the use of upward discretion was to recognize the extraordinary efforts of executives and employees who contributed to companies’ COVID-19 responses, and to recognize performance before COVID-19 hit.
|
Action |
# of Companies |
|
Outstanding Plan |
|
|
Applied discretion to increase annual incentive funding and awards. |
7 |
|
Used downward discretion to reflect the negative impact of COVID-19. |
1 |
Revised Payout Scale
Revisions to payout scales for outstanding awards were made primarily to prorate awards in conjunction with adjusted performance periods, as discussed in “Adjusted Performance Period.” Payout scales were revised in go-forward plans for a number of reasons: to widen the performance curve to reflect the difficulty with goal-setting, to reduce maximum payouts for cost containment, and to implement a payout floor and increase the award maximums to incentivize superior performance.
|
Action |
# of Companies |
|
Outstanding Plan |
|
|
Revised payout scales in conjunction with shortening performance periods to remove the impact of COVID-19. The payouts were prorated based on how much the performance periods were shortened. |
3 |
|
Go-Forward Plan |
|
|
Widened performance curves. |
1 |
|
Reduced maximum annual incentive award to be 150 percent of target, down from 200 percent of target. |
1 |
|
Added a payout floor, increased maximum payout, and adjusted corporate and business unit award multipliers. |
1 |
Delayed Goal-Setting
Six companies delayed goal-setting for go-forward plans. The rationale is to allow time for more information to predict financial performance.
|
Action |
# of Companies |
|
Go-Forward Plan |
|
|
Delayed goal-setting in conjunction with breaking performance periods into smaller units. |
3 |
|
Delayed goal-setting to have more accurate information for forecasting. |
3 |
Added/Changed Metrics
Several June FYE companies changed performance metrics for their annual incentive plans to move away from financial measures. The shift to operational measures illustrates that companies are opting to focus executives and employees on drivers of financial performance, which may provide clearer line of sight or may be easier to forecast in unpredictable times. Similarly, the shift to strategic and individual metrics may allow for more discretion in payout determination and recognizes the importance of non-financial goals at this time.
|
Action |
# of Companies |
|
Outstanding Plan |
|
|
Changed metrics for outstanding awards to focus on near-term priorities, and company health and well-being. |
1 |
|
Go-Forward Plan |
|
|
Adjusted annual performance metrics, including shifting to operational, strategic, and individual performance. |
4 |
Long-Term Incentives
Of the 28 companies, 21 made changes to their outstanding and/or go-forward long-term incentive plans. All but four of the companies that adjusted long-term incentives also adjusted annual incentive plans. The most common changes were modifying the performance period, revising the payout scale, changing the long-term incentive vehicle mix, changing metrics for performance awards, and delaying goal-setting.

Modified the Performance Period
As with annual incentive plans, modifying the performance period was the most prevalent long-term incentive plan change. CAP predicts goal-setting will remain as a key challenge for incentive plan design for 2021 and beyond. The COVID-19 pandemic hurt many companies and helped others (e.g., consumer staples), resulting in highly unusual results for 2020. To address future uncertainty during goal-setting, breaking performance periods into smaller periods may become more common until economic conditions stabilize.
|
Action |
# of Companies |
|
Outstanding Plan |
|
|
Modified the performance period for outstanding awards, including omitting the quarter negatively impacted by COVID-19. With that change, some companies also prorated the award amounts commensurately. |
7 |
|
Go-Forward Plan |
|
|
Divided the award period into shorter periods for purposes of goal-setting and award calculation. |
3 |
|
Shortened the three-year performance period to two years. |
1 |
|
Changed the goal-setting approach to include a cumulative goal. |
1 |
Revised the Payout Scale
Revisions to past payout opportunities and maximums were made to prorate awards in conjunction with shortened performance periods, or to cap the payout and conserve cash.
|
Action |
# of Companies |
|
Outstanding Plan |
|
|
Decreased the payout scale for outstanding awards in conjunction with omitting quarters negatively impacted by COVID-19. Prorated the awards commensurately (e.g., if performance were measured over 11 quarters instead of 12, the award would be prorated by 11/12). |
4 |
|
Revised award payouts to the maximum based on performance in quarters not negatively impacted by COVID-19. |
1 |
|
Capped the maximum payout at target. |
1 |
|
Go-Forward Plan |
|
|
Awarded grants at target regardless of performance. |
1 |
|
Increased maximum payout. |
1 |
Changed Long-Term Incentive Vehicles
Ten companies adjusted the long-term incentive mix for upcoming awards. The most common change was to add time-vested vehicles or to increase the percentage of time-vested vehicles overall to increase retention and recognize the difficulties of goal-setting during the pandemic.
|
Action |
# of Companies |
|
Go-Forward Plan |
|
|
Added time-vesting vehicles or increased the percentage of time-vested vehicles in the overall mix. |
6 |
|
Added stock options to the 2021 fiscal year grant. |
2 |
|
Eliminated stock options. |
2 |
|
Not granting equity. |
2 |
Note: Two companies took multiple actions.
Changed Performance Plan Metrics
Given the impact of COVID-19 on U.S. companies, changing performance measures to reflect new business realities has not been a surprising development. Five companies with June FYEs adjusted their long-term performance measures. CAP expects to see more changes in performance measures in go-forward performance plans as companies file proxy statements.
|
Action |
# of Companies |
|
Go-Forward Plan |
|
|
Adopted relative performance measures, which mitigate the risk of goals being missed because of market events beyond management’s control. |
2 |
|
Added strategic metrics to focus management on COVID-related priorities. |
2 |
|
Eliminated a more complicated return measure to focus on revenue and profitability. |
1 |
Delayed Goal-Setting
Five companies delayed goal-setting for future awards. Delaying annual grants or choosing to set targets in the second quarter could provide companies with flexibility to set more accurate and realistic performance goals.
|
Action |
# of Companies |
|
Go-Forward Plan |
|
|
Made annual grants but delaying goal-setting under the grants until there is more predictability surrounding COVID-19 and its impact. |
3 |
|
Delayed making annual grants. |
2 |
Special Awards
Four companies with June FYEs provided special awards to executives. FedEx and Nike made special awards to replace annual and long-term incentive awards that were not paid because of COVID-19. Tapestry and Herman Miller provided special grants to incentivize executive performance. CAP expects to see more special awards in the future.
|
Company |
Revenue ($M) |
Position |
Grant Date |
Award Value ($000s) |
Award Type* |
Vesting |
|
FedEx Corporation |
$71,490 |
CEO |
06/15/2020 |
$14,160 |
SOs |
Ratable 4-year |
|
COO |
$3,981 |
|||||
|
NIKE, Inc. |
$37,337 |
CEO |
06/01/2020 |
$6,750 |
Cash |
Immediate |
|
Other NEOs |
$2,533 (avg.) |
|||||
|
Tapestry, Inc. |
$4,961 |
All NEOs |
08/17/2020 |
$200 – $500 |
PSUs |
Cliff 2-year |
|
Herman Miller |
$2,487 |
Leadership, including NEOs |
07/14/2020 |
Not disclosed |
Premium SOs |
Ratable 3-year |
* SOs are stock options; PSUs are performance share units.
Looking Ahead
CAP expects companies to make increasingly more changes to their executive compensation programs to address the impact of COVID-19, market volatility and the challenges of credible long-term forecasting.
Annual Incentive Plans
- Use of informed or structured discretion to determine payouts.
- New or increased weighting on operational, strategic, and individual performance metrics. These may be incorporated as environmental, social and governance (ESG) metrics, which provide a more holistic view of business performance and consider different stakeholders.
- Use of wider performance scales around target goals, which may lead to less volatility in payouts.
- Delay of goal-setting to improve accuracy.
- Use of shorter performance periods to address goal-setting difficulties.
Long-Term Incentive Plans
- Increased use of time-based restricted stock/units for retention. CAP still expects at least 50% of long-term incentives to be performance-based, given the long-standing expectations of proxy advisors and major investors.
- Companies may exclude the chief executive officer or named executive officers from the shift to time-based equity.
- Use of relative performance measures (primarily total shareholder return), or an increase in the weight of relative measures.
- Delay of goal-setting to improve accuracy.
- Use of shorter periods for performance-based long-term incentives to lower the risk of the overall incentive program.
Bertha Masuda and Bonnie Schindler discussing the use of ESG metrics in private companies.
CAP partners Bertha Masuda and Susan Schroeder discuss essential components to building robust long term and short term incentive plans as well as what companies overlook when developing incentive plans for their employees
Stock price growth? Meeting the business plan? Beating external expectations? Long-term stability? Companies must consider success across multiple fronts, and boards of directors play a role in defining success by working with management to set the strategic plan and by overseeing how the company progresses toward the achievement of the plan.
Incentive plans are foundational to motivating the senior management team to achieve the goals of a company’s strategic plan. Determining how to best measure and reward performance against these goals is key to designing effective incentive compensation programs that ensure proper alignment of pay outcomes with various degrees of suc- cess against the plan.
To determine how board members measure performance and incorporate it in their company’s incentive compensation plans, Corporate Board Member and Compensation Advisory Partners partnered to survey more than 250 public company directors. In this report, we present our findings and share our perspective on these key issues.
Download the PDF to read the full report.
Compensation Advisory Partners, Equity Methods and PayFactors are sponsoring a long-term incentive (LTI) survey. The purpose of this survey is to provide insight on LTI design features and pay levels below the most senior executive positions as this type of information is challenging to obtain from published survey data. We want to provide a simplified output to help participants understand the typical LTI award opportunities and vehicles used at different salary levels within an organization.
This LTI survey will focus on the following by salary level:
- LTI target opportunity levels
- LTI mix
- Design features of LTI vehicles
- Stock ownership guidelines
Click here for a summary of topics covered.
The survey will take approximately 30 minutes to complete. Submission deadline is Friday April 5, 2019. All responses will be kept confidential and participants will receive a complimentary report on survey findings.
If you have any questions, please contact [email protected] and someone will respond within 1 business day.


