Key CAP Findings
Board Compensation. little/no change
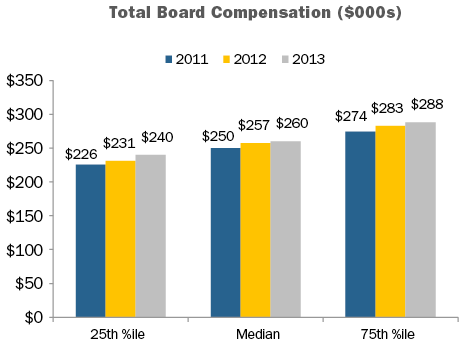
- Total Fees. At median, flat from 2012 to 2013 ($257K vs. $260K)2. Only increased four percent since 2011.
- Retainers. Pay programs have been simplified, now viewed more as an “advisory fee” than an “attendance fee.” In general, companies have moved to a fixed retainer pay structure, with a component in cash and a component in equity.
- Meeting fees. Provided by only 15 percent of companies, down slightly from 2012.
- Equity. Full-value awards (shares/units) are most common. Only five percent of companies use stock options. 92 percent of companies denominate equity awards (stock or options) as a fixed value, versus a fixed number of shares.
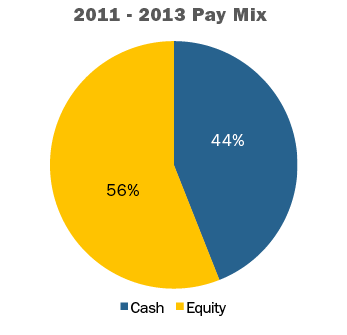
- Pay Mix. On average, 56% equity-based vs. 44% cash-based (consistent for past three years). Alignment with long-term shareholders is reinforced by delivering a majority of compensation in equity.
Committee Member Compensation. little/no change
- Less than half of companies paid committee-specific member fees3.
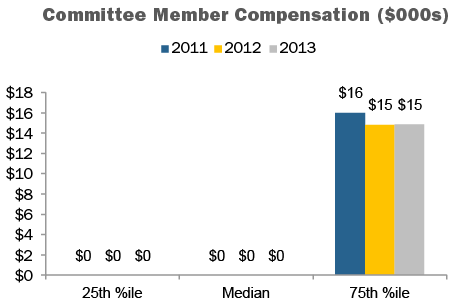
- At median, committee member compensation is $04. There has been a trend away from committee member fees; value typically rolled into Board cash or equity retainers.
Committee Chair Compensation. limited, but notable change
- Nearly all companies provided additional compensation to committee Chairs, versus committee members, typically through an additional retainer. The additional compensation recognizes additional time requirements, responsibilities, and reputational risk.
- At median, $20K in additional compensation (vs. members) was provided to Audit and Compensation Committee Chairs, and $15K to Nominating/Governance Chairs. This is the first year the premium, at median, provided to Compensation Chairs equaled that provided to Audit Chairs.
Independent Board Leader Compensation.
limited, but notable change
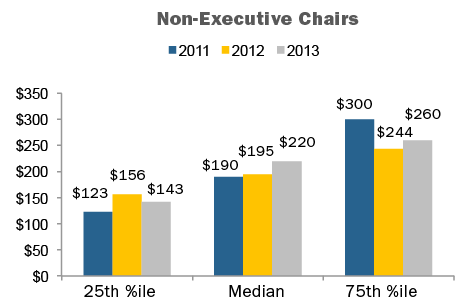
- Non-Exec Chair. Additional compensation is provided by all companies with this role, $220K at median.
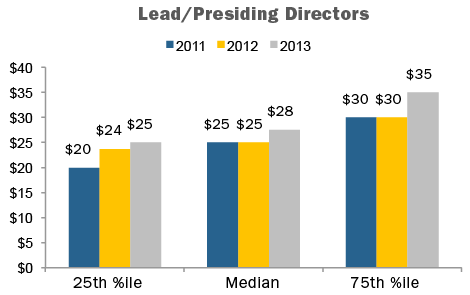
- Lead Director. Additional compensation is provided by nearly all companies with this role5, $28K at median. The differential in pay versus non-executive Chairs is in line with typical differences in responsibilities. Additional compensation was steady, at median, at $25K for the five years prior to 2013.
Perquisites. little/no change
- Overall, limited practice. One-third of companies continue to provide gift matching/charitable contribution.
Pay Limits. NEW to study
- Due mainly to advancement of litigation in Delaware court related to director compensation, several companies (23%) have adopted shareholder approved director compensation limits ($800K, at median). The limit most often applies only to equity-based compensation.
CAP Perspective
Board Pay Levels and Structure
We have hit somewhat of a “steady state” in terms of director pay levels. Over the next few years, we expect modest pay level changes; i.e., low-to-mid single-digit annual increases in Total Board Compensation6. among the broader data set. Individual companies typically make pay level changes every two-to-three years; when they do, the changes tend to be larger than those observed annually within the full data set.
In terms of practices, pay programs have continued a trend towards simplification, as director compensation has become viewed more as an “advisory fee” than an “attendance fee.” Companies have moved to fixed retainer pay structures, with a component in cash and a component in equity, as opposed to use of per-meeting fees.
Director Pay Limits
A number of companies have recently placed limits on director compensation. The limits are largely due to advancement of litigation in Delaware court. In these cases the issue has been that directors approve their own annual compensation, and the shareholder approved long-term incentive plan did not provide “meaningful limits” on the maximum award that could be granted to a director.
When seeking shareholder approval for amendment to an omnibus long-term incentive plan or director compensation plan, 23 percent of companies studied have included value- or share-based limits (13% and 10%, respectively) for non-employee director compensation. These limits range from $250K to $2 million, $800K at median, and typically apply to just equity-based compensation. Some companies have applied the limits to both cash and equity-based compensation while others have excluded initial at-election equity awards, committee Chair pay, and/or additional pay for Board leadership roles from the limit.
We expect prevalence of director pay limits to increase, becoming majority practice within the next three to four years.
Lead Director Compensation
The Lead Director role has evolved, oftentimes a more active role than three to five years ago. As a result, companies are looking at time commitment and responsibilities, and structuring compensation to appropriately reflect the current role and expectations. Boards are engaging in more outreach and meeting with shareholders to talk about governance practices, CEO succession and executive compensation, among other issues, and many investors want to hear from the Lead Director.
Prevalence of providing additional compensation for the Lead Director role has increased over the past five years. Currently, additional compensation is provided by nearly all companies studied with a Lead Director7.
Despite the increased activity of Lead Directors, additional compensation provided for the role continues to be quite different than non-executive Chairs. At median, $28K was provided for the Lead Director role, versus $220K for the non-executive Chair role. In terms of additional compensation, for Lead Directors the pay ranges from $25K to $35K and for non-executive Chairs it ranges from $143 to $260 at 25th and 75th percentiles, respectively. The differential in pay is in line with typical differences in responsibilities. Previously, additional compensation for Lead Directors was steady, at median, at $25K for the last five years. Still, differences exist, somewhat, in role/responsibilities across companies which can impact the level of premium compensation provided for the Lead director role.
Making the decision to provide additional compensation to the Lead Director can send a signal to investors regarding expectations for the role, including time commitment, responsibilities, and authority. Many times, companies have been able to settle (or argue against) shareholder proposals to split the CEO and Chairman roles by instituting (or emphasizing) a strong Lead Director and delineating the specific responsibilities of the position. Boards can also reassure investors concerned about overall governance practices at a company by increasing the Lead Director role/responsibilities. Stock Ownership Guidelines Based on our research, 83% of companies have formal stock ownership requirements. Approximately half of companies studied required directors to defer recognition of equity pay until retirement. The median value of required stock ownership level was $450K.
Detailed Findings
Total Board Compensation
At median, 2013 non-employee director compensation was $260K, generally consistent with 2012.
Pay Mix
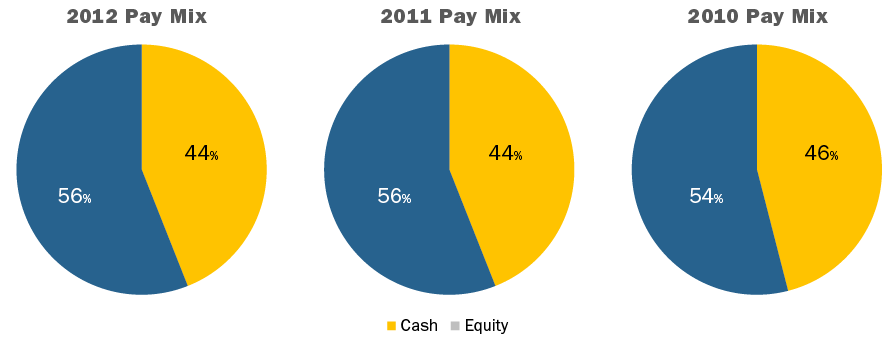
The mix of cash and equity paid to outside directors has remained the same for the last 3 years. On average, 56 percent of compensation was equity-based, and 44 percent was cash-based.
Equity Compensation
Full-value equity awards (stock/units) are the most common form of stock-based compensation. Only five percent of companies used stock options in 2013.
|
Vehicle |
2013 |
2012 |
2011 |
|
Full-Value Equity |
95% |
93% |
93% |
|
Stock Options |
2% |
2% |
5% |
|
Both |
3% |
5% |
2% |
Equity awards denominated as a fixed value, as opposed to awards based on a fixed number of shares, continue to increase in prevalence. In 2013, 92 percent of companies denominated equity awards – stock and/or options – based on a fixed value.
|
Award Type |
2013 |
2012 |
2011 |
|
Fixed Value |
88% |
82% |
84% |
|
FIXED Shares |
8% |
11% |
15% |
|
Both |
4% |
7% |
1% |
Committee Compensation
In 2013, just under half of companies studied paid fees specific to committee members (Audit – 48%, Compensation – 35%, and Nominating/Governance – 32%). Given this, at median, committee member compensation was $0. Among companies that do pay separate fees for committee member service, median compensation during 2013 was $15K.
During 2013, additional compensation (premium vs. member) was provided to 96 percent of Audit Committee Chairs, 90% of Compensation Committee Chairs, and 89% of Nominating/Governance Committee Chairs.
Unlike prior years, during 2013 the additional compensation provided to Audit Committee Chairs, at median, was equal to that provided to Compensation Committee Chairs ($20K). The premium provided to Chairs of Nominating/Governance Committees, at median, was lower ($15K).
Lead/Presiding Directors and Non-Executive Board Chairs
Additional compensation is typically provided to Lead/Presiding Directors and non-Executive Board Chairs.
During 2013, median additional pay provided to Lead Directors and non-executive Chairs increased to $28K and $220K, respectively. Previously, median compensation provided to Lead Directors had been flat for five years.
Best in Class Director Compensation Process & Practices
|
Best in Class Director Compensation PROCESS |
|
|
Best in Class Director Compensation PRACTICES |
|
- 1 Analysis excludes privately held companies.
- 2 Total Board Compensation reflects all cash and equity compensation for Board and committee service, excluding compensation for leadership roles such as committee Chair, Lead/Presiding Director, or non-executive Board Chair.
- 3 Audit, Compensation and/or Nominating and Governance committee members.
- 4 Reflects all compensation for committee member service (excludes additional fees for leadership roles), across all Board committees.
- 5 Excludes controlled companies. Also excludes instances where Lead Director role is assumed by Chair of Nominating and Governance Committee, who receives additional compensation for that role.
- 6 Total Board Compensation reflects all cash and equity compensation for Board and committee service, excluding compensation for leadership roles such as committee Chair, Lead/Presiding Director, or non-executive Board Chair.
- 7 Excludes controlled companies. Also excludes instances where Lead Director role is assumed by Chair of Nominating and Governance Committee, who receives compensation for the role.
Notable Findings
Total Board Compensation
At median, non-employee director compensation increased three percent in 2012, to $257K, after a six percent increase in 2011 and a flat period in 2010. Year-over-year, median Total Board Compensation increased from $250,000 to $257,0003.
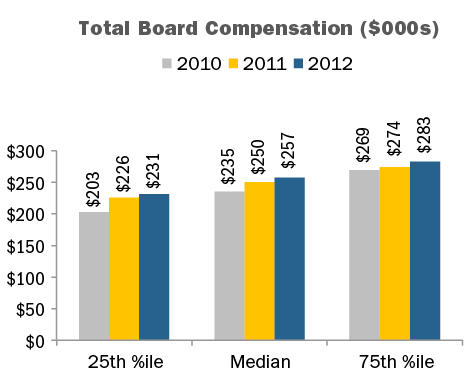
In line with emerging practices, large companies are relying on annual retainers to compensate outside directors. Use of Board meeting fees remained a minority practice in 2012, with only 18 percent of companies paying board meeting fees. This is similar to 2011 and 2010, where 19 percent and 23 percent of companies provided meeting fees, respectively.
Pay Mix
The mix of cash and equity paid to outside directors was generally consistent between 2010 and 2012. On average, the majority of compensation delivered to directors continues to be in the form of equity.
Equity Compensation
Full-value share equity, including restricted stock units, restricted stock, deferred stock units and outright awards of common stock, continues to be by far the most common form of equity delivered to non-employee directors, with only seven percent of companies using stock options as part of the director compensation package.
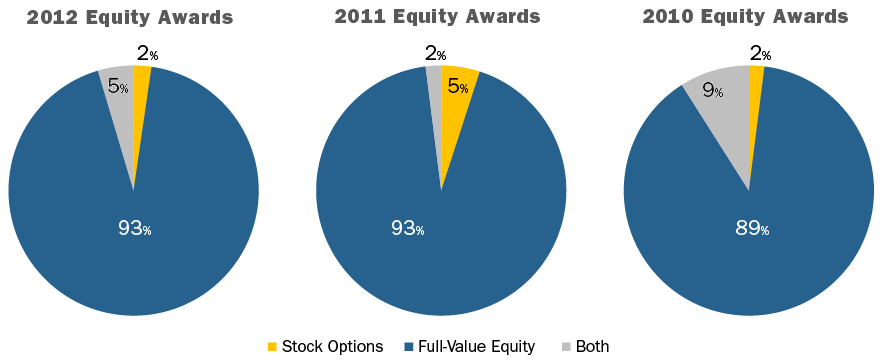
In the recent years, equity awards denominated as a fixed value increased in prevalence, as opposed to awards based on a fixed number of shares.
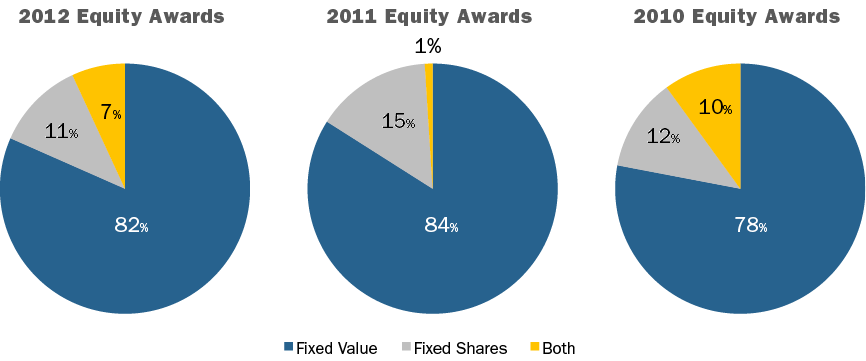
CAP Perspective: Over the next few years, we expect the following changes in director compensation to take place: 1) low-to-mid single-digit annual increases in Total Board Compensation; 2) more companies moving to fixed retainer pay structures with a component in cash and a component in equity as opposed to paying meeting fees; and 3) a continued emphasis on full-value equity awards. Delivering a majority of compensation in the form of equity coupled with stock ownership / retention requirements creates strong alignment with long-term shareholders and is considered a best practice.
Committee Compensation
Companies have de-emphasized committee member compensation, instead focusing on overall Board compensation. Our research found that just over 50 percent of companies pay no committee-specific fees to members of any of the three major committees4, similar to 2011 and up from just over one-third in 2010. Since a slight majority of companies do not pay separate fees for committee service, at median committee member compensation is now $05. Among companies that do pay separate fees for committee service, median committee member compensation is $16K.
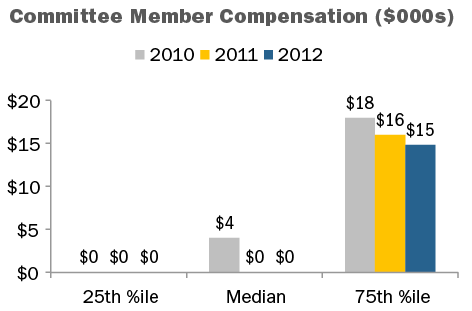
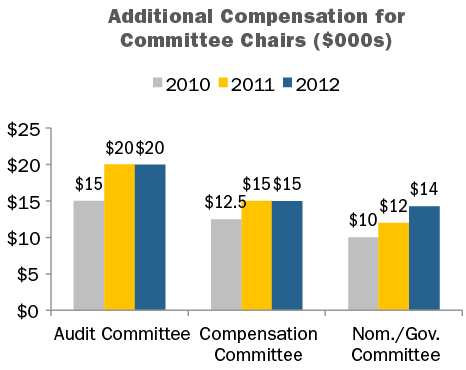
From 2011 to 2012, median additional compensation for committee Chairs remained flat for the Audit and Compensation committees, and increased +17 percent for the Nominating / Governance Committee. Relatively flat year-over-year changes may be associated with a better understanding of the time requirement of the leadership role versus that of a committee member.
CAP Perspective: We expect the trend away from committee member fees to continue, at a slow-to-moderate pace, with the value being rolled into Board cash or equity retainers.
Serving as a committee Chair is generally viewed as a Board leadership role, with additional time requirements, responsibilities, and reputational risk; as a result, additional compensation is often provided for the role.
Near-term, we expect a differential to continue between the additional compensation paid to the Chair of the three major board committees.
Lead/Presiding Directors and Non-Executive Chairmen of the Board
During 2012, the prevalence of providing additional compensation for Lead/Presiding Directors and non-Executive Board Chairs increased to nearly 80 percent, up from approximately 70 percent in 2011 and 65 percent in 2010. In terms of additional compensation for the role, median pay was unchanged at $25,000 in from 2010 to 2012 for Lead/Presiding Directors, and increased slightly for non-Executive Chairs.
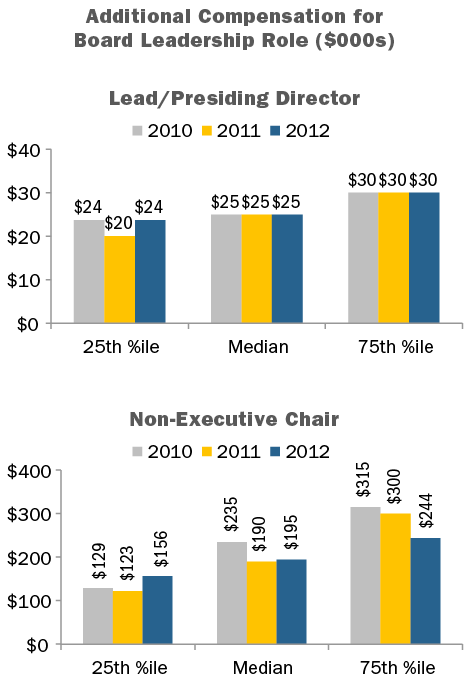
CAP Perspective: While not all non-executive Board leaders receive additional pay for the role, prevalence of additional compensation for these roles is expected to continue to increase over time. The differential in pay between Lead/Presiding directors and non-Executive Chairs is in line with the typical responsibilities of each position.
Conclusion
With the increased scrutiny Boards are under and the time commitment required, in the last five years we have seen a relatively significant increase in non-employee director compensation, though at this point we have hit more of a “steady state” and expect more modest pay level changes going forward. In terms of practices, pay programs have continued a trend towards simplification, as director compensation has become viewed more as an “advisory fee” than an “attendance fee.”
It continues to be important to comprehensively evaluate director pay programs on a regular basis or risk falling behind the curve in terms of desired market positioning and best in class program design. When programs are evaluated, the process and practices listed below should be considered.
|
Best in Class Director Compensation PROCESS |
|
|
Best in Class Director Compensation PRACTICES |
|
1 Analysis includes public Fortune 100 companies (excludes privately held companies).
2 Research assistance for this report was provided by Alex Stahl, Kevin Scott, Armando Rivera and Ryan Colucci.
3 Total Board Compensation reflects all cash and equity compensation for Board and committee service, excluding compensation for additional leadership roles such as committee Chairman, Lead/Presiding director, or non-executive Chairman of the Board.
4 Audit, Compensation and Nominating / Governance committees.
5 Reflects all compensation for committee member service (excludes additional fees for leadership roles), across all Board committees.
If a separate Chair role is desired, the position may be occupied by either an executive or a non-executive. An Executive Chair is frequently a founder or a recently retired CEO who continues on as Chair for a transition period. In a few cases, particularly where a high level of Board independence is necessary, an outsider is hired into the role. In contrast, a non-executive Chair is often a sitting member of the Board whose role is expanded.
At companies where the roles of Chair and CEO are combined, the Lead Director position has become common. In CAP’s annual survey of director compensation at the 100 largest U.S. public companies, the percentage of companies with a Lead Director increased from 38% to 47% in three years, from 2009 to 2011. The percentage of companies reporting a separate non-executive Chair has stayed more stable over the period, at approximately 20%. (In public companies where there is not an independent non-executive Chair or Lead Director, there will be an independent Presiding Director, at times a rotating position.)
When determining the appropriate Board leadership structure, directors must consider which structure will be optimal for their company and its culture. If a Lead Director or a separate Chair is elected, it is essential that the separate roles are clearly defined. This will allow the Board to work more effectively with the CEO and other members of the management team, as well as to best determine the appropriate compensation for the role.
Typical Responsibilities of Various Board Leadership Roles
Typical responsibilities are summarized below. As the typical responsibilities and related time commitment can vary substantially, so does the typical compensation for each role.
|
Role |
Responsibilities |
|
Executive Chair |
Provides counsel to the CEO on organization structure, financial structure and related topics Plays integral part in strengthening relationships with external stakeholders, including shareholders and regulatory bodies Develops and executes the company strategy with the CEO |
|
Non-Executive Chair |
Takes primary responsibility for shaping Board agendas, with input from the CEO Facilitates discussions between independent directors on key issues outside of Board meetings Has a critical role in succession planning May represent the organization to external stakeholders and employees (at the board’s discretion) Does not typically have a direct role in the company’s operations |
|
Lead Director |
Chairs executive sessions of the Board Works with the Chairman & CEO to set agendas for Board meetings Serves as liaison between the Board and the CEO Facilitates discussions between independent directors on key issues outside of Board meetings Does not typically represent the company to external stakeholders Does not typically have a role in the company’s operations |
Executive Chairman
The role of Executive Chair is often viewed as a transitional role. The role’s influence on the business can vary dramatically from company to company. As such, compensation practices vary widely across companies and will reflect each company’s specific circumstances, including:
- Balance of responsibilities between the CEO and the Executive Chair
- Time commitment/involvement (e.g., 1 vs. 3 days per week)
- Expected tenure of the Executive Chair
- Tenure and experience of the CEO
- Equity ownership – equity grants are less likely if the Executive Chair already has a large ownership stake or if the position is viewed as short-term in nature
- Founder vs. non-founder status
For an Executive Chair, compensation levels often reflect the individual’s prior pay package as CEO, as well as the compensation program and pay levels of the current CEO.
- Typical pay elements include base salary, annual bonus opportunity and long-term incentive awards
- Base salary levels may reflect the salary earned in the individual’s prior position. If the time commitment is reduced, a salary reduction may also apply
- Long-term incentive opportunities of an Executive Chair are normally lower than what the CEO receives
- Long-term incentive vehicles granted may vary from the company’s core executive compensation program, due in part to the expectation of a shorter tenure and less ability/time to impact long-term results
CAP consultants reviewed compensation data among 57 general industry companies with an Executive Chair, comparing Executive Chair pay to that of the CEO. We found that, at median, Executive Chair compensation (including salary, bonus and long-term incentives) was approximately 70% of the CEO’s compensation.
|
2012 Executive Chair Data |
Exec Chair Salary |
Exec Chair TCC |
Exec Chair TDC |
||||||
|
25th |
Median |
75th |
25th |
Median |
75th |
25th |
Median |
75th |
|
|
57 General Industry Cos. (Median Revenues of $2.4B) |
70% |
90% |
100% |
65% |
85% |
105% |
35% |
70% |
100% |
For reference, below is a breakout of the pay package for three recent, high profile Executive Chairs.
|
Recent Executive Chairman Compensation Packages at Large Organizations |
|||
|
Company |
Hewlett-Packard |
Kraft Foods Inc. |
Sara Lee |
|
Revenue |
$127.2B |
$54.3B |
$8.7B |
|
Executive Chairman |
Raymond J. Lane |
John T. Cahill |
Jan Bennink |
|
Date Hired as Executive Chairman |
September 2011 |
January 2012 |
January 2011 |
|
Previous Role |
Non-Executive Chair |
Outside / New Hire |
Non-Employee Director |
|
Base Salary |
None |
$0.75M |
$1.00M |
|
Target Bonus |
None |
$0.75M (100% of base) |
$1.75M (175% of base) |
|
Long-Term Incentives |
$8.44M (1) |
$4.50M |
$5.25M |
|
Target Total Direct Compensation (TDC) |
$8.44M |
$6.00M |
$8.00M |
|
TDC as a % of CEO |
46% |
97% |
129% |
|
LTI Award Vehicle LTI Grant Frequency (annual, one-time) |
20% Time-Based Stock Options 80% Performance-Based Stock Options One-Time(2) |
75% RSUs 25% Stock Options Not disclosed |
50% RSUs 50% Stock Options Not disclosed |
|
Vesting |
Time-Based: 3 Year Ratable Vesting Performance-Based: Requires 120-140% price appreciation |
3 Year Cliff Vesting (RS) 3 Year Ratable Vesting (SO) |
2 Year Cliff Vesting |
|
LTI Award Vehicles Different from Executive LTI Program |
Yes |
Yes |
Yes |
- Excludes fees as non-executive Chair, including $2.19M RSU award
- 1M stock options were awarded (200,000 options with 3-year ratable vesting; 400,000 options vest upon stock price appreciation of 120% from grant price; 400,000 options vest upon stock price appreciation of 140% from grant price).
Non-Executive Chairman / Lead Director Compensation
Compensation packages for non-executive Chairs and Lead Directors typically consist of the core compensation program for non-employee directors along with an additional stipend (or premium) that reflects the responsibilities and time commitment of the role. This approach appropriately recognizes the differential between a leadership position and other directors, with the magnitude of the premium reflecting the additional responsibilities.
CAP’s market data indicates that all companies with a non-executive Chair provide a premium for the role, and 69% of companies provide a pay premium for the Lead Director role.
Non-executive Chair pay is typically delivered in one of two ways:
- An additional retainer paid in cash or stock, in addition to the regular outside director pay program
- A separate fixed dollar amount provided in cash, stock or a combination, in lieu of the regular outside director pay program
As indicated below, the premium provided to a Lead Director is often much smaller than the premium provided to a non-executive Chair. Our data indicates that a non-executive Chair receives a median premium of +65% compared to a regular outside director’s package. For a Lead Director, the median premium is +10%.
|
Non-Executive Chairman and Lead Director Premium Compensation General Industry Companies with Median Revenues of $2.3B |
|||||
|
Leadership Position |
No of Cos. |
Prevalence of Cos. Providing Additional Compensation |
Multiple of Non-Employee Director Compensation (Median) Primary Reference |
Additional Premium – Median |
Additional Premium – Range |
|
Non-Executive Chairman |
42 |
100% |
1.65x |
$100,000 |
$20k – $577K |
|
Lead Director |
114 |
69% |
1.10x |
$20,000 |
$5K – $140K |
Conclusions
The structure and amount of compensation paid to Executive Chairs differ from non-executive Chairs and Lead Directors, a direct reflection of the roles, duties and time commitment required for each position.
Executive Chairs participate in the company’s executive compensation programs. Base salary, annual incentive and long-term incentives are commonly offered, yet pay programs are situation-specific and frequently transitional in nature. The Executive Chair’s expected tenure and perceived ability to influence longer term results are considerations that impact the amount and form of incentive compensation used.
As companies increasingly focus on improving Board independence, it will be important to evaluate whether or not separate Chair and CEO roles are appropriate. Companies should assess which organization structure makes sense given its unique circumstances. Companies anticipating a transition period due to executive turnover, the need to improve governance or a corporate transaction should re-assess the appropriate structure necessary to best navigate through turbulent times.
We are pleased to present the 3nd annual report on non-employee director (NED) compensation produced by Compensation Advisory Partners LLC (CAP). The report provides a review of current director pay practices among the largest public U.S. corporations (trend setting organizations) and Observations regarding trends and outlook.
Notable Findings
Total Board Compensation
At median, non-employee director compensation increased six percent in 2011, after being flat in 2009 and 2010. Year-over-year, median Total Board Compensation increased from $235,000 to $250,000{anchor anchor=’footnote-907-3′ text=’3′}.
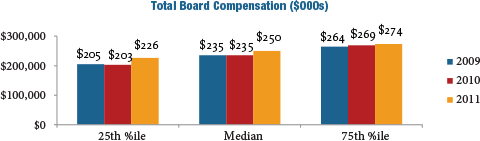
Use of Board meeting fees was a minority practice in 2011, with only 19 percent of companies paying meeting fees. This declined from 23 percent in 2010. In line with emerging practices, more and more large companies are relying on annual retainers to compensate outside directors.
Pay Mix
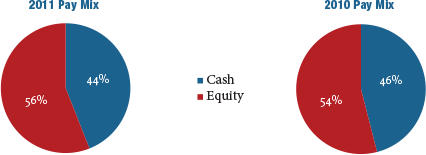
The mix of cash and equity paid to outside directors was generally consistent between 2010 and 2011. On average, the majority of compensation delivered to directors continues to be in the form of equity.
Equity Compensation
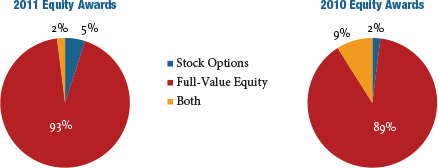
Full-value equity awards, including restricted stock units, restricted stock, deferred stock units and outright awards of common stock, continued to increase as a percentage of total equity delivered. In 2011, only seven percent of large companies granted stock options, down from 11 percent in 2010.
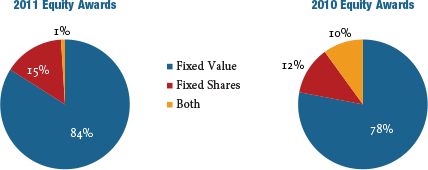
Year-over-year, equity awards denominated as a fixed value increased in prevalence, as opposed to awards based on a fixed number of shares.
CAP Perspective: Over the next few years, we expect the following changes in director compensation to take place: 1) low-to-mid single-digit annual increases in Total Board Compensation; 2) more companies moving to fixed retainer pay structures with a component in cash and a component in equity as opposed to paying meeting fees; and 3) a continued emphasis on full-value equity awards. Delivering a majority of compensation in the form of equity coupled with stock ownership/retention requirements creates strong alignment with long-term shareholders and is considered a best practice.
Committee Compensation
Companies are de-emphasizing committee member compensation and focusing on overall Board compensation. Our research found that just over 50 percent of companies studied pay no committee-specific fees to members of any of the three major committees{anchor anchor=’footnote-907-4′ text=’4′}, an increase from approximately one-third in 2010. During 2011, median committee member compensation decreased when compared with 2010{anchor anchor=’footnote-907-5′ text=’5′}. At median, committee member compensation is now $0.
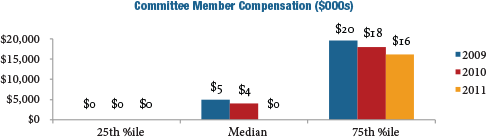
CAP Perspective: We expect the trend away from committee member fees to continue at a slow-to-moderate pace with the value being rolled into Board cash or equity retainers.
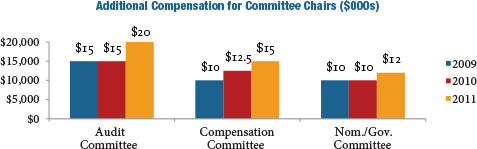
Unlike member compensation, median additional compensation for committee Chairs increased from 2010 to 2011: +33 percent for the Audit Committee; +20 percent for the Compensation Committee (following a 25 percent increase from 2009 to 2010); and +20 percent for the Nominating/Governance Committee. The increases have been driven by recognition of the differential between the time requirement of the leadership role versus that of a committee member.
Lead/Presiding Directors and Non-Executive Chair of the Board
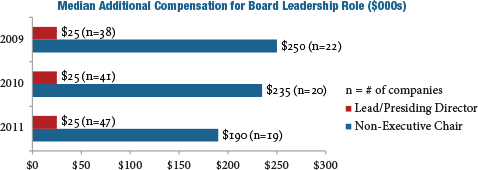
During 2011, the prevalence of providing additional compensation for Lead/Presiding Directors and non-Executive Board Chairs increased from approximately 65 percent in 2010 to approximately 70 percent in 2011. In terms of additional compensation for the role, median pay was unchanged at $25,000 in 2011 for Lead/Presiding Directors and decreased for non-Executive Chairs.
CAP Perspective: While not all non-executive Board leaders receive additional pay for the role, prevalence of additional compensation for these roles is expected to continue to increase over time. The differential in pay between Lead/Presiding Directors and non-Executive Chairs is in line with the responsibilities of each position.
Conclusion
The time commitment and potential for reputational and legal risk connected with service as a director has increased over the past few years, yet economic challenges and an uneven recovery have slowed the rate of growth in director compensation. Due to this, we have observed only moderate increases to director pay levels. However, pay practices for directors continue to evolve. We have observed a continuing and significant trend towards simplification, as director compensation becomes viewed more as an “advisory fee” than an “attendance fee.”
It continues to be important to comprehensively evaluate director pay programs on a regular basis or risk falling behind the curve in terms of desired market positioning and best in class program design. When programs are evaluated, the process and practices listed below should be considered.
|
Best in Class Director Compensation PROCESS |
Establish director pay levels and structure in an informed, deliberate and objective way, with consideration given to market data, trends and outlook Define target market positioning for total pay “Market” should reflect the peer group used for executive compensation benchmarking and/or size-appropriate general industry data Use compensation as a tool to align the interests of non-employee directors and long-term shareholders Disclose the director compensation philosophy and rationale for the program |
|
Best in Class Director Compensation PRACTICES |
Align pay levels with an organization’s size and complexity; in turn, provide appropriate pay for time and responsibilities Review director pay programs focusing on aggregate pay (Total Board Compensation), considering the ratio of cash compensation to equity compensation and additional pay for Board leadership roles Structure pay so that equity represents at least half of the total The pay program should be viewed as an “advisory fee” vs. an “attendance fee” Establish meaningful equity ownership requirements Eliminate benefit/perquisite programs unless there is a strong business case for maintaining them |
1 Analysis includes public Fortune 100 companies (excludes privately held companies).
2 Research assistance for this report was provided by Roman Beleuta, Armando Rivera and Kevin Scott.
3 Total Board Compensation reflects all cash and equity compensation for Board and committee service, excluding compensation for additional leadership roles such as committee Chair, Lead/Presiding Director, or non-executive Chair of the Board.
4 Audit, Compensation and Nominating/Governance committees.
5 Reflects all compensation for committee member service (excludes additional fees for leadership roles), across all Board committees.
Notable 2010 Findings
Total Board Compensation
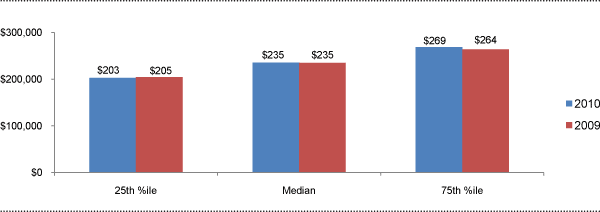
At median, pay levels for non-employee directors were flat from 2009-10. Year-over-year, median Total Board Compensation remained steady at $235,000 i.
Total Board Compensation ($000s)
In line with emerging practices among large companies, use of Board meeting fees was minority practice in 2010, with only 23% of companies paying meeting fees.
Pay Mix
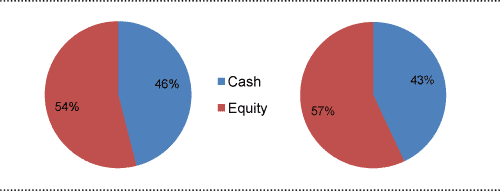
On average, the cash vs. equity pay mix was generally consistent between 2009 and 2010. The majority of compensation delivered to non-employee directors continues to be in the form of equity.
2010 Pay Mix | 2009 Pay Mix
CAP Perspective:
Over the next few years, we expect the following trends in director compensation to take place: 1) low to mid single-digit annual increases in Total Board Compensation; 2) more companies moving to fixed cash pay structures; 3) a continued emphasis on full-value equity awards.
Equity Compensation
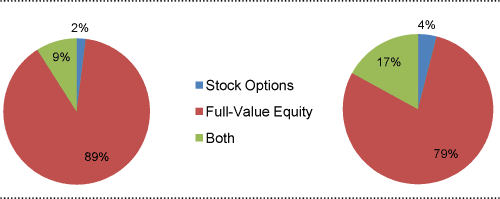
On average, an increased portion of 2010 equity-based compensation for non-employee directors was paid in the form on full-value awards, as compared to 2009.
2010 Equity Awards | 2009 Equity Awards
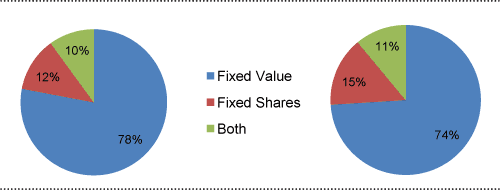
Year-over-year (2010 vs. 2009), equity awards denominated as a fixed value increased in prevalence, as opposed to those based on a fixed number of shares.
2010 Equity Awards | 2009 Equity Awards
Committee Compensation
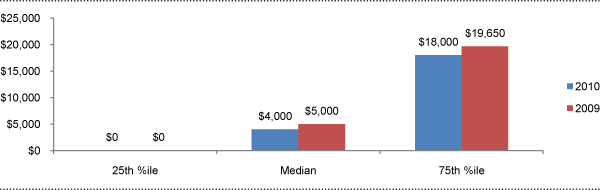
During 2010, median committee member compensation was generally consistent with 2009ii. Our research also found that approximately one-third of companies studied pay no committee-specific fees to members of any of the 3 major committeesiii.
Committee Member Compensation
CAP Perspective:
We expect the trend away from committee member fees to continue, with the value being rolled into board cash or equity retainers, as many companies now view all Board members as active participants in committee-level work.
At median, additional compensation for committee Chairs remained flat for the Audit and Nominating / Governance committees, and rose by 25% for the Compensation Committee, driven by increased time requirements and scrutiny of executive compensation.
Median Additional Compensation for Committee Chairs
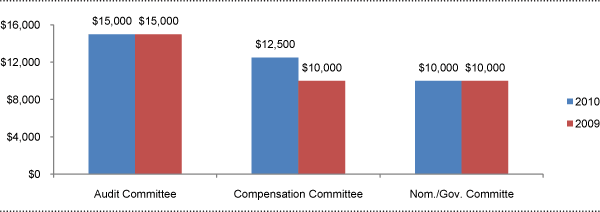
Lead/Presiding Directors and Non-Executive Chairs of the Board
During 2010, the prevalence of additional compensation for Lead/Presiding Directors and non-Executive Board Chairs remained flat as compared to 2009. While, at median, additional compensation for Lead/Presiding Directors remained flat, additional compensation for non-Executive Chairs decreased slightly.
Median Additional Compensation for Board Leadership Roles ($000s) (excl. 0s)
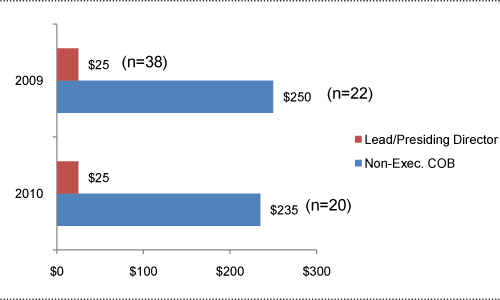
CAP Perspective:
While not all non-executive Board leaders receive additional pay for the role, prevalence of additional compensation for these roles is expected to increase over time. The differential in pay between Lead/Presiding directors and non-Executive Chairs is in line with the typically different responsibilities of each position.
Conclusion
As shown above, there was nominal change in director pay levels and practices year-over-year (2010 vs. 2009) among the largest public U.S. corporations.
It is important for companies to regularly evaluate their overall non-employee director compensation program, or risk falling behind the curve in regards to desired relative market positioning and best in class program design. While reviews should be conducted regularly, it is usually unnecessary for design or pay level changes to take place more often than every 2-3 years.
CAP will release its full report on non-employee director compensation during Fall 2011. The report will provide a detailed analysis of year-over-year changes in pay levels, pay practices and other program design considerations, as well as a discussion of best in class director compensation program setting process.
- i Compensation reflects all cash and equity compensation for Board and committee service, excluding compensation for additional leadership roles such as committee Chair, Lead/Presiding director, or non-executive Chair of the Board.
- ii Reflects all compensation for committee member service (excludes additional fees for leadership roles), across all Board committees.
- iii Audit, Compensation and Nominating / Governance committees.
- A review of current director pay practices among the largest public U.S. corporations, generally considered trend setting organizations
- Observations regarding trends and outlook
- The Report’s Best in Class Director Compensation Process / Practices, listed below, provide a strong foundation for non-employee director compensation programs at organizations of any size/industry
- This report was authored by Dan Laddin and Matt Vnuk, with research assistance from Shaun Bisman, Meredith St. Lawrence, Deep Patel, Harsha Raghunath, and Devika Ray. Questions and comments should be directed to Dan Laddin or Matt Vnuk at [email protected] or (212) 921-9359, [email protected] or (212) 921-9364
Additional information on Compensation Advisory Partners can be found in the Company Profile section of the Appendix
Table of Contents
Executive Summary
Pay Levels
- Board Member Total Compensation
- Board Cash Retainers
- Board Meeting Fees
- Committee Member Compensation
- Total Board Cash Compensation
- Value of Equity Awards
- Committee Chair Compensation
- Non-Executive Board Leadership (additional compensation)
Pay Practices
- Mix
- Equity Vehicle Type
- Denomination of Equity Awards (fixed value vs. fixed shares)
- Vesting of Equity Awards
- Non-Executive Board Leadership (additional compensation)
Other Program Design Considerations
- Total Company Cost (of Board oversight)
- Board Membership and Meetings
- Committee Membership and Meetings
- Stock Ownership Guidelines (requirements)
- Benefits and Perquisites
Appendix
- Board Member Total Compensation (industry medians)
- Methodology
- Public Fortune 100 Companies
- Company Profile (Compensation Advisory Partners)
Executive Summary
- Best in Class Director Compensation Process / Practices
- Notable Findings / Outlook
- Elements Studied
Executive Summary | Best in Class Director Compensation Process / Practices
Process – Independent Directors Should:
- Establish a process to determine director pay levels and structure in an informed, deliberate and objective way, with consideration given to market data, trends and outlook
- Define target market positioning for total pay
- Target should typically align with executive compensation philosophy
- “Market” should reflect the peer group used for executive compensation benchmarking and/or size-appropriate general industry data; at times, other reference points may also be appropriate
- Use compensation as a tool to align the interests of non-employee directors and long-term shareholders
Practices – Compensation / Governance Committees Should:
- Align pay levels with an organization’s size and complexity; in turn, provide appropriate pay for time and responsibilities
- Review director pay programs focusing on aggregate pay (Total Board Compensation), with consideration given to:
- The ratio of cash compensation to equity compensation
- Additional pay for Board leadership roles
- Structure pay so that equity represents at least half of the total; however, the pay program should:
- Not be highly leveraged
- Be viewed as a “management fee”
- Establish meaningful equity ownership requirements that must be achieved within, at most, 5 years
- Eliminate benefit / perquisite programs unless there is a strong business case for maintaining them
- Provide detailed disclosure of the director compensation philosophy and rationale for the program
Executive Summary | Notable Findings / Outlook
Looking Back – While workload increased over the past couple of years, dramatic economic changes and poor performance increased scrutiny and debate in regard to director pay programs. Therefore, it is not surprising that this year’s study found:
- Conservative increases in pay levels; from 2008 to 2009 Total Board Compensation increased 4 percent, at median
- Year-over-year, no change in median pay mix
- Reduction in the prevalence of meeting fees, which were already minority practice
- Increase in the prevalence of full-value equity awards, with a corresponding decrease in the prevalence of stock options
- Increase in the prevalence of equity awards based on a fixed value, with a corresponding decrease in equity awards based on fixed number of shares
- At least one full-value equity award will not be transferred until retirement at approximately 50% of companies studied
Looking Ahead – Over the next few years, changes in director compensation will take place in terms of both pay levels and program design; specifically:
- Low-to-mid single digit annual increases in Total Board Compensation
- More companies moving to a fixed cash pay structure, with related:
- Decreases in the prevalence of meeting fees, especially Board meeting fees
- Slow / gradual decrease in the prevalence of committee member compensation
- Continued growth in prevalence of full-value equity awards, with corresponding decreases in the prevalence of stock option awards
- Increases in equity awards based on a fixed value, with corresponding reductions in equity awards based on fixed number of shares
- Increased use of, and modifications to, stock ownership guidelines / requirements
- Continued growth in the prevalence of hold until / transfer at retirement equity award provisions
It is important for companies to comprehensively evaluate their director compensation programs regularly, or risk falling behind the curve in regards to desired relative market positioning and best in class program design. While reviews should be conducted regularly, it is usually unnecessary for major design changes to take place more often than every 2 –3 years.
Note: there will be a follow-up CAPFlash made available in early 2011 discussing the top 5 director compensation considerations for the next year.
Executive Summary | Elements Studied
CAP’s consulting staff reviewed current director compensation programs for each of the public Fortune 100 companies.
- The Fortune 100 reflects the largest U.S. corporations based on annual revenue (93 are public companies); see Appendix for a list of the 93 companies in this year’s survey
- “CAP Observations,” included throughout this report, provide commentary on trends and outlook
Elements Studied:
- Annual Cash Retainer
- Total Board Meeting Fees; per meeting fee times the number of meetings
- Committee Member Compensation; all meeting fees and retainers
- Total Board Cash Compensation; sum of cash retainer, total Board meeting fees and average committee member compensation
- Equity Awards (stock retainer); full-value shares/equivalents and stock options
- Total Board Compensation; sum of Total Board Cash Compensation and Equity Awards
- Total Company Cost (of Board oversight); Total Board compensation times number of non-employee directors plus additional/premium pay for committee leadership (Chair) roles and additional/premium pay for independent Board leadership roles (presiding / lead director or non-executive chair)
2010 Study Also Provides Data / Analysis On:
- Equity grant practices, compensation for leadership positions, stock ownership guidelines, perquisites/benefits, and industry pay practices
Note: Total Board Cash Compensation includes committee member compensation (excludes additional/premium meeting fees or retainers paid for chairing a committee) as the trend is towards companies building fees for basic committee service into annual Board fees/retainers. Further, committee member compensation is typically cash-based.
Executive Summary | Elements Studied (Continued)
While this analysis of Fortune 100 data focuses on the group of companies as a whole, industry specific practices were also reviewed (click here to see the list).
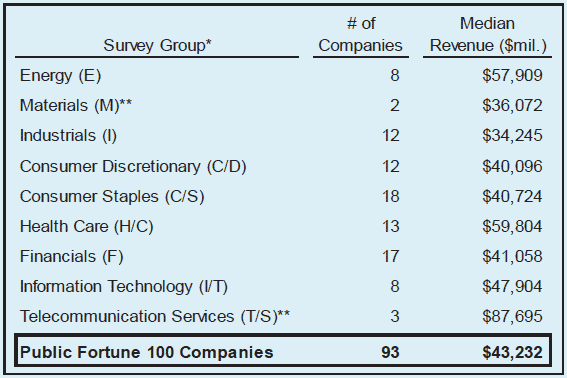
* Industry groups were determined by GICS code.
** Due to limited number of companies, revenue listed reflects industry average, not median.
Pay Levels
- Board Member Total Compensation
- Board Cash Retainers
- Board Meeting Fees
- Committee Member Compensation
- Total Board Cash Compensation
- Value of Equity Awards
- Committee Chair Compensation
- Non-Executive Board Leadership (additional compensation)
Pay Levels | Board Member Total Compensation
Between 2008 and 2009, basic compensation for service as a Board member (Total Board Compensation) increased approximately 4 percent, from $225,000 to $235,000 (at median).
- Reflects all cash and equity compensation, excluding compensation for additional leadership roles such as committee Chairman, Lead/Presiding director or non-executive Chairman of the Board
- CAP’s director compensation best practices (p.5) state that director compensation should be reviewed focusing on aggregate pay
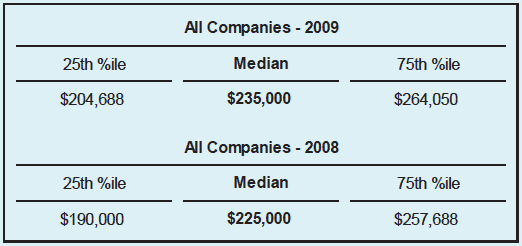
CAP Observation:
- Director compensation levels increased substantially several years ago following the new demands of Sarbanes-Oxley, but pay has recently leveled off
- As a result of increased director workloads, during each of the next few years, we expect to see low-to-mid single-digit increases in Total Board Compensation
- We also expect to see more companies adopt a fixed cash pay structure
Pay Levels | Board Cash Retainers
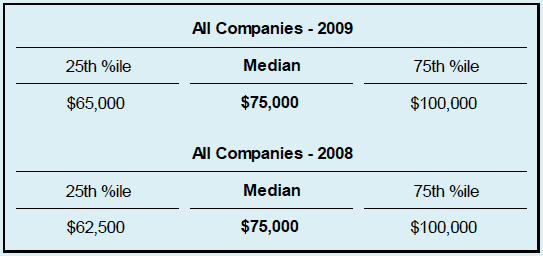
The value of annual Board cash retainers remained constant over the past 2 years, at median.
- 98 percent of companies studied provide an annual cash retainer
CAP Observation:
- Once 2010 director pay levels are available, in part due to more companies moving to a fixed cash pay structure, we expect to see a small to moderate increase in the median value of annual cash retainers, as compared to 2009
Pay Levels | Board Meeting Fees
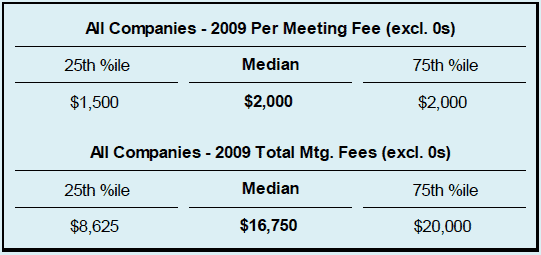
Board meeting fees are a minority practice, provided by only 23 percent of companies studied in 2009. Therefore, the median Board meeting fee in 2009 was zero.
- Of the companies studied that provide Board meeting fees, some only do so for special meetings or for meetings in excess of a minimum number
- Only 19 percent of companies studied provided Board meeting / attendance fees for all regular Board meetings
- This is down from 21 percent in 2008
- Among those companies paying meeting fees for all regular Board meetings, the median fee in 2009 was unchanged from 2008
CAP Observation:
- The practice of using Board meeting fees continues to decline in prevalence, partly in reaction to difficulties in defining what constitutes a “meeting” (e.g., ad hoc teleconferences)
- Companies that eliminate meeting fees typically provide an increased Board cash or equity retainer
- We expect to see more companies simplify their director compensation programs and eliminate meeting fees, moving towards a more fixed cash pay structure / “management fee”
Pay Levels | Committee Member Compensation
From 2008 to 2009, committee member compensation increased slightly, about 5 percent at median; reflects average compensation received by a director for all committee member service (includes 0s).
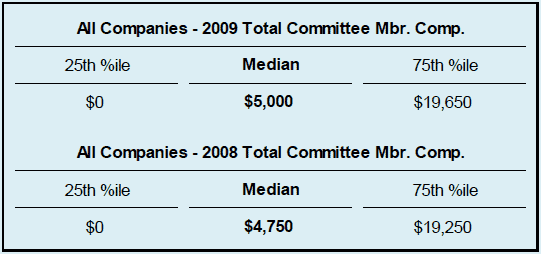
- Over 35% of companies studied pay no committee-specific fees to members of any of the 3 major committees
- The median committee meeting fee for each of the Audit, Compensation and Nominating / Governance committees is $0
- The median committee member retainer at the Audit Committee is $10,000, but is $0 at the Compensation and Nominating / Governance committees
- Most often, the Audit Committee involves the largest workload; however, over recent years workload has been becoming less differentiated between the 3 major Board committees
CAP Observation:
- Many companies are shifting, or have shifted, committee member fees to the annual Board cash or equity retainer, viewing all Board members as active participants in Board matters / committee-level work
- In 2010, we may see moderate decreases in committee member compensation, primarily due to additional companies shifting committee-specific (member) fees to the annual Board cash or equity retainer
Pay Levels | Total Board Cash Compensation
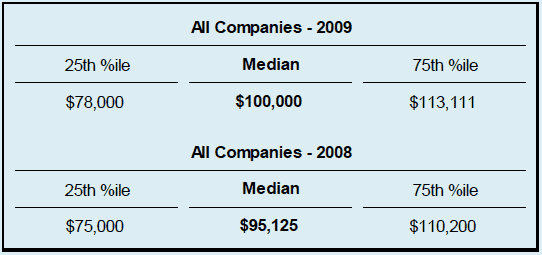
From 2008 to 2009, Board cash compensation[1] increased approximately 5 percent.[2]
- 98 percent of companies studied provide annual cash compensation to non-employee directors
CAP Observation:
- In 2010, we expect to continue to see moderate increases in Board cash compensation
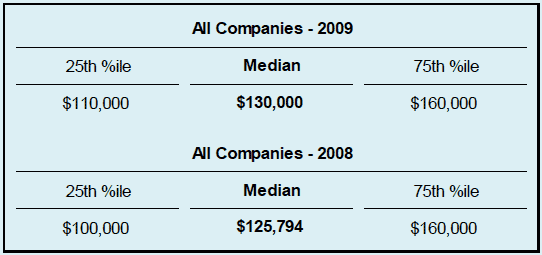
Pay Levels | Value of Equity Awards
Despite rebounding equity markets, from 2008 to 2009 the median value of equity awards increased only 3 percent, due largely to the majority practice of granting equity awards based on a fixed value.
- Granting equity awards is as near universal practice, with about 95 percent prevalence among companies studied
- Initial at-election equity awards, meant to “ramp up” director equity ownership and alignment with shareholders, as well a recruitment tool, are a minority practice (under 20 percent of companies studied)
- From 2008 to 2009, there was a small decrease in the prevalence of initial at-election equity awards
- During 2009 a small number of companies (ex: Apple and Caterpillar) intentionally reduced or eliminated equity awards
- Apple switched from granting a fixed number of stock options annually to a fixed value award of restricted stock units
- Caterpillar discontinued annual equity awards, but instituted a stock ownership requirement
CAP Observation:
- From 2009 to 2010, we expect to see a:
- Moderate increase in annual equity award values
- Continued decrease in the prevalence of initial at-election equity awards
Pay Levels | Committee Chair Compensation
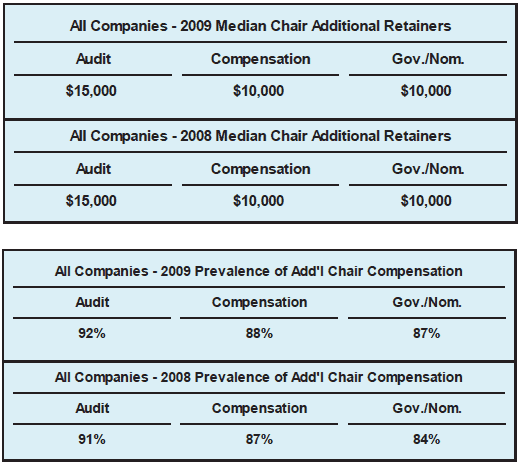
From 2008 to 2009, the median value of additional retainers for committee Chairs (retainer value in-addition to that provided to committee members) remained constant.
- The total value of Chair retainers was also reviewed, and also remained constant from 2008 to 2009
- Chart below excludes zeros
CAP Observation:
- If workload between the major Board committees continues to become less differentiated, there may be less differentiation in additional / premium retainers for the Chairs of the major Board committees
- In 2009, approximately 20 percent of Fortune 100 companies did not differentiate additional / premium pay for the Chairs of the 3 major Board committees, and about another 10 percent of Fortune 100 companies did not differentiate additional / premium pay between the Chairs of the Audit and Compensation committees
Pay Levels | Non-Executive Board Leadership (additional compensation)
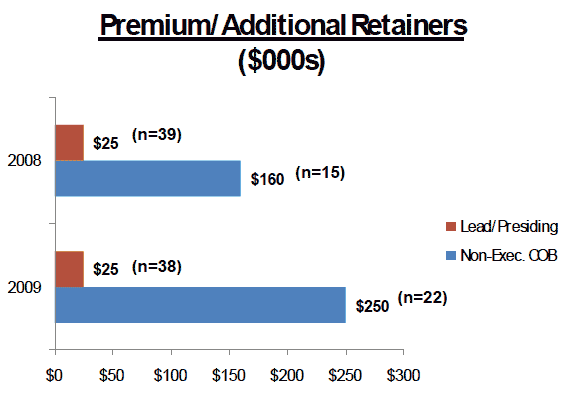
At median, the premium / additional retainer paid to non-executive Chairmen is 10 times that paid to Lead / Presiding directors.
- The median additional retainer for Lead / Presiding directors was consistent from 2008 to 2009 (excludes zeros)
- The median additional retainer paid to non-executive Chairman increased from 2008 to 2009 (excludes zeros); year-over-year, there were also more non-exec. COBs receiving additional pay
- While it is common to pay an additional retainer to independent Board leaders, not all receive an additional retainer
- It is most common to provide additional pay to a non-executive Chairman, and less common to do so for Presiding directors
- Prevalence of additional pay for Board leadership roles increased year-over-year
- Under 5 percent of companies providing additional pay do so for both a Lead / Presiding director and a non-executive Chairman
CAP Observation:
- When determining compensation for a Board leadership position, it is important to consider:
- Does the role merit a premium based on scope of responsibilities, workload, visibility, influence, etc.?
- How do the role / responsibilities relate to that of committee Chairs?
- While not all non-executive Board leaders receive additional pay for the role, prevalence is expected to continue increasing
- The differential in pay between Lead / Presiding directors and a non-executive Chair is in-line with the typically different responsibilities of each position
Pay Practices
- Mix
- Equity Vehicle Type
- Denomination of Equity Awards
(fixed value vs. fixed shares) - Vesting of Equity Awards
- Non-Executive Board Leadership
(additional compensation)
Pay Practices | Mix
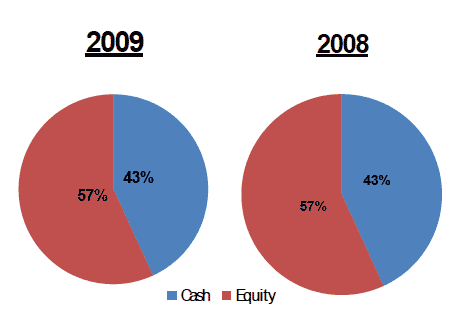
Over the past 2 years, cash versus equity pay mix has remained constant, with equity representing a majority of pay.[3]
- Reflects all cash and equity compensation, excluding compensation for additional leadership roles such as committee Chairman or independent Board leader (Lead / Presiding Director or non-executive Chairman of the Board)
- CAP’s Best in Class Director Compensation Process / Practices (p.5) state that independent directors should structure pay so that equity represents the majority of compensation
Both on average and at median, the weighting of the various elements of Total Board Compensation was nearly consistent between 2008 and 2009.
- Includes cash retainer, Board meeting fees, stock options, full-value equity awards, and committee member compensation
CAP Observation:
- Once 2010 director pay levels are available, we expect to see the portion of pay delivered in equity-based compensation to be similar to 2008 and 2009, with a slight increase possible
- Equity-based compensation aligns director pay with wealth created or lost for shareholders, especially when the equity-based pay is required to be held for an extended period of time
- Additionally, during 2010 we expect that the overall pay mix will remain relatively constant; however, over the next few years, we expect the weighting of stock options and committee member compensation to decrease even further, with a corresponding increase in full-value equity awards and cash retainer
Pay Practices | Equity Vehicle Type
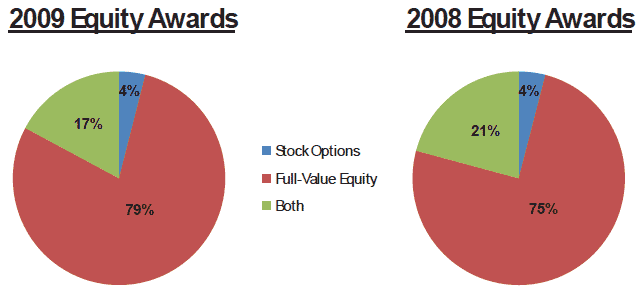
From 2008 to 2009, the prevalence of stock option awards declined (less companies granted both full-value equity awards and stock options), with a corresponding increase in the prevalence of full-value equity awards.
- As compared to full-value awards, stock options are both more leveraged and more likely to be granted based on fixed number of shares (rather than based on a fixed value)
- Stock option values and equity awards based on a fixed number of shares are strongly affected by swings in stock price
- Two companies granted performance-based equity awards to directors in 2009, Intel and Coca-Cola
CAP Observation:
- As companies move more towards viewing director compensation as somewhat of a “management fee,” combined with a strong focus on risk management, we expect to see a continued move toward increased use of full-value equity awards
- However, practices vary by industry and we do not expect the use of stock options to stop completely; i.e., in some industries the prevalence of stock option awards is greater than others and/or that seen in general industry data
- While two companies studied granted performance-based equity awards to directors during 2009, we do not expect this to become a trend
Pay Practices | Denomination of Equity Awards (fixed value vs. fixed shares)
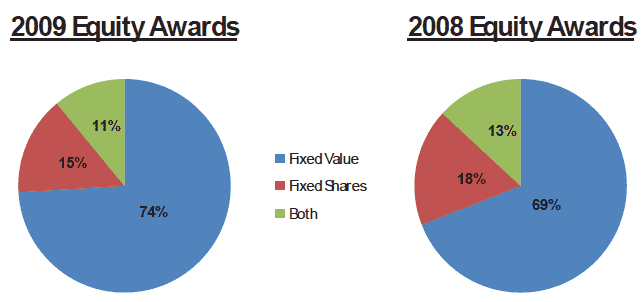
Director equity awards are based on either a fixed value or a fixed number of shares. From 2008 to 2009, the prevalence of fixed value equity awards increased 5 percent, accounting for nearly three quarters of all equity awards.
- When equity awards are based on a fixed value, the number of shares / options granted changes each year, but the grant date value remains constant; however, when equity awards are based on a fixed number of shares, the value of the award changes each year mostly due to changes in stock price, but the number of shares granted remains constant from one year to the next
- Therefore, director compensation is more predictable from one year to the next when equity awards are based on a fixed value
CAP Observation:
- Part of the year-over-year shift is due to the declining prevalence of stock option awards
- Stock options are more likely than full-value equity awards to be based on a fixed number of shares
- Over the past few years, volatile stock prices have helped drive a trend towards fixed value equity awards
- Fixed value equity awards can be viewed as prudent risk management, a predictable way to reach expectations related to director stock ownership, linking long-term director interests with those of shareholders
Pay Practices | Vesting of Equity Awards
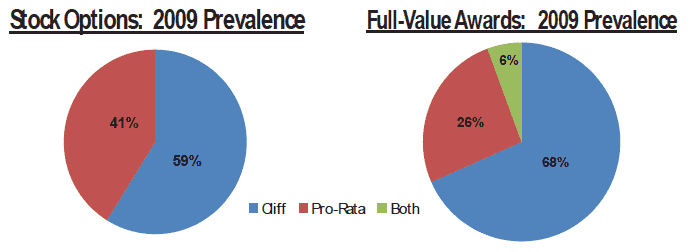
A majority of both stock option and full-value equity awards cliff vest.
- Year-over-year, the percent of stock options with cliff vesting increased, while the percent of full-value equity awards with cliff vesting remained constant
- Both stock options awards and full-value equity awards typically vest after 1 year, at median
- At least one full-value equity award at approximately 50 percent of companies studied will not be transferred to directors until retirement
- Since 2008, the prevalence of this practice has increased
CAP Observation:
- For a number of years, there has been a trend towards declassification of Boards; i.e., one year terms
- Short vesting periods line up with the term of declassified Boards
- Short vesting periods and hold until / transfer at retirement provisions, for director equity awards, are often viewed as best practices
- We expect short vesting periods to remain majority practice, and the prevalence of hold until / transfer at retirement provisions to increase in 2010 and beyond
- Already, the high prevalence of hold until / transfer at retirement provisions is notable
Pay Practices | Non-Executive Board Leadership (additional compensation)
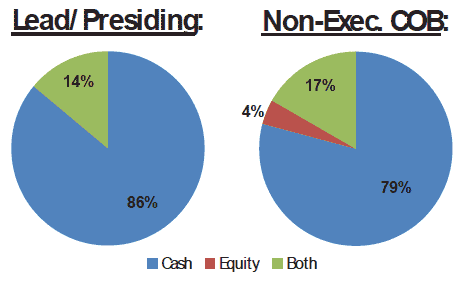
Additional / premium retainers for independent Board leadership roles are most often delivered through additional cash compensation.
CAP Observation:
- We expect cash to continue to be the dominant vehicle for delivering additional compensation for serving in an independent Board leadership role, with the possibility for an increase in equity-based compensation in coming years
Other Program Design Considerations
- Total Company Cost (of Board oversight)
- Board Membership and Meetings
- Committee Membership and Meetings
- Stock Ownership Guidelines (requirements)
- Benefits and Perquisites
Other Program Design Considerations | Total Company Cost (of Board oversight)
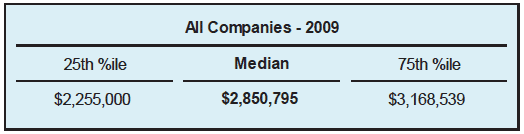
Total Company Cost can be a useful secondary reference point when reviewing non-employee director compensation.
- Includes the sum of cash retainers, equity awards, committee fees, and Board leadership fees received by each non-employee director
CAP Observation:
- Generally, the cost of Board oversight drops as the size of an organization increases, measured as a percent of revenue
Other Program Design Considerations | Board Membership and Meetings
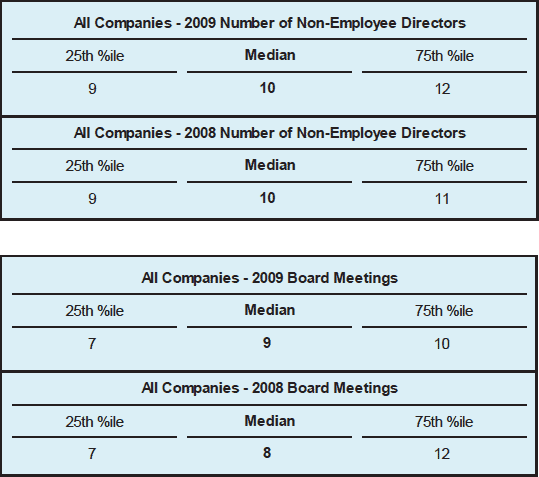
Between 2008 and 2009, at median, the size of Boards remained constant; however, Board activity marginally increased based on median number of meetings.
CAP Observation:
- Over the past decade, the typical size of a Board shrunk, in part based on new proxy disclosure requirements; i.e., increased discussion of qualifications, required discussion of any director attending less than 75 percent of meetings, etc.
- As the year-over-year data shows, the size of Boards seems to have stabilized
- Currently, the size of Boards is manageable
- Work loads have generally been increasing
- It is typical for all directors to be take part in Board work / activities / decision making
Other Program Design Considerations | Committee Membership and Meetings
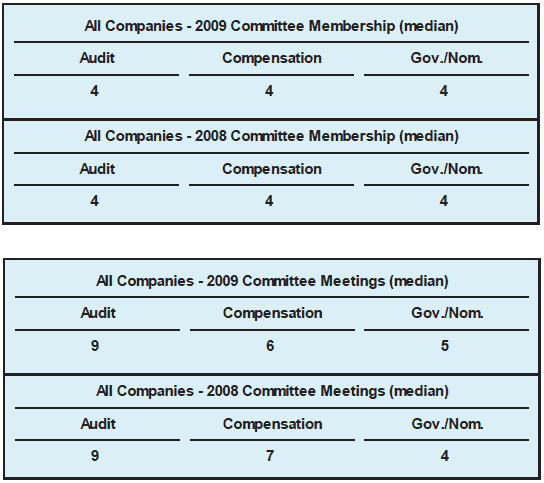
Across the 3 major committees, membership / size is consistent; however, activity based on median number of meetings is not consistent, with the Audit Committee being the most active.
CAP Observation:
- An increasing amount of work is being done outside of official committee meetings, and not all meetings are created equal (in terms of time spent, topics covered, etc.)
- Therefore, we find that number of meetings is only one component of judging total committee activity / time commitment / workload
Other Program Design Considerations | Stock Ownership Guidelines (requirements)
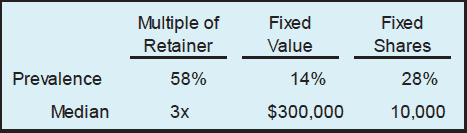
Nearly 90 percent of companies studied have stock ownership guidelines, and nearly 80 percent of companies studied have formal stock ownership guidelines.
- Formal stock ownership guidelines reflect requirements stated as either: (i) a multiple of the annual Board cash retainer, the annual Board equity retainer, or both; (ii) a fixed value; or (iii) a fixed number of shares
- Most often, formal stock ownership guidelines are defined as a multiple of the annual cash retainer
- Most companies with formal stock ownership guidelines require non-employee directors to meet the ownership hurdle within 5 years of joining the Board; the next most common period is 3 years
- Non-formal stock ownership guidelines reflect retention ratios and equity awards that are held/deferred until retirement
- The number of companies with retention ratios and/or deferring equity awards until retirement, in addition to formal stock ownership guidelines, has been increasing
CAP Observation:
- Due to volatility, some companies that use either a fixed value-based or fixed share-based formal stock ownership guideline have been implementing an either or approach; either a certain dollar value or a certain number of shares must be owned within a certain number of years
- Other design features that can alleviate the volatility issue are the idea of ownership value vs. investment value and measuring stock price over an extended period of time, rather than at fiscal year-end
- ISS (formerly RiskMetrics Group), regarding non-omnibus director-specific equity plans, expects a minimum ownership multiple of 3 times the annual retainer to be achieved within 5 years of joining a Board
Other Program Design Considerations | Benefits and Perquisites
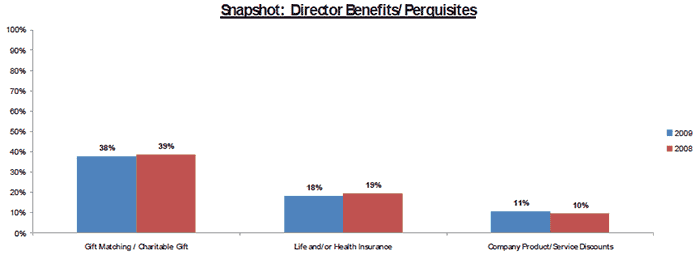
While there was a small decrease in the prevalence of certain director benefit / perquisites (below) over the past year, during both 2009 and 2008 about two thirds of companies studied provided directors with some form of benefit /perquisite.
CAP Observation:
- Many companies have reduced or eliminated perquisites and benefit programs for outside directors, similar to their executives
- We expect that both the prevalence and value of benefits and perquisites will continue to decline; however, where a business case exits, some perquisites / benefits will be maintained
Appendix
- Board Member Total Compensation (industry medians)
- Methodology
- Public Fortune 100 Companies
- Company Profile
Appendix | Board Member Total Compensation (industry medians)
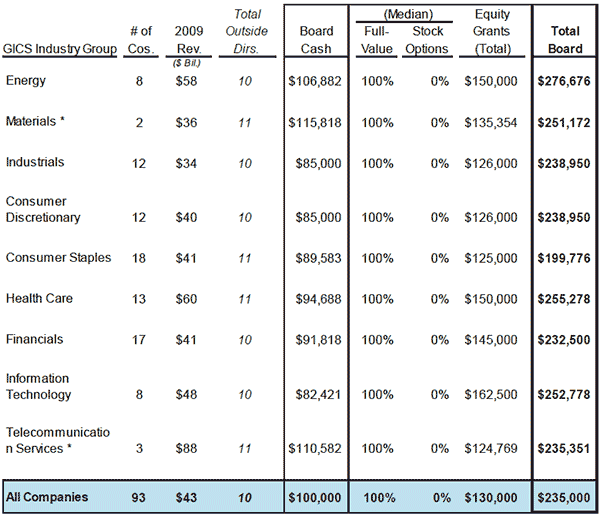
Pay levels and practices were also reviewed, and differ somewhat, by industry.
Appendix | Methodology
- It was assumed that every director served on the Board for the entire year and attended all meetings
- Meeting fees were calculated based on the actual number of meetings held
- Annual equity awards were assumed to have occurred on the annual meeting date; stock options were valued based on the FASB Topic 718 (FAS 123R) Black-Scholes value
- Initial at-election equity awards were annualized over 5 years
- Committee compensation includes all Board committees, reflecting actual committee assignments
- If the proxy statement disclosed forward-looking information regarding changes to the compensation structure, the most recent data was used
Appendix | Public Fortune 100 Companies
Company Names & Industry
- IndustryAbbott Laboratories (H/C)
- Costco Wholesale Corporation (C/S)
- Intel Corporation (I/T)
- Prudential Financial, Inc. (F)
- Aetna Inc. (H/C)
- CVS Caremark Corporation (C/S)
- International Assets Holding Corporation (F)
- Publix Super Markets, Inc. (C/S)
- Allstate Corporation, The (F)
- Dell Inc. (I/T)
- International Business Machines Corporation (I/T)
- Raytheon Company (I)
- Amazon.com, Inc. (C/D)
- Delta Air Lines, Inc. (I)
- Johnson & Johnson (H/C)
- Rite Aid Corporation (C/S)
- American Express Company (F)
- Dow Chemical Company, The (M)
- Johnson Controls, Inc. (C/D)
- Safeway Inc. (C/S)
- American International Group, Inc. (F)
- E. I. du Pont de Nemours and Company (M)
- JPMorgan Chase & Co. (F)
- Sears Holdings Corporation (C/D)
- AmerisourceBergen Corporation (H/C)
- Enterprise GP Holdings L.P. (E)
- Kraft Foods Inc. (C/S)
- Sprint Nextel Corporation (T/S)
- Apple Inc. (I/T)
- Express Scripts, Inc. (H/C)
- Kroger Co., The (C/S)
- Sunoco, Inc. (E)
- Archer-Daniels-Midland Company (C/S)
- Exxon Mobil Corporation (E)
- Lockheed Martin Corporation (I)
- SUPERVALU Inc. (C/S)
- AT&T Inc. (T/S)
- Federal Home Loan Mortgage Corporation, The (F)
- Lowe’s Companies, Inc. (C/D)
- Sysco Corporation (C/S)
- Bank of America Corporation (F)
- Federal National Mortgage Association, The (F)
- Marathon Oil Corporation (E)
- Target Corporation (C/D)
- Berkshire Hathaway, Inc. (F)
- FedEx Corp. (I)
- McKesson Corporation (H/C)
- Time Warner Inc. (C/D)
- Best Buy Co., Inc. (C/D)
- Ford Motor Company (C/D)
- Medco Health Solutions, Inc. (H/C)
- Travelers Companies, Inc., The (F)
- Boeing Company, The (I)
- General Dynamics Corporation (I)
- Merck & Co., Inc. (H/C)
- Tyson Foods, Inc. (C/S)
- Cardinal Health, Inc. (H/C)
- General Electric Company (I)
- MetLife, Inc. (F)
- United Parcel Service, Inc. (I)
- Caterpillar Inc. (I)
- Goldman Sachs Group, Inc., The (F)
- Microsoft Corporation (I/T)
- United Technologies Corporation (I)
- Chevron Corporation (E)
- Hartford Financial Services (F)
- Morgan Stanley (F)
- UnitedHealth Group Incorporated (H/C)
- CHS Inc. (C/S)
- Hess Corporation (E)
- News Corporation (C/D)
- Valero Energy Corporation (E)
- Cisco Systems, Inc. (I/T)
- Hewlett-Packard Company (I/T)
- Northrop Grumman Corporation (I)
- Verizon Communications Inc. (T/S)
- Citigroup Inc. (F)
- Home Depot, Inc., The (C/D)
- PepsiCo, Inc. (C/S)
- Walgreen Company (C/S)
- Coca-Cola Company, The (C/S)
- Honeywell International Inc. (I)
- Pfizer Inc. (H/C)
- Wal-Mart Stores, Inc. (C/S)
- Comcast Corporation (C/D)
- Humana Inc. (H/C)
- Philip Morris International Inc. (C/S)
- Walt Disney Company, The (C/D)
- ConocoPhillips (E)
- Ingram Micro Inc. (I/T)
- Procter & Gamble Company, The (C/S)
- WellPoint Inc. (H/C)
- Wells Fargo & Company (F)
Key
- Energy (E)
- Materials (M)
- Industrials (I)
- Consumer Discretionary (C/D)
- Consumer Staples (C/S)
- Health Care (H/C)
- Financials (F)
- Information Technology (I/T)
- Telecommunication Services (T/S)
Appendix | Company Profile
Compensation Advisory Partners LLC (CAP) is an independent consulting firm specializing in executive and director compensation, and related corporate governance matters, with a unique combination of deep expertise and intense client focus. Comprised of senior industry veterans from Mercer and KPMG, CAP’s consultants have served as independent advisor to Boards and senior management at many of the world’s largest and leading companies in the areas of compensation governance, strategy and program design.
- Formed in 2009, CAP’s founding principle is that compensation should be a management tool to help support business strategy. Our consulting experience enables our team to assist companies in creating and implementing defensible, performance-oriented executive compensation programs that meet high governance standards in a changing regulatory environment
- The staff has strong industry sector knowledge and a broad client base, ranging from the largest Fortune 100 multi-nationals to start-up companies across all major industries
- The firm’s breadth of experience and clientele keep it at the forefront of trends and practices in all areas of executive and director compensation
- Compensation Advisory Partners provides Boards of Directors and Compensation Committees best-in-class advice, while also meeting the increasing need to demonstrate the independence and objectivity of that advice from a truly independent platform
- Please contact us at 212-921-9350 if you would like to discuss your own executive or director compensation issues. You can also access our website at www.capartners.com for more information
[1]Sum of cash retainer, total Board meeting fees and average committee member compensation.
[2] Total Board Cash Compensation includes committee member compensation (but excludes additional/premium meeting fees or retainers paid for chairing a committee) as the trend is towards companies building fees for basic committee service into annual Board fees/retainers. Further, committee member compensation is typically cash-based.
[3] Nearly 75 percent of companies studied allow directors the option of exchanging their cash retainer for additional equity-based compensation; this refers to a voluntary value-for-value exchange/deferral, and does not reflect any premium.
[4] Reflects both annual equity awards and initial at-election equity awards.
[5] Reflects both annual equity awards and initial at-election equity awards.
[6] Prevalence at companies with formal stock ownership guidelines.
[7] Due to limited number of companies, data/value reflects an average rather than a median.