Compensation Advisory Partners (CAP) reviewed executive compensation pay levels and trends at 50 companies (Early Filers) that filed their most recent proxy statement between November 2017 and January 2018 (fiscal year ends from July 2017 to October 2017; 35 companies have September 30 fiscal year ends). Industry sectors reviewed include: Consumer Discretionary, Consumer Staples, Financials, Health Care, Industrials, Information Technology and Materials. Among these 50 companies, median Revenue was $7.5B, median Market Capitalization (based on each company’s fiscal year-end) was $13.0B and 1-year Total Shareholder Return, or TSR (based on each company’s fiscal year-end) was 19.3%.
Overall Findings
Performance: 2017 performance (based on Revenue growth, EBIT growth, EPS growth and 1-year TSR) was strong. Revenue and EBIT grew by approximately 6%, EPS was up 4% and TSR was up nearly 20% vs. prior year.
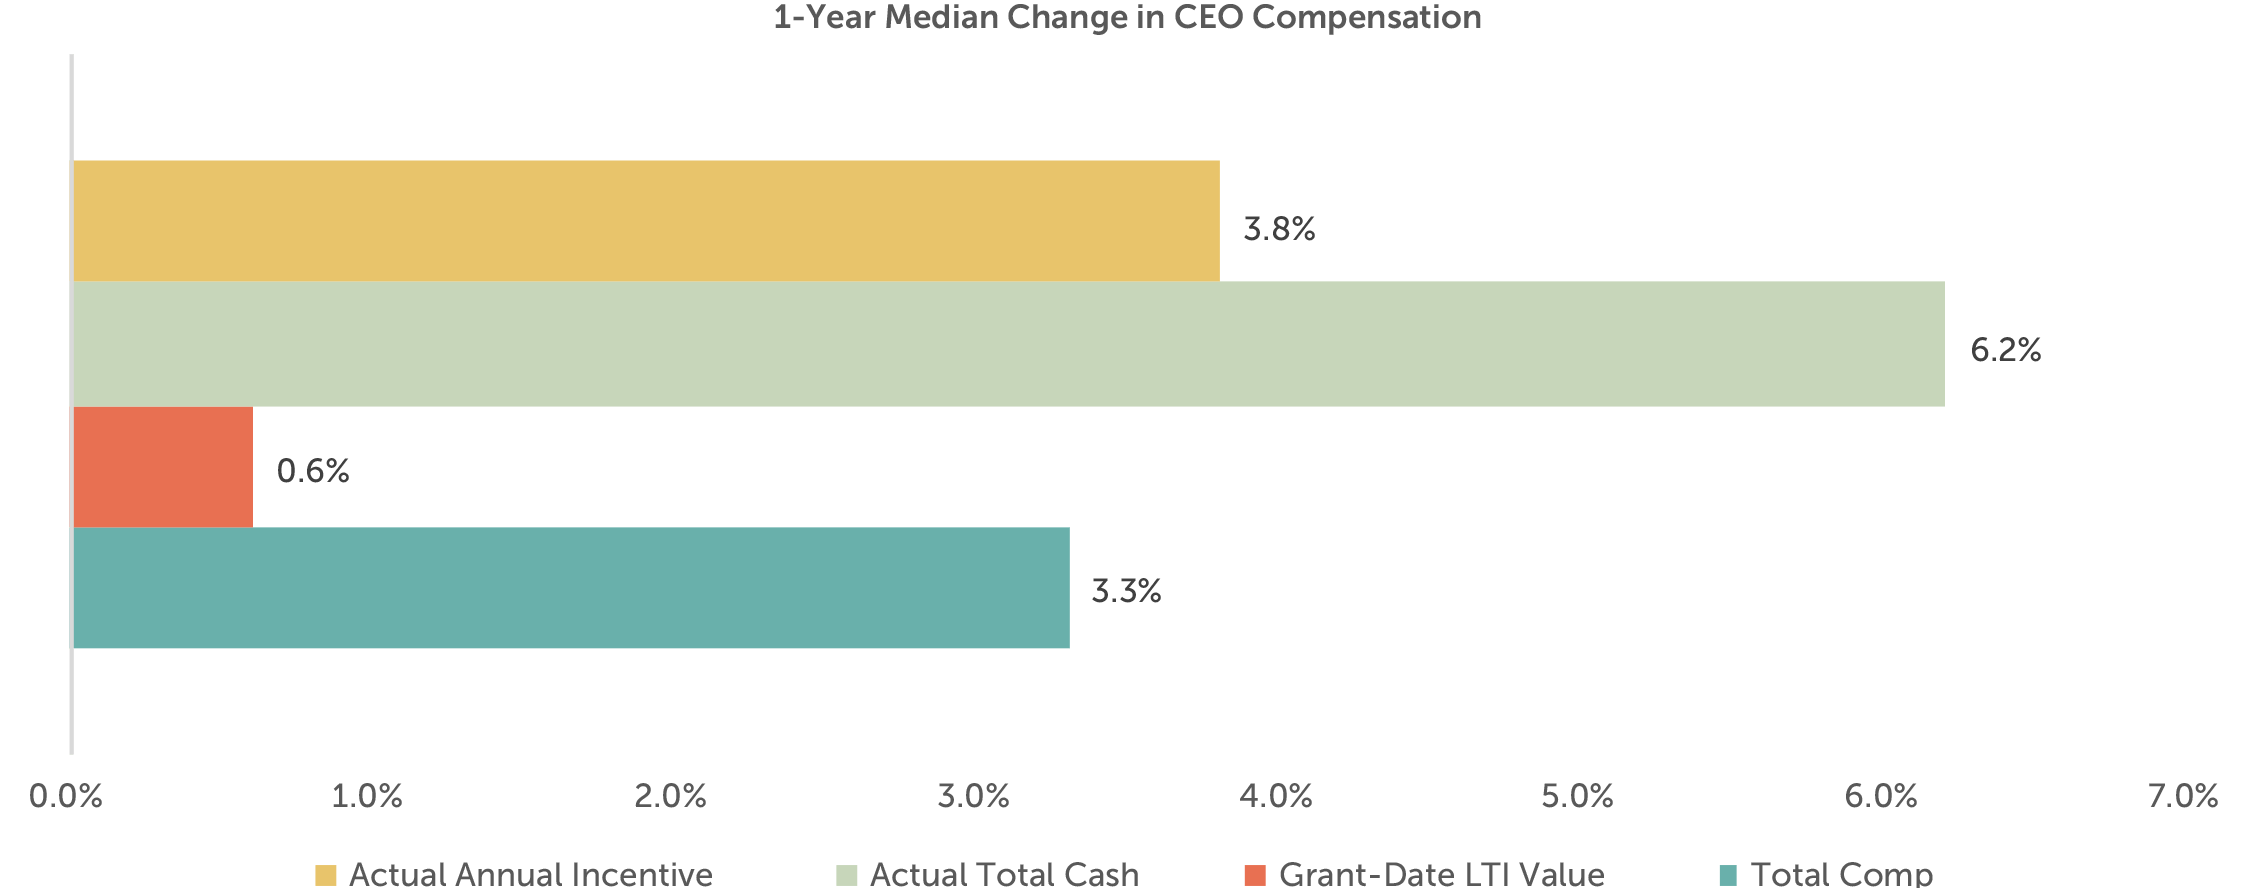
CEO Pay: Median CEO pay increased slightly by 3.3% mainly driven by actual annual incentive payouts. The grant date value of long-term incentives (LTI) was generally flat.
Annual Incentive Payout: Overall, the median 2017 annual incentive payout was 115% of target, reflective of strong financial performance.
2017 Performance
CAP reviewed Revenue growth, EBIT growth, EPS growth and TSR performance for the Early Filer and the S&P 500 companies. Overall, 2017 median performance for Early Filers was strong. Revenue and EBIT grew approximately 6%, EPS grew around 4% and TSR was up nearly 20%. TSR among the Early Filers showed double-digit growth for the second year in a row; this growth is due to strong financial performance as well as market expectations around tax reform in light of the current political climate.
| Financial Metric (1) | 2016 Median 1-year Performance | 2017 Median 1-year Performance | ||
| S&P 500 | Early Filers | S&P 500 | Early Filers | |
| Revenue Growth | 2.1% | 2.0% | 6.3% | 5.7% |
| EBIT Growth | 2.2% | 7.6% | 6.6% | 6.0% |
| EPS Growth | 4.2% | 5.2% | 9.9% | 3.9% |
| TSR | 3.3% | 18.4% | 17.0% | 19.3% |
(1) TSR and Financial performance for the S&P 500 is as of September 30, 2016 and September 30, 2017. Financial performance and TSR for Early Filers is as of each company’s fiscal year end.
CEO Total Direct Compensation
Among Early Filers with CEOs in their role for at least two years (n=39), median total direct compensation increased 3.3%. This increase was mainly due to higher actual annual incentive payouts in 2017; the grant-date value of LTI was generally flat year over year. Actual annual incentive payout was up nearly 4% reflective of strong financial performance while LTI, the largest component of CEO pay, was up only 1%. Median base salary for CEOs in our sample was unchanged from 2016.
Annual Incentive Plan Payout
The median actual annual incentive payout in 2017 was 115% of target, higher than the median payout in 2016 of 106% of target. In fact, the 25th percentile bonus payout in 2017 was at target, noticeably higher than last year (86% of target).
| Summary Statistics | Annual Incentive Payout as a % of Target | ||
| 2015 | 2016 | 2017 | |
| 75th Percentile | 134% | 141% | 147% |
| Median | 106% | 106% | 115% |
| 25th Percentile | 97% | 86% | 100% |
Performance for companies with at or above target annual incentive payouts was substantially stronger than that of companies with below target payouts. Companies with payouts at or above target had strong EPS (10.9%) and TSR (23.2%) growth and solid Revenue (6.3%) and EBIT (7.2%) growth. Performance for companies with below target payouts was flat or declining from prior year.
| Financial Metric (1) | 2016 Median 1-year Performance | 2017 Median 1-year Performance | ||
| Below target payout (n=21) | At/above target payout (n=29) | Below target payout (n=12) | At/above target payout (n=38) | |
| Revenue Growth | (0.7%) | 3.0% | 2.1% | 6.3% |
| EBIT Growth | (2.8%) | 15.9% | 1.0% | 7.2% |
| EPS Growth | (3.9%) | 16.9% | (4.3%) | 10.9% |
| TSR | 16.9% | 19.6% | (3.9%) | 23.2% |
(1) Financial performance and TSR is as of each company’s fiscal year end.
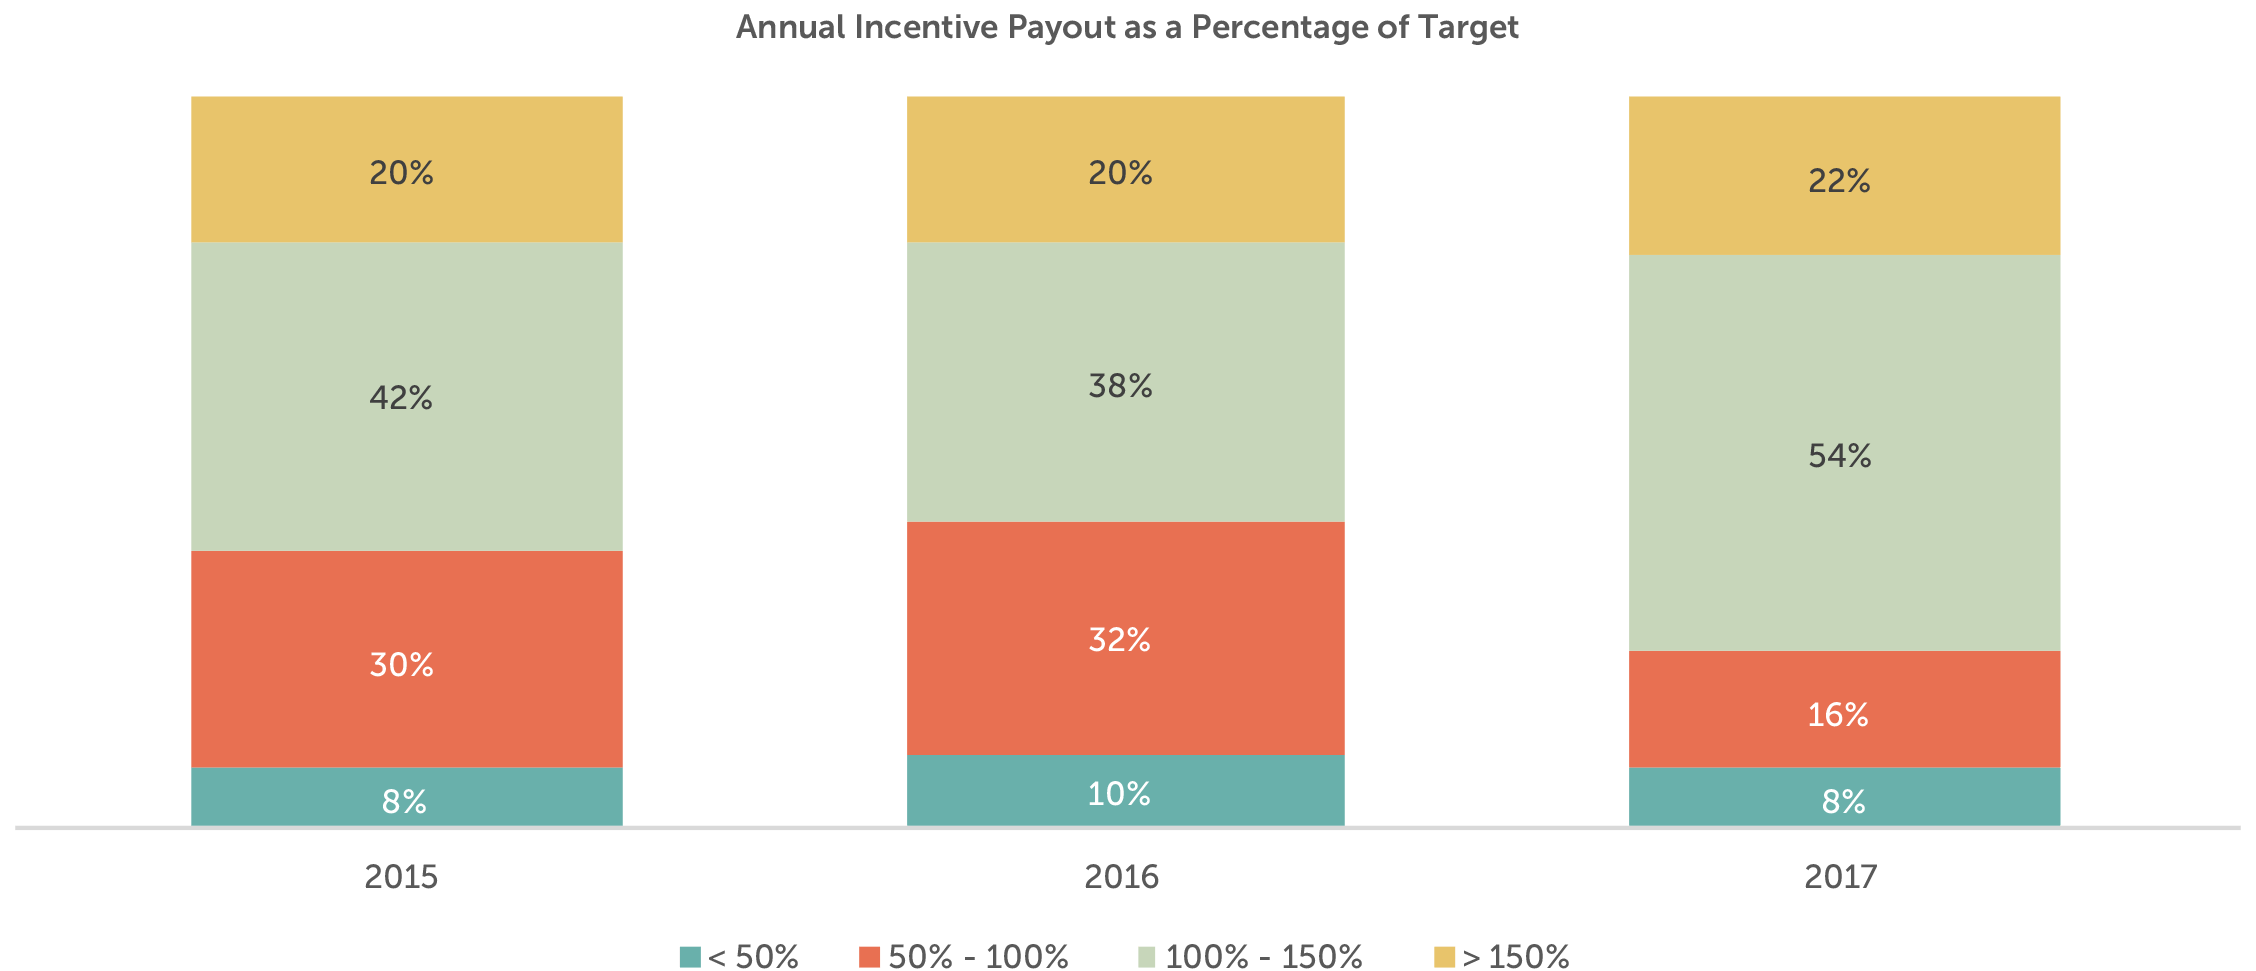
76% of companies in 2017 provided a payout at or above target which is considerably higher than 2016 and 2015 (58% and 62%, respectively). In 2017, significantly more companies provided a payout between 100 – 150% of target than below target. This distribution is more evenly split in prior years. The distribution of payouts in 2017 aligns with stronger overall performance than 2016 and 2015.
Incentive Plan Design
Among Early Filers, 75% of companies use 2 – 3 financial metrics in the annual incentive plan and nearly 83% use 1 – 2 measures in the LTI plan. Metrics in the annual incentive plan typically focus on growth and profitability, while LTI plans are more likely to reward executives based on profits, return measures or stock price performance. A growing number of companies are beginning to use non-financial strategic goals, primarily diversity and inclusion and creating a more engaged workforce, in the annual incentive plan design. With the recent amendment to 162(m) due to the Tax Cuts and Jobs Act, we anticipate more companies will use strategic measures and individual objectives to reward executives in the future.
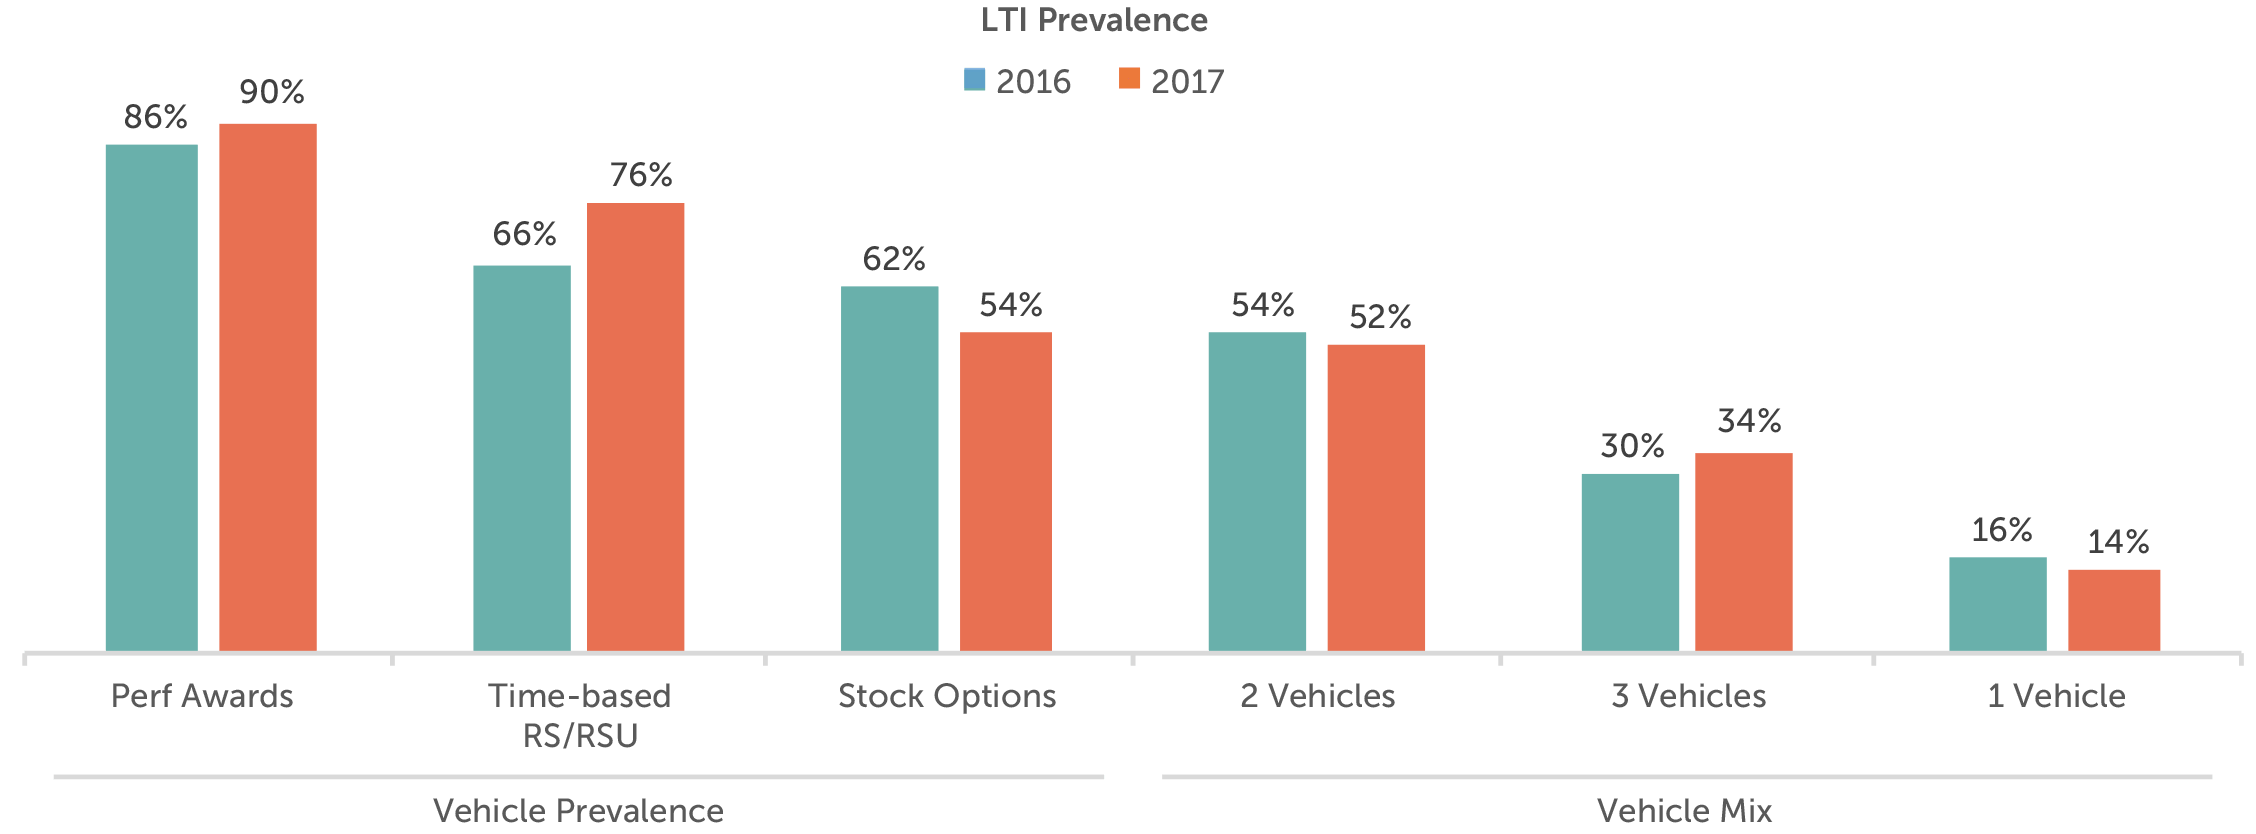
As performance-based compensation continues to be championed by both shareholders and proxy advisory firms, the use of performance-based LTI continues to be very prevalent. Performance plan usage remains high, at 90% of Early Filers. Option use declined among the Early Filers (54% down from 62%) and shifted to use of restricted stock.
TSR continues to be the most prevalent LTI metric, with approximately 60% of companies using a performance-based plan with this metric. Of the companies that use TSR, 25% use it as a modifier, 50% use it as a stand-alone metric in conjunction with a financial measure and 25% use it as the sole measure. The prevalence of TSR as the sole measure has decreased somewhat over the last several years as companies use a balanced approach to reward executives for long-term financial and stock price results. We anticipate its usage as a sole measure to plateau or continue to decline particularly given ISS’ recent shift towards the use of other financial measures in its quantitative pay for performance assessment (ISS and Glass Lewis Policy for the 2018 Proxy Season).
Governance Practices
Over the last decade, many companies adopted good governance practices. Increased scrutiny from shareholders and proxy advisory firms has quickened the pace with which companies incorporated clawback, or recoupment, policies as well as hedging and pledging policies. It is no surprise that more than 90% of companies in our sample have a clawback policy in place. 85% of companies also have implemented hedging and pledging policies for their executives.
Nearly all companies (96%) in our sample have stock ownership guidelines in place; these guidelines encourage executives to hold a meaningful equity stake and align with shareholder interests. The guideline is most commonly expressed as a multiple of salary, with a median CEO multiple of 5x base salary and other NEOs with a multiple of 3x base salary. About one-third of companies also require executives to hold stock (typically 50 – 100% of net shares received) until stock ownership guidelines are met. It is less common for companies to require executives to hold shares for a period of time (e.g., 1 year) in lieu of stock ownership guidelines. Good governance practices continue to be a focus of shareholders, and companies are routinely implementing and updating policies as appropriate in the current regulatory environment.
Conclusion
2017 was a year of strong financial performance for the Early Filers, which resulted in above target annual incentive payouts for approximately 75% of companies. CEO actual total cash compensation increased by 6%, and when combined with generally flat LTI award values, total pay increased by 3%.
2018 will be the first performance year after the passage of tax reform. We do not expect companies to unwind their use of performance-based pay and good governance practices, yet we foresee greater use of individual and strategic performance measures, along with increased use of discretionary pay decisions, in moderation.
For questions or more information, please contact:
Lauren Peek Principal
[email protected] 212-921-9374
Joanna Czyzewski Associate
[email protected] 646-486-9746
Melissa Burek Partner
[email protected] 212-921-9354
Each year CAP analyzes non-employee director compensation programs among the 100 largest companies. We believe these companies provide insight into where the market will be going in terms of practices. This report is a summary of trends – for pay levels and pay practices – based on 2017 proxy filings.
CAP Findings
Board Compensation pay levels increased modestly
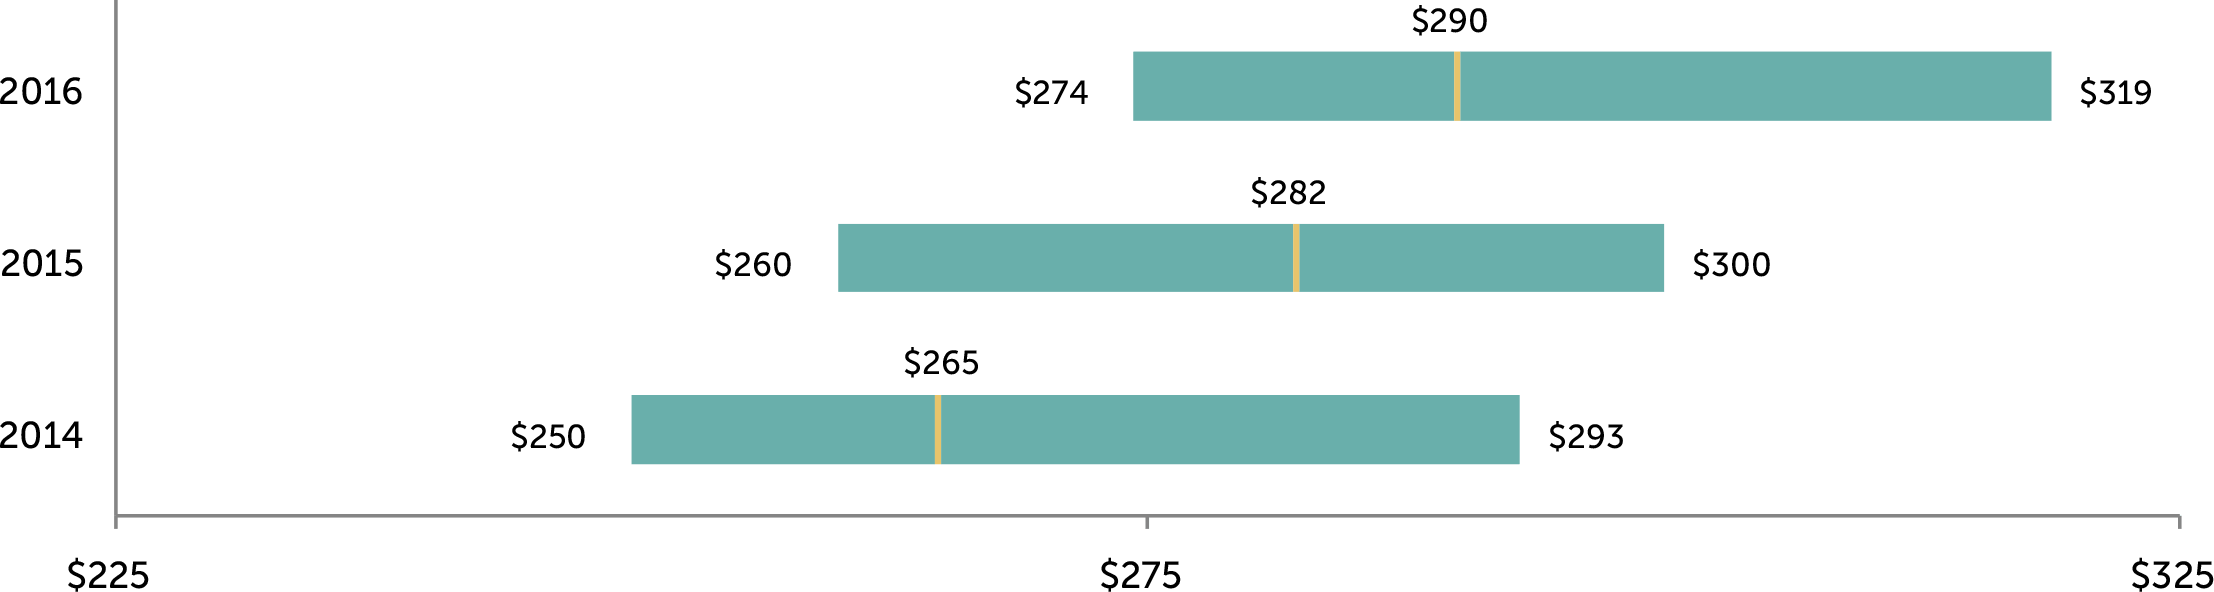
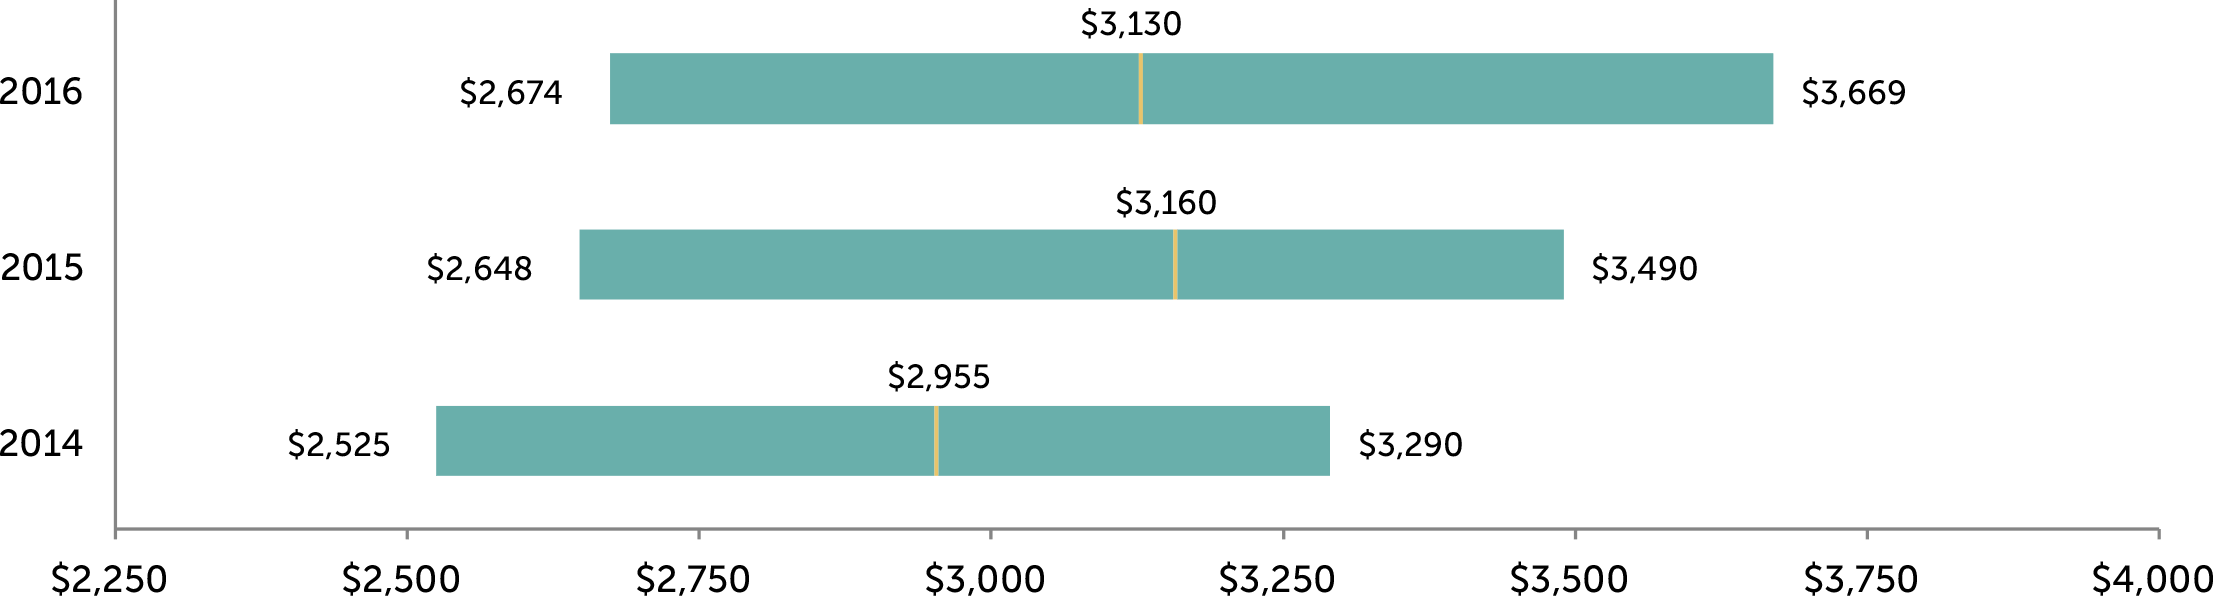
- Total Fees. Increased 3 percent (median is $290K, versus $282K in prior year); board compensation has reached a steady state, and low single digit increases have been and are expected to continue to be the norm.
- Retainers. Large companies rely on annual retainers (cash and equity) to compensate directors. Pay programs are typically simple and tend to rely less on meeting fees or committee member retainers.
- Meeting Fees. Paid by only 11 percent of companies, consistent with prior year. In general, companies have moved to a fixed retainer pay structure, with a component in cash and a component in equity. We support this approach as it simplifies administration and eliminates the need to define “what counts as a meeting.” However, companies may want to consider having a mechanism for paying meeting fees if the number of meetings in a single year far exceeds the norm (“hybrid approach”). Five companies in our dataset used this approach to meeting fees, with the threshold ranging between 6 and 10 meetings.
- Equity. Full-value awards (shares/units) are most common; only 7 percent of companies used stock options. 97 percent of companies denominated equity awards as a fixed value, versus a fixed number of shares, which is considered best practice as it manages the value awarded each year. Approximately two-thirds of equity awards vest within 1 year of grant (either immediately or cliff vest after 1 year).
- Pay Mix. On average, 61 percent equity-based and 39 percent cash-based, consistent with prior year. Alignment with long-term shareholders is reinforced by delivering a majority of board compensation in equity.
Committee Member Compensation little/no change
- Overall Prevalence. Half of companies paid committee-specific member fees for Audit Committee service and approximately one-third of companies paid member fees for Compensation or Nominating/Governance Committee service. The majority of companies rely on board-level compensation to recognize committee service, with the general expectation that all independent directors contribute to committee service needs1.
- Total Fees. Of the companies that paid committee member compensation, the median was $17.8K.
Committee Chair Compensation higher Audit Chair premium
- Overall Prevalence. More than 90 percent of companies provided additional compensation to committee Chairs, typically through an additional retainer and not meeting fees, to recognize additional time requirements, responsibilities, and reputational risk.
- Fees. Median additional compensation for Audit Committee Chairs increased to $25K from $20K last year. Median additional compensation for Compensation and Nominating/Governance Committee Chairs was $20K and $15K, respectively, consistent with prior year.
Independent Board Leader Compensation higher Lead Director premiums
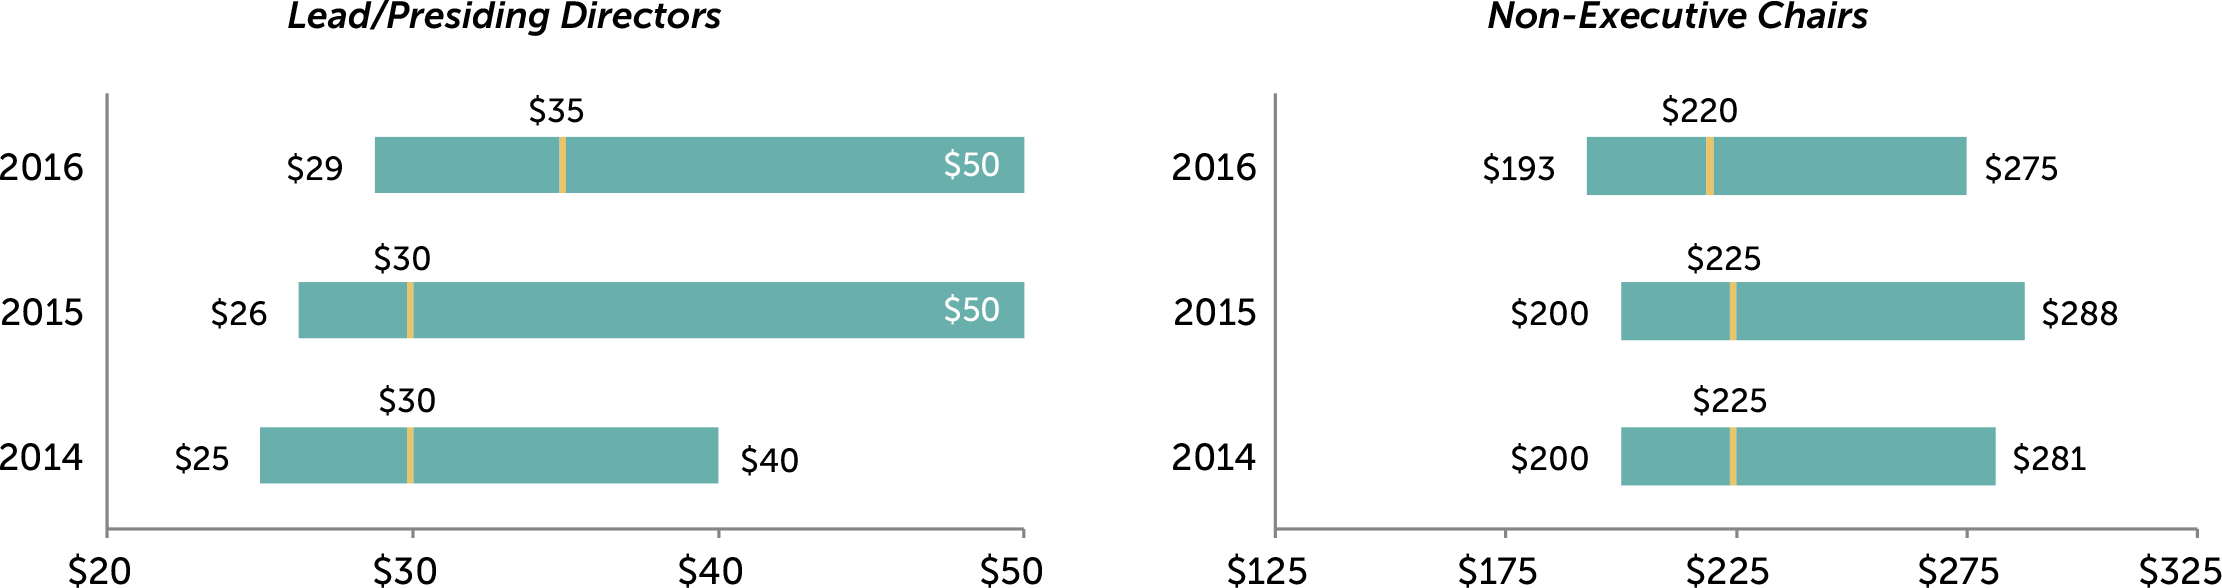
- Non-Exec Chair. Additional compensation is provided by all companies with this role, $220K at median. As a multiple of total Board Compensation, total Board Chair pay is 1.83x a standard Board member, at median.
- Lead Director. Median additional compensation increased to $35K, up from $30K in the prior year. Additional compensation is provided by nearly all companies with this role2. The differential in pay versus non-executive Chairs is in line with typical differences in responsibilities.
Pay Limits prevalence of limits continues to go up
- Similar to last year, a majority of companies (55%) that amended or adopted an equity plan in 2017 – that did not already have a limit in place – implemented an award limit for director compensation.
- In total, 47 percent of the largest 100 companies now have such limits, up from 39 percent in the prior year.
- Limits range from $250K to $4.7 million, with the median limit being at $750K. Companies that denominate the limit in shares tend to have a higher dollar-equivalent limit, with a median of $1M. The median for the companies with value-based limits is $600K.
Limit Range Prevalence <= $500,000 28% $500,001 – $1,000,000 55% $1,000,001 – $2,000,000 13% > $2,000,001 4% - The limits tend to be much higher than annual equity grants. Approximately 72% of limits are greater than 3x the annual equity grants.
Limit Multiple Range Prevalence <= 3x annual equity 28% 3.01x – 5x annual equity 36% 5.01x – 7x annual equity 25% > 5x annual equity 11% - Limits typically apply to just equity-based compensation; however, some companies have applied the limits to both cash and equity-based compensation (i.e., total pay) and we anticipate the prevalence of this practice will increase further. Other companies exclude initial at-election equity awards, committee Chair pay, and/or additional pay for Board leadership roles from the limit.
- The limits are largely due to advancement of litigation where the issue has been that directors approve their own annual compensation and are therefore deemed to be inherently conflicted.
Appendix

Total Board Compensation ($000s)3
Additional Compensation for Independent Board Leaders ($000s)
Total Company Cost for Board Service ($000s)
1 Audit, Compensation and/or Nominating and Governance committees.
2 Excludes controlled companies. Also excludes instances where Lead Director role is assumed by Chair of Nominating and Governance Committee, who receives compensation for the role.
3 Total Board Compensation reflects all cash and equity compensation for Board and committee service, excluding compensation for leadership roles such as committee Chair, Lead/Presiding Director, or non-executive Board Chair.
On a panel of leading executive compensation experts, Margaret Engel discusses some of the top executive compensation issues and trends including: the current public mistrust of executive compensation programs, the importance and the rigorous process of target goal setting, the challenges that many companies face with long-term performance awards, and the likely increase in the use of performance-based stock options in the future.
Certain compensation practices can have a potentially damaging effect on a company’s reputation, which makes determining what constitutes fair director pay no easy task. Daniel Laddin, founding partner of Compensation Advisory Partners, and Martin M. Coyne, II, Chairman and CEO of NACD’s New Jersey Chapter, offer their insights on today’s most critical compensation issues.
Each year CAP analyzes non-employee director compensation programs among the 100 largest companies. We believe these companies provide insight into where the market will be going in terms of practices. Below is a summary of trends – for pay levels and pay practices – based on 2016 proxy filings.
Key CAP Findings
Board Compensation. pay levels went up
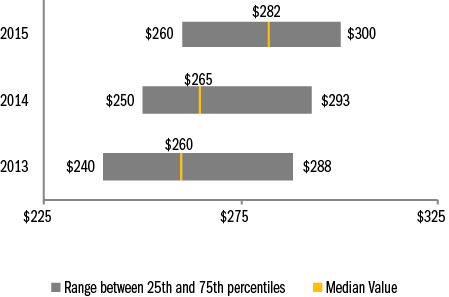
- Total Fees. Increased 6 percent (median is $282K, versus $265K in prior year), which is the biggest single year increase we have seen in more than 4 years, though still within historic norms
- Retainers. Large companies rely on annual retainers (cash and equity) to compensate directors. Pay programs are typically simple and viewed more as an “advisory fee” than an “attendance fee.”
- Meeting fees. Provided by only 11 percent of companies (versus 12 percent in prior year). In general, companies have moved to a fixed retainer pay structure, with a component in cash and a component in equity. We support this approach as it simplifies administration and the need to define “what counts as a meeting.” However, companies may want to consider having a mechanism for paying meeting fees if the number of meetings in a single year far exceeds the norm. For example, if the number of meetings is well above historic norms (e.g., 12 meetings/year), companies could consider paying meeting fees above a specified number of meetings. Three companies in our dataset use this approach to meeting fees.
- Equity. Full-value awards (shares/units) are most common. Only 8 percent of companies use stock options with, surprisingly, only one of these companies being in the traditional technology sector. 97 percent of companies denominate equity awards (stock or options) as a fixed value, versus a fixed number of shares, which is considered best practice as it manages the value each year. Approximately two-thirds of equity awards vest within 1 year of grant (either immediately or cliff vest after 1 year). Nearly 60 percent of equity awards settle at vest, with the remainder settling at or post retirement.
- Pay Mix. On average, 61 percent equity-based versus 39 percent cash-based. Alignment with long-term shareholders is reinforced by delivering a majority of compensation in equity.
Committee Member Compensation. little/no change
- Overall Prevalence. Only 48% of companies paid committee-specific member fees, relying on board-level compensation to recognize committee service, with the general expectation being that all independent directors contribute to committee service needs1.
- Total Fees. Of the companies that pay committee member compensation, the median is $16.8K.
Committee Chair Compensation. little/no change
- Overall Prevalence. Approximately 90 percent of companies provide additional compensation to committee Chairs, typically through an additional retainer and not meeting fees, to recognize additional time requirements, responsibilities, and reputational risk1.
- Fees. At median, $20K in additional compensation (vs. members) was provided to Audit and Compensation Committee Chairs, and $15K additional to Nominating/Governance Committee Chairs.
Independent Board Leader Compensation. little/no change
- Non-Exec Chair. Additional compensation is provided by all companies with this role, $225K at median. As a multiple of total Board Compensation, total Board Chair pay is 1.9x a standard Board member, at median.
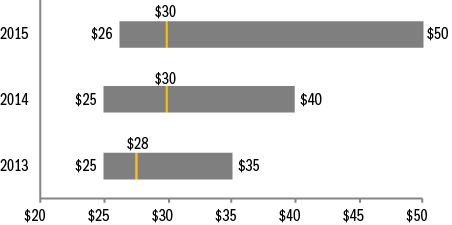
- Lead Director. Additional compensation – $30K, at median – is provided by nearly all companies with this role3. The differential in pay versus non-executive Chairs is in line with typical differences in responsibilities. 75th percentile additional compensation was $50K, up from $40K last year and up from $35K two years ago.
Pay Limits. prevalence of limits went up
- There were 17 companies in our data set that amended an equity plan this year; 2 of these companies already had a shareholder approved limit in place for director compensation. Among the remaining 15 companies, 9 of them (60 percent) implemented a new shareholder approved limit for director compensation.
- In total, 39 percent of the largest 100 companies now have such limits, up from 27 percent in prior year.
- Limits range from $250K to $3.6 million, and were $760K at median. Among companies that denominate the limit in shares, the median is $1.05M, while the median for the companies with value-based limits is $525K.
- Limits typically apply to just equity-based compensation; however, some companies have applied the limits to both cash and equity-based compensation (i.e., total pay) and we anticipate the prevalence of this practice will increase further. Other companies exclude initial at-election equity awards, committee Chair pay, and/or additional pay for Board leadership roles from the limit.
- The limits are largely due to advancement of litigation where the issue has been that directors approve their own annual compensation and are therefore inherently conflicted. Companies have a stronger legal defense – protecting them under the business judgement rule – by having “meaningful limits” approved by shareholders on the maximum award that could be granted to a director. The “business judgment rule” is judicial presumption that directors acted “on an informed basis, in good faith and in the honest belief that the action taken was in the best interests of the company.” An action protected by the business judgment rule will not be second-guessed by the courts. There is a chance that the business judgement rule can be called into question without a meaningful limit. When the business judgment rule does not protect directors’ awards of compensation to themselves, the awards are subject to heightened scrutiny under the “entire fairness test” under which both the process and the amount of the compensation must be found to be entirely fair to the company.
Appendix
Total Board Compensation ($000s)
Equity Compensation
|
Equity Vehicle |
2013 |
2014 |
2015 |
|
Full-Value Equity (Shares/Units) |
95% |
96% |
92% |
|
Stock Options |
2% |
1% |
1% |
|
Both |
3% |
3% |
7% |
|
Award Denomination |
2013 |
2014 |
2015 |
|
Fixed Valued |
88% |
90% |
92% |
|
Fixed Shares |
8% |
6% |
3% |
|
Both |
4% |
4% |
5% |
Additional Compensation for Independent Board Leaders ($000s)
Lead/Presiding Directors
Non-Executive Chairs
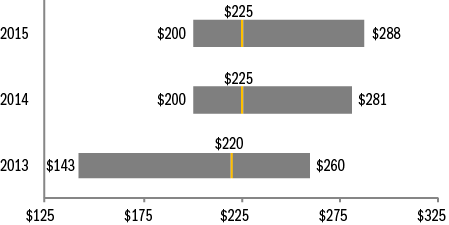
Total Company Cost for Board Service ($000s)
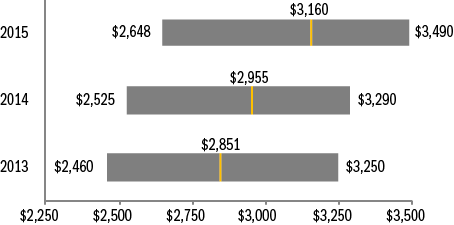
1 Audit, Compensation and/or Nominating and Governance committees.
2 Excludes controlled companies. Also excludes instances where Lead Director role is assumed by Chair of Nominating and Governance Committee, who receives compensation for the role.
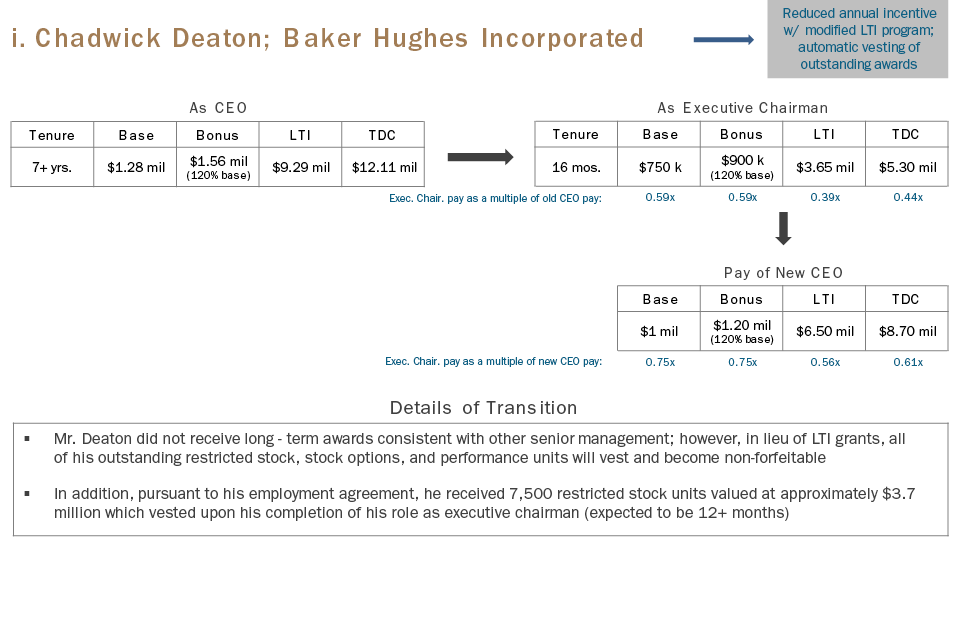
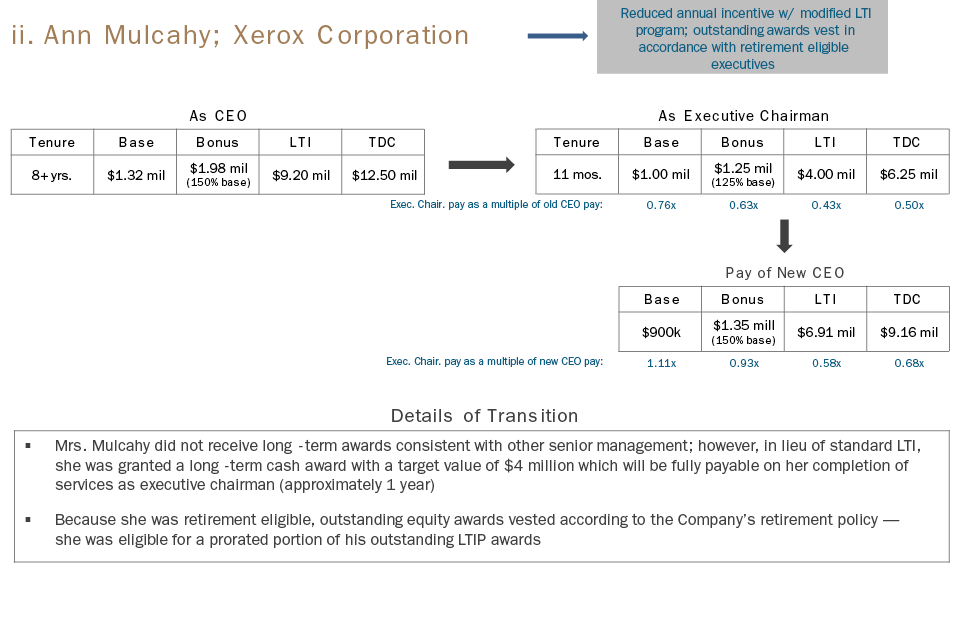
For many years, common practice in U.S. public companies has been to combine the roles of chief executive officer (“CEO”) and chairman of the board (“COB”), typically assigning the COB title and responsibilities to the sitting CEO. More recently, due to increased focus on governance and risk management, companies frequently separate the two roles. In some cases, companies will transition outgoing CEOs to the COB role. The duties of a separate COB can vary a great deal between companies, and expectations for the role as well as time served in the role will impact compensation. This review focuses primarily on the transition from CEO to COB and highlights compensation practices and factors influencing pay.
Prevalence of COB Role
Based on a review of companies ranging from $1 billion to $20 billion in revenue, we found that approximately 10% of companies operate with an Executive Chair and 45% have a Non-Executive Chair. Among the 10% with an Executive Chair, approximately one-half are founders (or have significant ownership in the company, i.e., more than 15% of shares outstanding), and the majority were former CEOs. This fact pattern is a very rational and effective progression, providing a smooth transition and advantages to the new CEO, shareholders, and the company’s overall operating efficiency. In the case of Non-Executive chairs, it is more common for the role to be filled from outside the company or by a member of the board of directors.
The need for and role of a separate COB evolves for different reasons. The responsibilities and time commitment of this role can vary greatly by company. Many founders step out of the CEO role to reduce their time commitment, but continue on as COB for many years so they can oversee the results of the company and weigh in on the company’s performance and strategy. Alternatively, the board may ask an exiting CEO to stay on for a year to help with the transition to a new CEO and provide continuity to the organization. It may be that an exiting CEO stays on to oversee a major initiative that needs dedicated oversight. The role could evolve as a result of a spin-off from an existing public entity. While difficult to generalize, there are certain duties that may be a part of any separate COB role such as executive coaching and mentoring, succession planning, and long-term strategy development. The COB is most often an advisory role, with no oversight of daily operations. These responsibilities dictate the planned timing of the role itself, be it short or long-term service in the position.
Overall Pay Levels and Pay Practices for Chairman Role
Pay Levels
While there is variation in pay practices that we discuss below, our research shows that the following pay practices, expressed as a relationship between compensation of the Executive COB and CEO roles.
Pay Summary Stats
|
Scenario (at Median) |
Base |
Bonus |
LTI |
TDC |
|
CEO Transition to Chairman |
||||
|
Chair Role Pay as a Percentage of Pay while Serving as CEO |
~100% |
~100% |
~40% |
~50% |
|
Chair Role Pay as a % of New CEO Pay |
95 – 105% |
85 – 95% |
55 – 65% |
65 – 75% |
|
Chairman that is founder/significant shareholder |
||||
|
Chair Role Pay as a % Current CEO Pay |
~90% |
~85% |
~25% |
~60 |
The background of the incumbent assuming the COB role may create some variations to pay levels and practices. For example, Executive Chairs that are founders/significant owners of their company make about 35% more, at median, than non-founder Executive COBs.
Pay Practices
We frequently see the following pay practices:
- Since many COBs have transitioned from the CEO role and have accumulated a large equity stake, or are founders with significant equity ownership, equity compensation tends to account for a smaller portion of the compensation package when compared to current CEOs.
- More companies grant stock options or restricted stock with time-based vesting, instead of granting long-term performance-based compensation. We believe time-based vesting is appropriate because the Executive COB role is often more advisory in nature, rather than contributing to operational decisions that impact long-term financial performance. There may also be uncertainty associated with the length of the role.
- Equity awards may include a one-time grant or annual grants, depending on the estimated timeframe of the role. Vesting of equity awards is generally in installments over 3 or 4 years or vesting that aligns with the time in the role or the time that the Chair might remain an employee of the company.
- Executive COBs most often participate in the company’s bonus program, using the same corporate performance metrics that apply to the CEO. Individualized metrics are rarely used.
Transition of an Active CEO to an Executive COB Role
When a successful, long-tenured Chairman and CEO begins to plan for retirement, companies may strategically approach the succession process over time. Boards may keep the retiring CEO on as an employee of the company, as Executive COB, for a period of time. This period allows for a smooth succession of responsibilities. It may also mitigate uncertainty about new leadership. It is possible that a Lead Director, outside Board member, or other executive may fill the role of Executive (or Non-Executive) Chair, yet most often the role is filled by a retiring CEO.
Executive Chair Scenarios and Fact Patterns Influencing Compensation:
While pay practices vary, there are considerations to be made as it relates to compensation based on the expected timing that the Chairman role will exist or that the individual incumbent will be in the role. There are some patterns in the compensation structure if the role is shorter or longer- term.
|
Fact Pattern |
Practice |
|
Short Time Period of COB Role (1-year or less) |
|
|
Longer Time Period of COB Role (more than 1-year) |
|
|
Executive COB whot is a Founder/Significant Shareholder |
|
|
Consultant or Special / Senior Advisor |
|
|
Non-Executive COB – Executive COB, outside Director or New Hire transition |
|
Executive COB Role – Short Time Period (1 year or less)
When a CEO transitions to an Executive COB role, planned for a shorter period of time, the CEO often changes roles near the end of the fiscal year or near the annual shareholder meeting. There tends to be minimal adjustment to the base salary or annual incentive target for this period in the role. If the annual equity grant has not been made for the year, companies tend to reduce the value of the equity award and the form of the award may be modified. Companies differ on the treatment of outstanding equity awards. There are two potential scenarios:
- The company may allow outstanding equity to vest normally, according to the plan (retirement vesting if the executive is eligible), or
- The company provides some type of “enhanced-vesting” for the time that the retiring executive serves as chairman
If the transition is made after the annual equity grant, companies tend not to decrease the equity grant amount in the year of the change. Companies should consider which approach is most appropriate given the vesting period that remains, the type of outstanding award (e.g., 10-year option, 3-year performance award), the cumulative value that the COB may receive due to any enhancement, and potential shareholder reaction.
Executive COB Role – Longer Time Period (Greater than 1 year)
When the Executive COB role is expected to be greater than one year, adjustments are made to the level of pay and the forms of compensation used. Overall, base salary and annual incentive targets may be 85% to 95% of the current CEO’s pay levels. Equity may be decreased to 40% of what it was while serving as CEO, resulting in total direct compensation that is 65% and 75% of the compensation of the current CEO.
Equity awards tend to have time based vesting and are commonly not tied to longer term company performance. Vesting schedules may be modified, if necessary, to align with the expected timeframe of the Executive COB’s service. Companies often make annual equity awards, yet those that have clarity around expected timeframes may grant one-time awards intended to cover the entire time in the role.
A related benefit for CEOs in this situation may be the continued vesting of large outstanding equity grants that were received while serving as CEO. When award vesting follows the normal course, shareholders and proxy advisory services firms may view this more favorably than enhanced vesting arrangements that may be provided when the CEO retires sooner.
Non-Executive COB Role
Non-Executive COBs have a smaller time commitment. They tend not to have a specific strategic or operational oversight role, yet they do lead the board of directors. Non-Executive COBs often serve as the primary liaison between the board and the CEO and provide additional leadership and guidance. Most commonly, Non-Executive COBs participate in the regular compensation program for the company’s outside directors and receive a premium. When the premium is added to the regular board compensation, median Non-Executive COB compensation is approximately 1.6x – 1.8x the compensation paid to regular outside directors.
Conclusion
Pay for Executive COBs varies a great deal and depends on a company’s particular situation. However, when specific situations are examined closely, patterns do emerge. For example, our research indicates that a COB who is a founder or significant shareholder tends to get paid more than COBs who are not founders or significant shareholders. We also found that exiting CEOs who transition into a COB role for a short period of time may frequently receive preferable equity vesting treatment. General pay norms will help provide direction, but the responsibilities, time commitment, incumbent’s tenure with the company, ownership status, etc. should all be factored into the compensation program provided.
Case Studies
Key CAP Findings
Board Compensation. little/no change
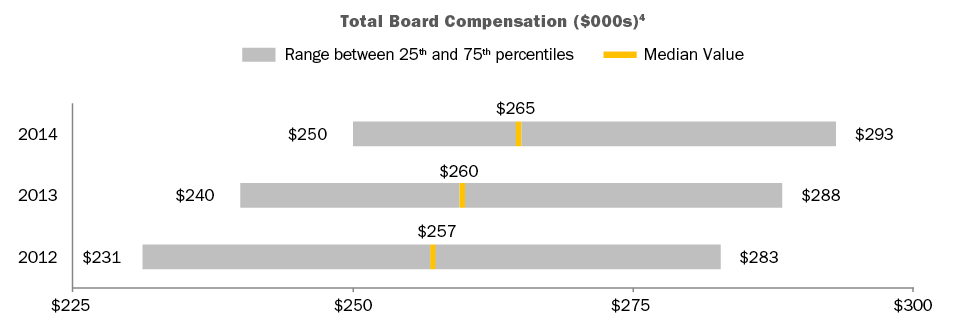
- Total Fees. Generally flat year-over-year (median is $265K, versus $260K in prior year).
- Retainers. Large companies rely on annual retainers (cash and equity) to compensate directors. Pay programs are typically simple and viewed more as an “advisory fee” than an “attendance fee.”
- Meeting fees. Provided by only 12 percent of companies (versus 15 percent in prior year). In general, companies have moved to a fixed retainer pay structure, with a component in cash and a component in equity.
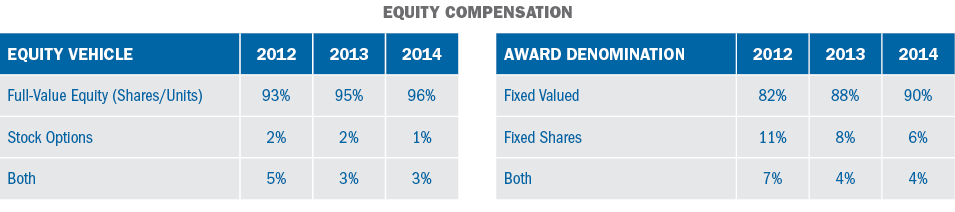
- Equity. Full-value awards (shares/units) are most common and only four percent of companies use stock options. 94 percent of companies denominate equity awards (stock or options) as a fixed value, versus a fixed number of shares which is considered best practice as it manages the value each year.
- Pay Mix. On average, 58 percent equity-based vs. 42 percent cash-based. Alignment with long-term shareholders is reinforced by delivering a majority of compensation in equity.
Committee Member Compensation. little/no change
- Overall Prevalence. 45 percent of companies paid committee-specific member fees1.
- Total Fees. Among companies paying committee member fees, the median is $15.5K.
Committee Chair Compensation. little/no change
- Overall Prevalence. Approximately 90 percent of companies provide additional compensation to committee Chairs, typically through an additional retainer, to recognize additional time requirements, responsibilities, and reputational risk.
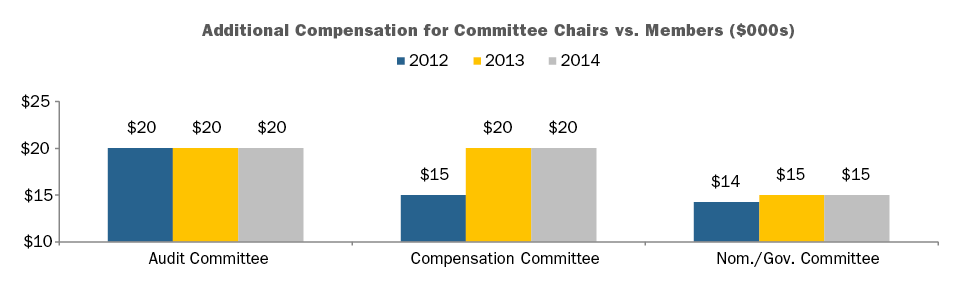
- Fees. At median, $20K in additional compensation (vs. members) was provided to Audit and Compensation Committee Chairs, and $15K additional to Nominating/Governance Committee Chairs.
Independent Board Leader Compensation. little/no change
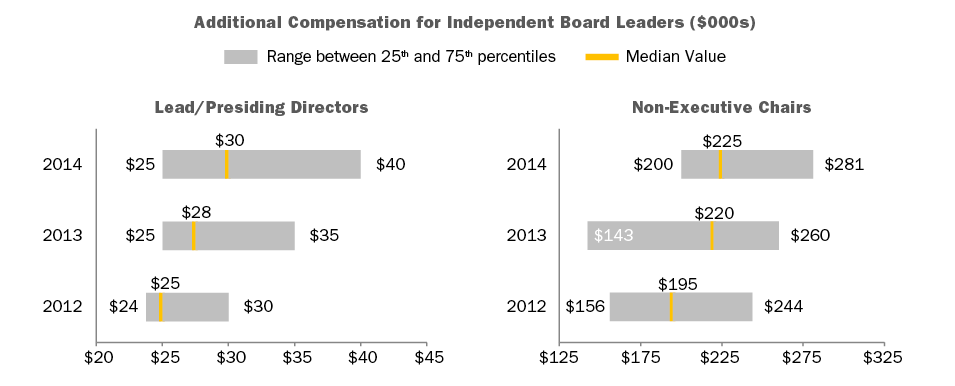
- Non-Exec Chair. Additional compensation is provided by all companies with this role, $225K at median. As a multiple of total Board Compensation, total Board Chair pay is 1.84x a standard Board member, at median.
- Lead Director. Additional compensation – $30K, at median – is provided by nearly all companies with this role2. The differential in pay versus non-executive Chairs is in line with typical differences in responsibilities. Median additional compensation was flat – $25K – for the five years prior to 2013 (median in 2013 was $28K).
Perquisites. little/no change
- Prevalence. Overall, limited use. One-third of companies provide gift matching/charitable contribution.
Pay Limits. little/no change
- 21 percent of companies that amended or adopted new equity plans in 2015 implemented specific limits for director compensation. In total, 27 percent of Fortune 100 companies now have such limits.
CAP Perspective
Board Pay Levels and Structure
We believe director compensation has leveled off – for the time being – and expect to see only modest increases in the next year.
In terms of pay program, fixed retainer structures are now the norm and meeting fees – already minority practice – continue to decline in prevalence as director compensation is now often viewed more as an “advisory fee” than an “attendance fee.”
Director Pay Limits
A number of companies have implemented limits on director compensation. The limits are largely due to advancement of litigation in Delaware court where the issue has been that directors approve their own annual compensation, and the shareholder approved long-term incentive plan did not provide “meaningful limits” on the maximum award that could be granted to a director.
Currently, 27 percent of companies studied (vs. 23 percent in prior year) have included limits for non-employee director compensation in their shareholder approved long-term incentive plan. These limits range from $250K to $3.5 million, $770K at median (vs. $800K in prior year), and typically apply to just equity-based compensation. Some companies have applied the limits to both cash and equity-based compensation, while others have excluded initial at-election equity awards, committee Chair pay, and/or additional pay for Board leadership roles from the limit.
We expect director pay limits to become majority practice within the next few years.
Lead Director Compensation
The Lead Director role has evolved, especially in companies where the CEO and Chairman roles are combined. For example, Boards are engaging in more outreach and meeting with shareholders to talk about governance practices, CEO succession and executive compensation, among other issues, and many investors want to hear from the Lead Director. Nearly all companies studied now provide additional compensation for the Lead Director role.3 However, additional compensation provided for the Lead Director role continues to be quite different than the non-executive Chair role. At median, an additional $30K was provided for the Lead Director role, versus $225K for the non-executive Chair role. The differential in pay is generally in line with typical differences in responsibilities.
Providing additional compensation to the Lead Director sends a signal to investors regarding expectations for the role, including time commitment, responsibilities, and authority. Many times, companies have been able to settle (or argue against) shareholder proposals to split the CEO and Chairman roles by instituting (or emphasizing) a strong Lead Director role and delineating the specific responsibilities of the position. Boards can also reassure investors concerned about overall governance practices at a company by increasing Lead Director responsibilities.
Best in Class Director Compensation Process & Practices
|
Best in Class PROCESS |
|
|
Best in Class PRACTICES |
|
Appendix
1 Audit, Compensation and/or Nominating and Governance committee members.
2 Excludes controlled companies. Also excludes instances where Lead Director role is assumed by Chair of Nominating and Governance Committee, who receives compensation for that role.
3 Excludes controlled companies. Also excludes instances where Lead Director role is assumed by Chair of Nominating and Governance Committee, who receives compensation for that role
4 Total Board Compensation reflects all cash and equity compensation for Board and committee service, excluding compensation for leadership roles such as committee Chair, Lead/Presiding Director, or non-executive Board Chair.