Partners Dan Laddin and Matt Vnuk discuss recent director compensation trends and evolving practices
This report summarizes the Compensation Advisory Partners analysis of survey data collected in May 2019 in collaboration with Family Business and Private Company Director magazines.
Private companies face unique challenges relative to their publicly traded peers when compensating top officers and directors. Private companies lack publicly traded stock, which is a key component of top officer and director pay packages at public companies. Private companies face an additional and formidable challenge with regard to setting director pay: Little to no market pay data exists for board service at private companies. Because of the lack of competitive data, private companies often resort to using board pay levels at public peers, if any are available. Private company board pay programs have been based on a combination of the cash portion of public company director pay and the best judgment of decision-makers at the private companies.
To address this lack of competitive market data, Compensation Advisory Partners (CAP), and Private Company Director and Family Business magazines (both of which are published by MLR Media) worked together to survey private companies about their director pay programs. The response was enthusiastic, with more than 600 companies submitting data during the May 2019 survey period. This article provides a high-level summary of the survey data and describes how private companies can approach the design of effective and competitive board compensation programs.
About the Survey Participants
The private companies that responded to the survey represent a broad array of demographic categories. This broad representation results in a robust and unique data set detailing board of director compensation levels and practices.
Company Size
The survey asked about company size because that typically has an impact on board pay levels. Survey respondents have median revenue of $90 million and average revenue of $631 million. The companies in the survey span many revenue sizes as shown in Exhibit 1.
Exhibit 1
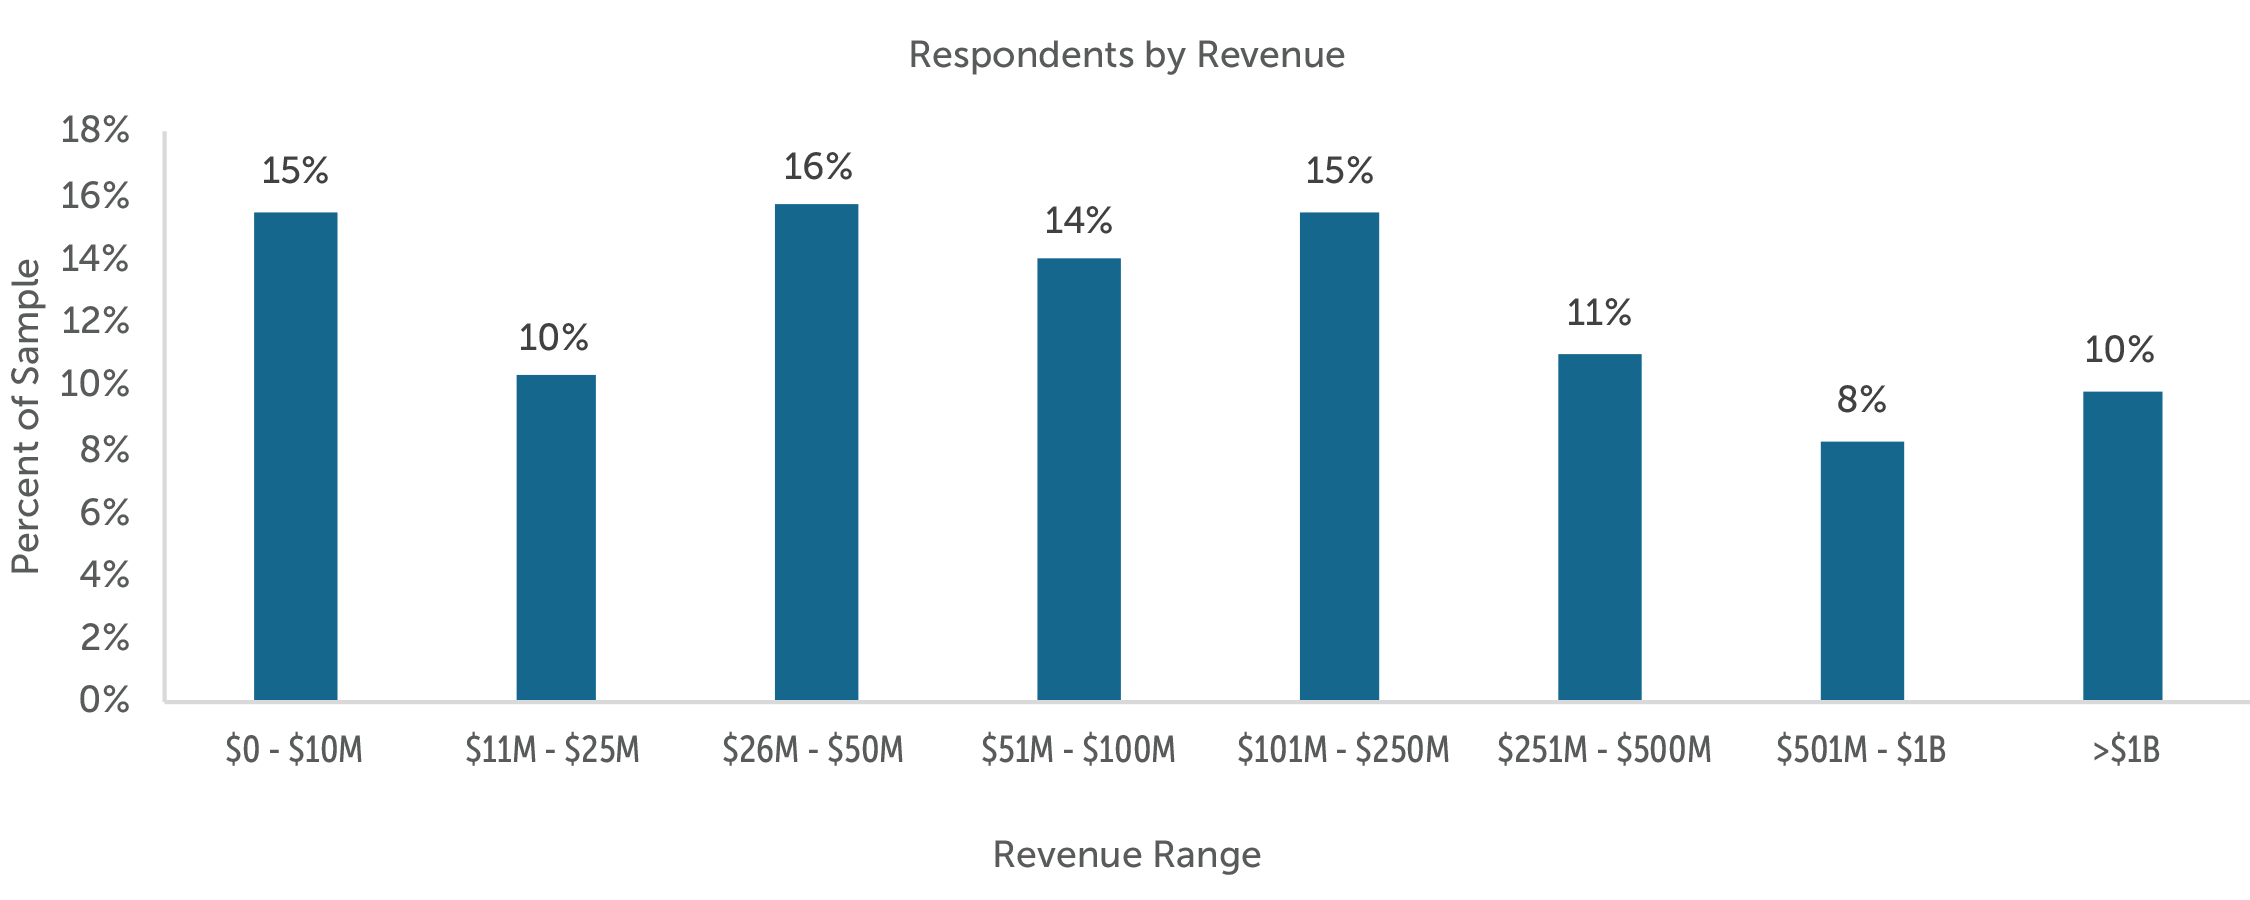
Survey participants were also asked about their number of employees and shareholders. The median number of employees for survey participants is 250, while the average is 1,570. The median number of shareholders is seven, with an average of 131.
Industries
The companies that responded to the survey represent a broad range of industries. The largest industries represented in the survey are manufacturing (31%); finance and insurance (9%); retail trade (8%); wholesale trade (7%); professional, scientific, and technical services (7%); construction (7%); real estate, and rental and leasing (5%); and health care and social assistance (5%).
Company Ownership
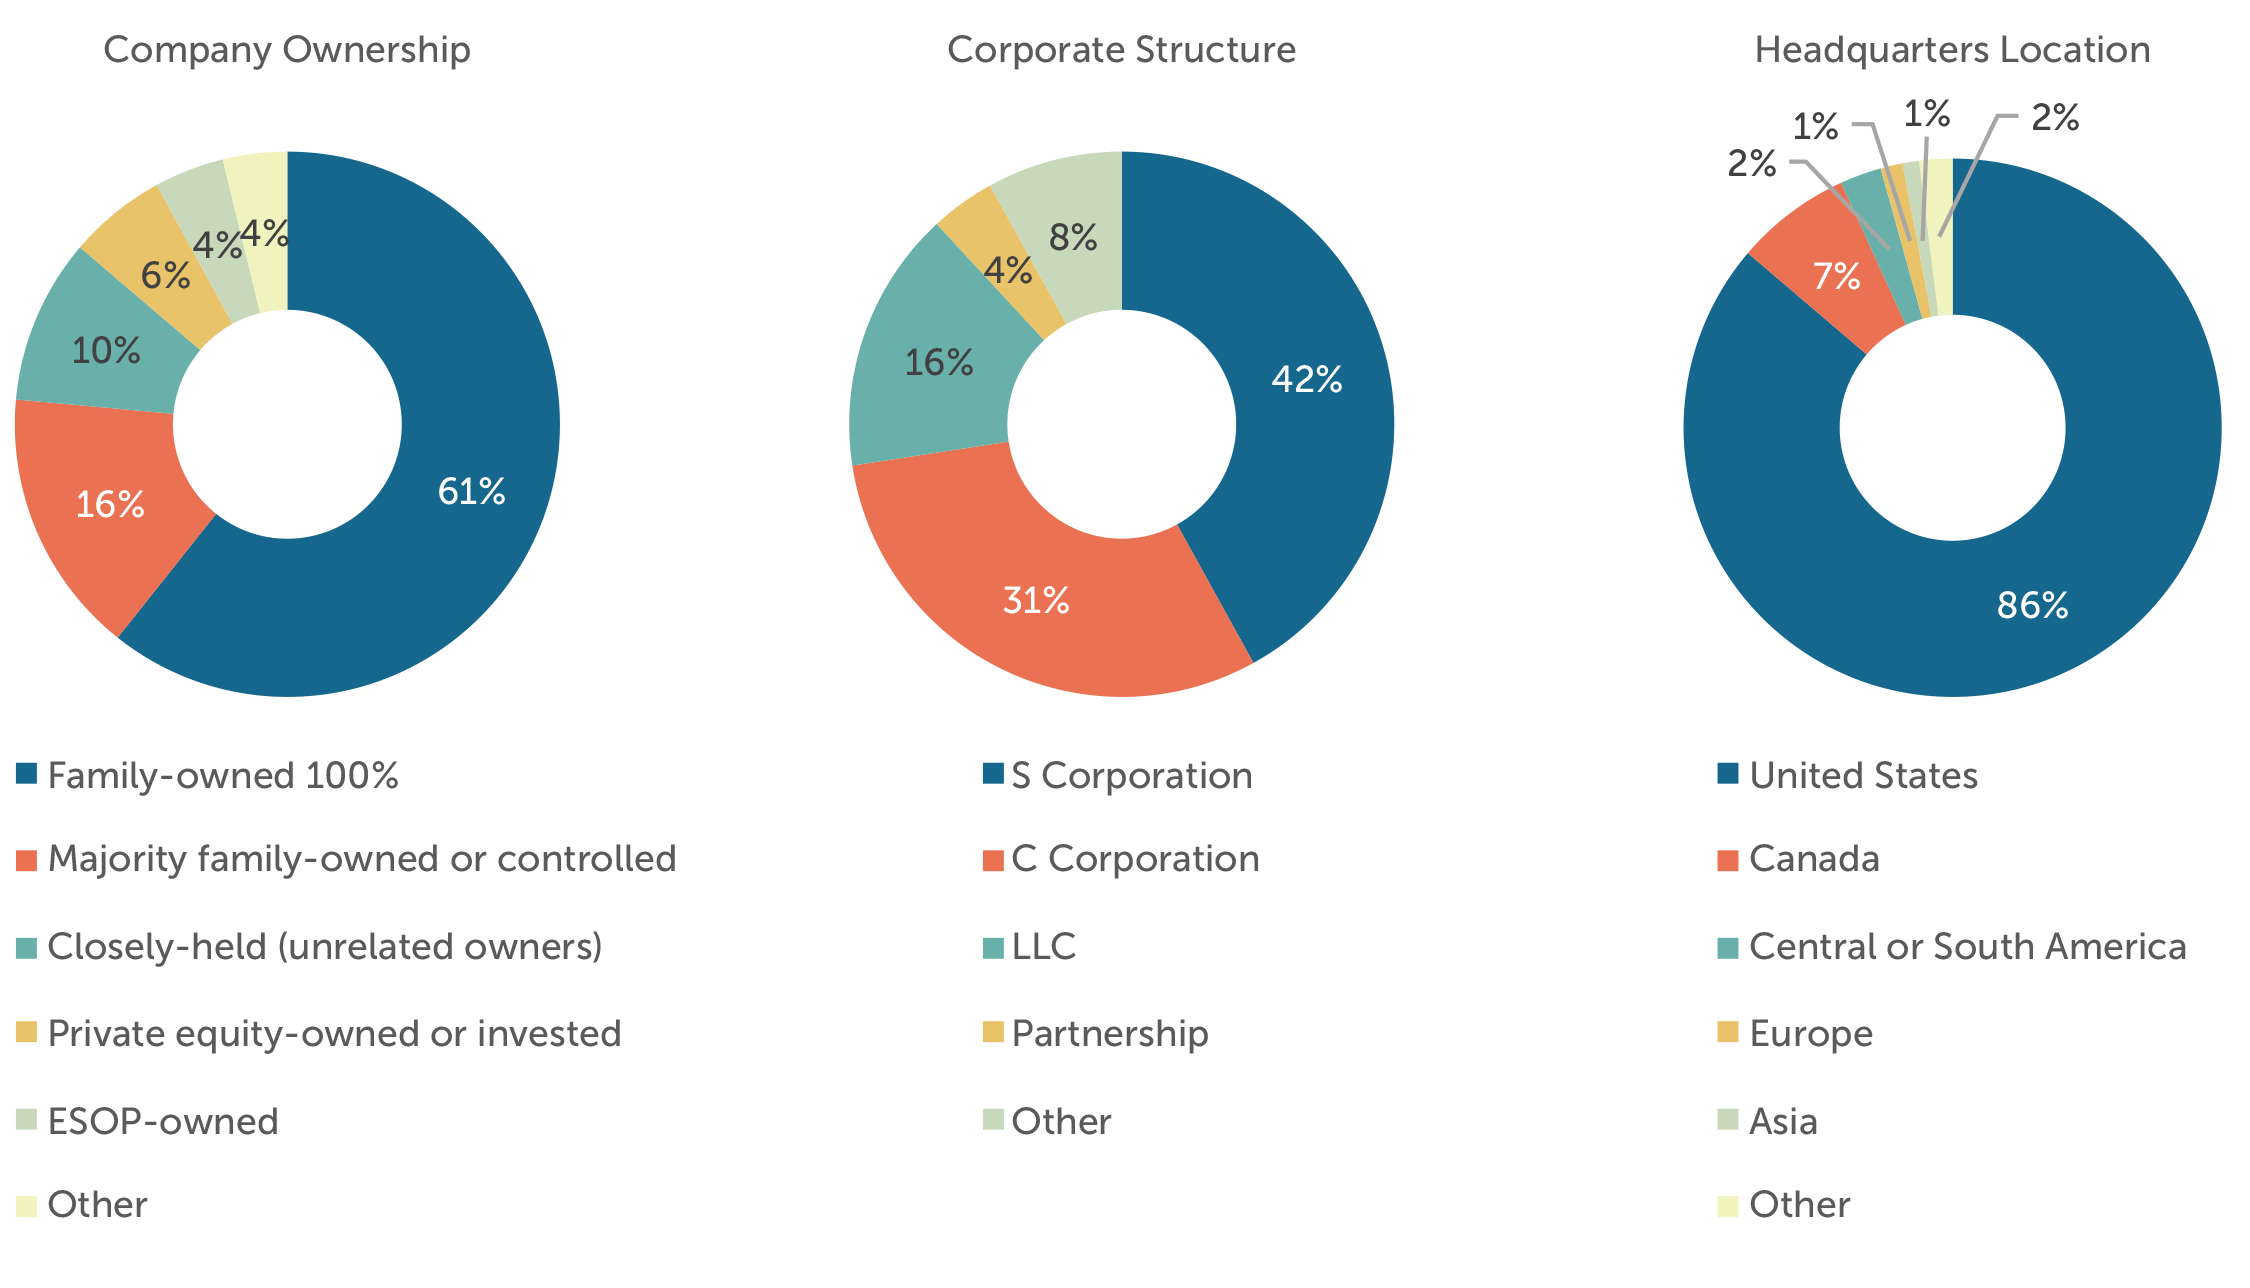
With regard to company ownership, the largest portion of the sample by far is made up of family-owned businesses. Other ownership groups represented in the sample are companies that are closely held by unrelated owners, private equity-owned or -invested, and employee-owned. (See Exhibit 2.) The “other” ownership category in Exhibit 2 includes mutual companies, tax-exempt entities, and cooperatives.
Corporate Structure
The survey also asked respondents to provide information about their corporate structures. The most prevalent corporate structures are S corporations and C corporations. Smaller numbers of respondents reported that they are limited liability corporations (LLC) and partnerships. (See Exhibit 2.) The “other” category in Exhibit 2 includes mutual companies, sole proprietors, B corporations, cooperatives and trusts.
Location
The vast majority of survey respondents are headquartered in the United States, but the survey drew responses from companies headquartered all over the world. (See Exhibit 2.)
Exhibit 2
Private Company Board Compensation Basics
According to the survey, 87 percent of private companies provide some form of compensation to eligible directors. In public companies, those eligible for compensation are typically outside directors, or those who have no ties to the company through employment. (At times, representatives of private-equity investors do receive cash compensation.) In contrast, 45 percent of private companies compensate board members who are shareholders, family members or executives (“inside” directors). Another 7.5 percent of respondents have “other” compensation arrangements for inside directors. This likely means a hybrid approach that involves some level of compensation for such inside directors, but not to the same degree as outside, independent directors. The high number of private companies that compensate shareholders, family members and executives likely reflects the high percentage of family companies responding to the survey.
Private-company board compensation programs have two common cash components: An annual retainer and per-meeting fees. An annual retainer, which is an amount paid to each eligible director on an annual or quarterly basis for board service, is offered by 72 percent of private companies surveyed. Per-meeting fees are smaller amounts paid to eligible directors for attendance at each board meeting, and they are offered by 54 percent of the companies surveyed. (See Exhibit 3.)
Exhibit 3
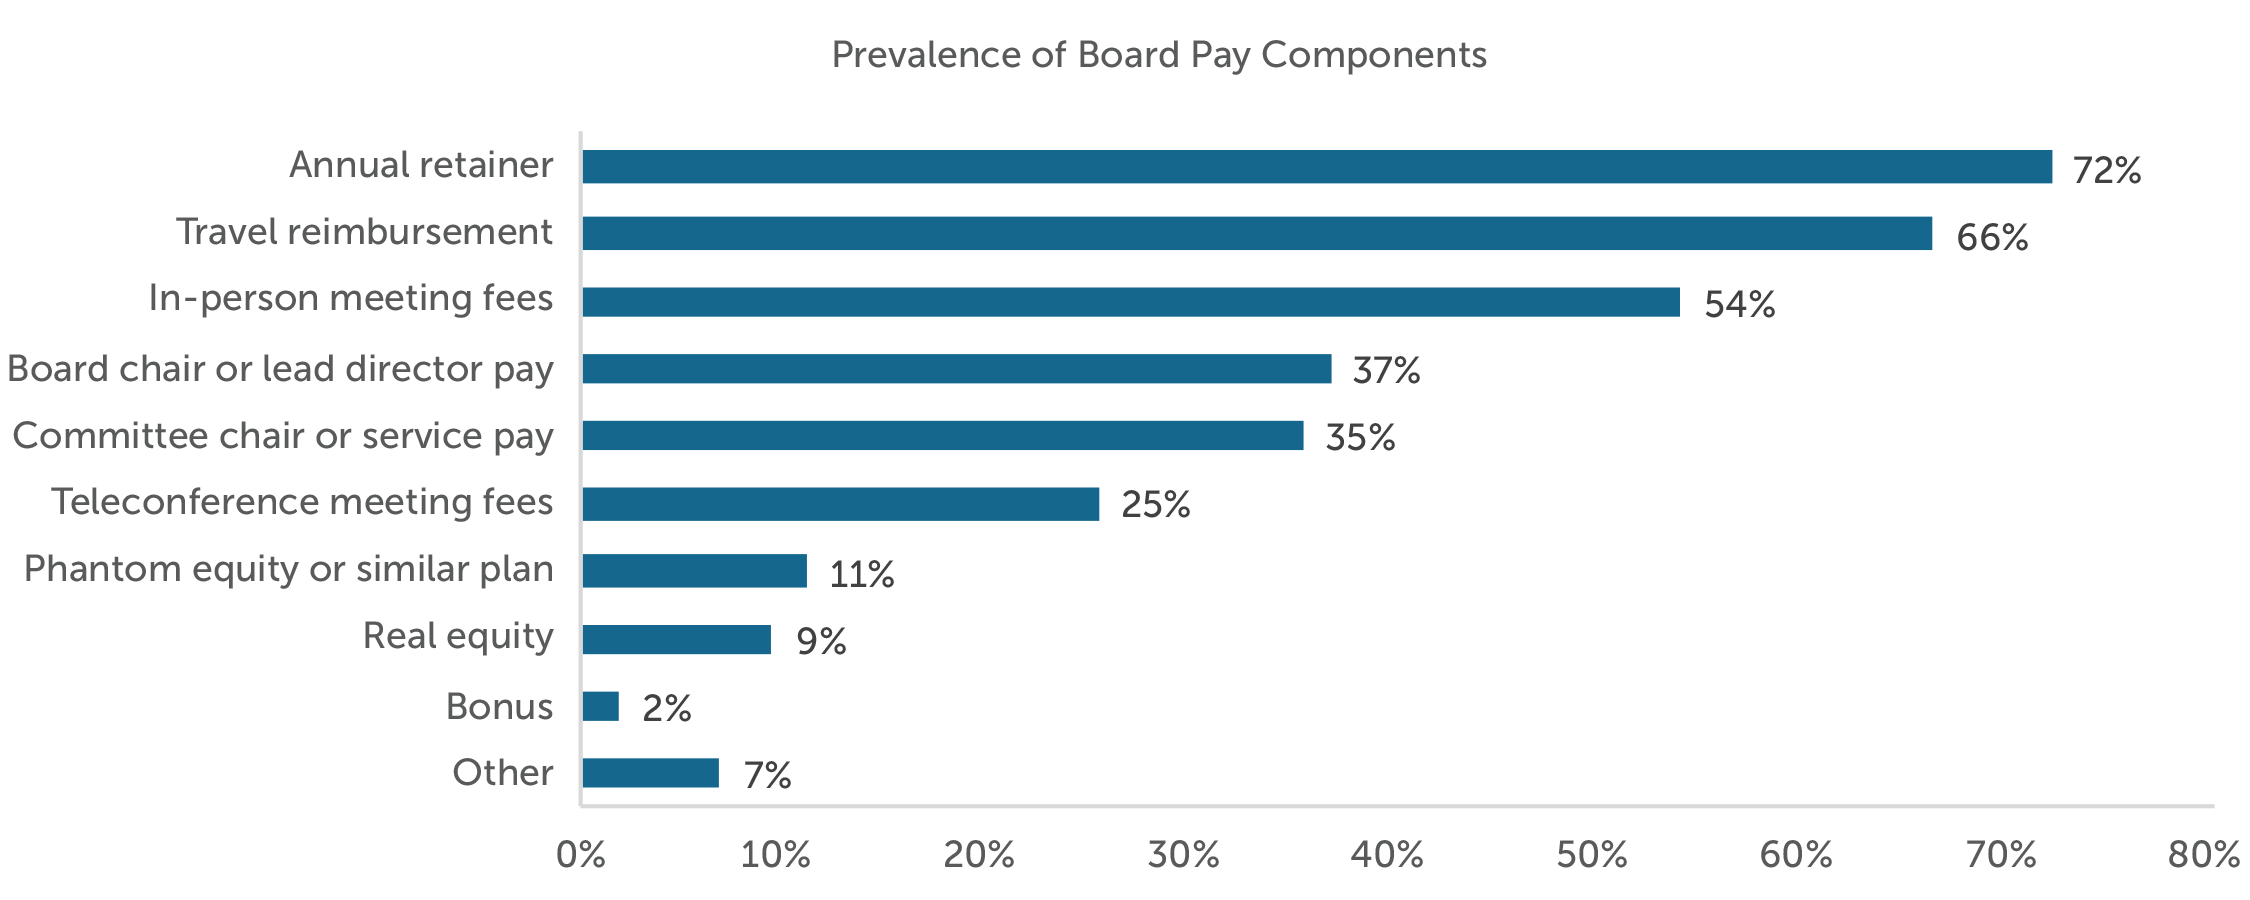
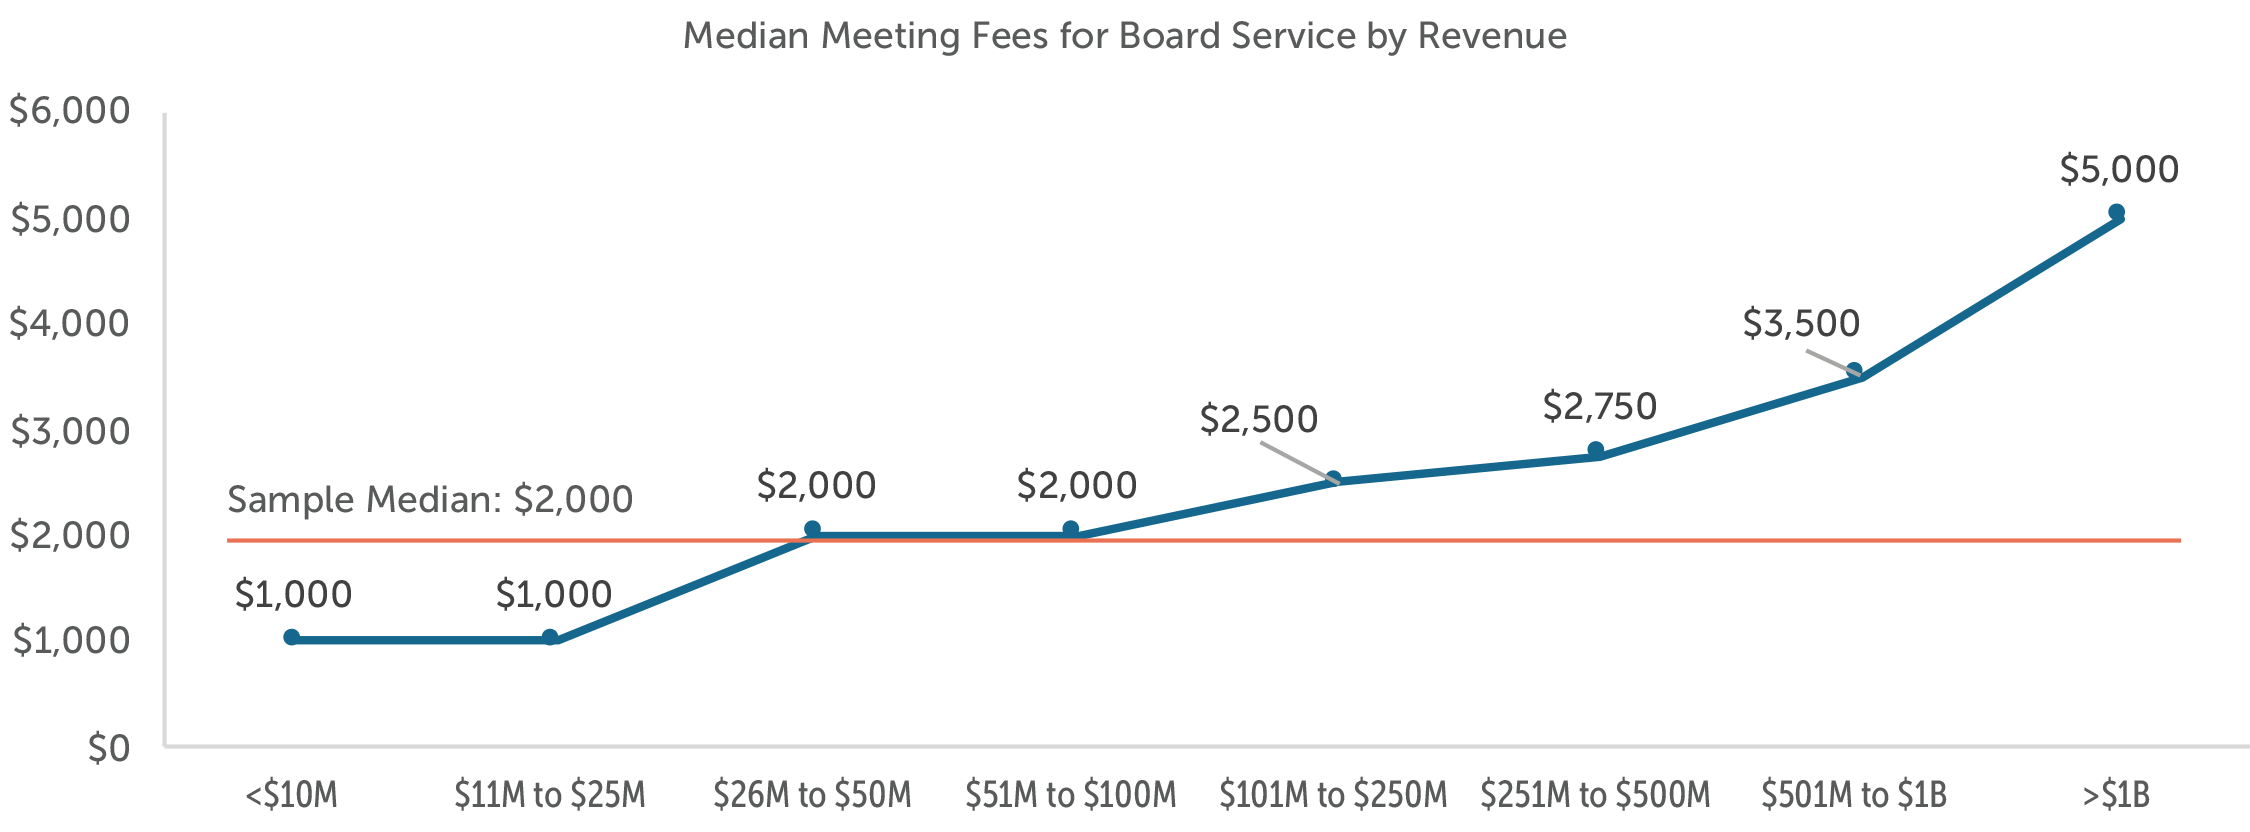
According to the survey, the median annual retainer is $30,000, and the median per-meeting fee is $2,000. Annual retainers and meeting fees increase with company size. (See Exhibits 4 and 5.) Some companies also pay eligible directors a lesser amount for participation in telephonic meetings, with the median payment being $1,000.
Private companies continue to use both an annual retainer and meeting fees, while the trend for director cash compensation at public companies is to pay a higher annual retainer only (i.e., no meeting fees). Public companies have adopted this approach because directorship requires time and effort beyond meetings, so retainers better reflect the requirements of the overall role. In addition, advancements in technology have made meeting participation easier and have blurred the lines for what constitutes a meeting, and public company directors are expected to attend at least 75 percent of board meetings. Incentivizing meeting attendance is, therefore, less of an issue for public companies. Finally, retainers are easier to administer than meeting fees, which require attendance tracking.
Exhibit 4
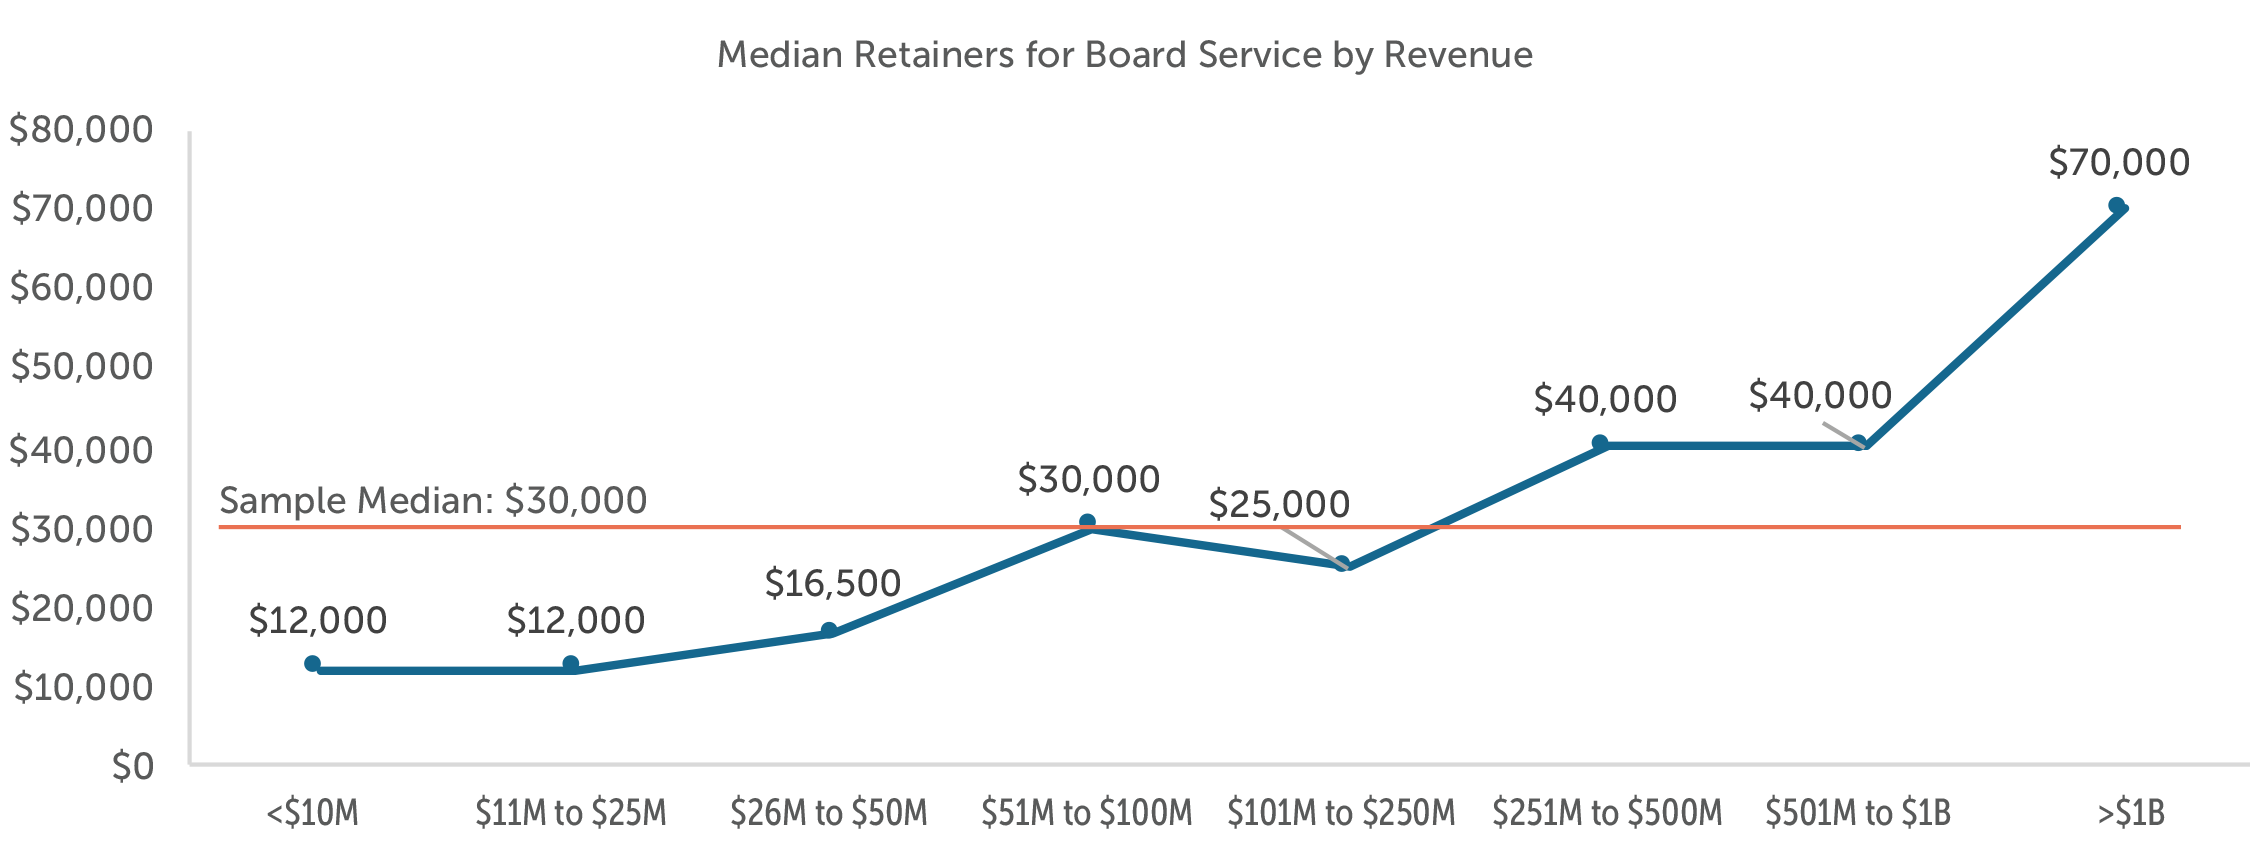
Exhibit 5
Retainers and per-meeting fees are also used to compensate individuals who take on different roles above and beyond basic board service. According to the survey, 37 percent of private companies offer incremental retainers and/or per-meeting fees for the board chairperson or lead director. In addition, 35 percent of private companies offer incremental retainers and/or per-meeting fees for committee service. In contrast with retainers and meeting fees for basic board service, the retainers and fees for differentiated board roles do not track the company’s size in terms of revenue.
Private companies recognize the value that board members bring to the table; however, only about 20 percent of the private companies surveyed provide long-term incentives to their board members in the form of phantom equity, cash multi-year incentives or actual equity grants, such as stock options or full-value shares. This low prevalence is not surprising, as private companies do not have publicly traded stock. This contrasts with public-company practice, where the vast majority grant equity to their directors. Publicly traded firms provide at least half of a director’s total compensation in the form of equity, typically full-value shares.
Table 1 summarizes the board compensation elements reported in the survey. (Additional data is included in the full survey report, which is provided exclusively to survey participants.)
Table 1
|
Maximum |
Median |
Minimum |
|
| Board Member Base Cash Compensation | |||
| Annual Retainer | $400,000 | $30,000 | $1,000 |
| Meeting Fee | $100,000 | $2,000 | $200 |
| Board Chair Additional Cash Compensation | |||
| Annual Retainer | $450,000 | $20,000 | $1,500 |
| Meeting Fee | $40,000 | $1,700 | $250 |
| Lead Director Additional Cash Compensation | |||
| Annual Retainer | $150,000 | $17,500 | $1,000 |
| Meeting Fee | $15,000 | $1,125 | $250 |
| Committee Chair Additional Cash Compensation | |||
| Annual Retainer | $50,000 | $6,000 | $500 |
| Meeting Fee | $12,500 | $1,000 | $100 |
| Committee Member Additional Cash Compensation | |||
| Annual Retainer | $30,000 | $5,000 | $750 |
| Meeting Fee | $6,000 | $1,000 | $150 |
| Long-Term Incentive (Restricted Stock, Options, Cash) | |||
| Incentive Value | $1,000,000 | $31,250 | $1,000 |
A final prevalent practice for private companies is to reimburse directors for their travel expenses. While this iteration of the survey did not ask about benefits and perquisites, some companies referenced them in their “other” responses. Future iterations of the survey may quantify such compensation elements.
Designing a Private Company Director Compensation Program
Private companies that wish to evaluate the design of their director pay programs should first determine what are the primary objectives of the program. Most board pay programs, whether at private or publicly traded companies, will strive to compensate directors for their time, and for the value received by the company for the director’s contributions. Other common objectives of board pay programs are to:
- Compete with other companies, including public companies, for board talent,
- Attract individuals with needed skills, knowledge and interpersonal networks to the board to supplement the executive team and shareholders,
- Reward directors for contributing to the company’s success, and/or
- Align director interests with shareholder interests.
Companies that are trying to compete for talent or attract special skills should strive to provide a competitive board compensation program, although director pay does not need to be as high as at a public company. Private company boards have a lower level of risk, disclosure and regulation than their publicly traded counterparts.
Once the objectives of the compensation program are defined, the next steps are to conduct internal and external reviews:
Internal review – This step involves looking at the company’s situation and the board dynamics. Issues to consider during the internal review are the complexity of issues facing the company; the likelihood of mergers, acquisitions and/or divestitures; whether the company plans to pursue a value-realizing event; any potential leadership changes or a generational transition in a family business; the company’s executive compensation philosophy and programs; the shareholders’ desire to share equity or not; whether the board’s role is fiduciary or advisory; directors’ expectations and other boards on which the directors serve; the board’s expected time and meeting commitments; non-compensatory benefits of serving on the board; and which board roles and/or committees are more involved and time-consuming. In general, boards and board roles with greater complexity, risk and challenges merit higher compensation.
External review – The external review involves considering how the company compares to its peers and collecting board compensation information for similar companies and/or boards. Sources of compensation information may include informal information from executives and directors about what other companies offer, and more formal information such as public peer company proxy data (generally excluding the equity data) and published survey data, such as the CAP-MLR Media survey. (Companies that participate in the survey have access to specialized data cuts by revenue size, industry and other parameters.) The goal of the external review is to understand competitive compensation practices and ranges, and to inform the company’s decision-making.
Once the internal and external reviews are completed, company shareholders can make decisions about the director compensation program. The shareholders will need to decide what type of pay model to adopt: retainers only, meeting fees only, or a combination of the two. As mentioned previously, publicly traded companies are moving toward a “retainers only” approach for cash compensation. However, the private-company survey indicates that more than 50 percent of private companies use per-meeting fees to compensate directors. A “retainers only” pay model makes sense for companies that wish to pay for overall board roles rather than time spent at individual meetings. Indicators that favor a “retainers only” pay model include material director time required outside of meetings, frequent interaction between board members outside of meetings that could create ambiguity about whether a formal meeting is taking place, a more predictable board workload and a desire for administrative simplicity. Under this model, retainers will need to be set at a level to compensate for all board work. Retainers also can be used to differentiate compensation for board roles. For instance, a basic retainer can be provided to all directors for board service, and incremental retainers can be provided to committee chairs and the board chair to recognize the additional time, effort, skills and knowledge required for those roles.
At the opposite end of the spectrum, some companies may choose a “meeting fees only” pay model. This pay model makes sense if most of the board work is tied to the meetings themselves. Per-meeting fees can be set to take into account typical meeting length, and preparation and follow-up time. Indicators for this pay model include an unpredictable number of meetings, comfort with the administrative efforts required to track and compensate meeting attendance, and most work requirements corresponding to board and committee meetings. Under this pay model, committee work can be compensated through meeting fees that are the same as board meetings or less if committee meetings require less time. In addition, roles such as chairman or lead director could be recognized with a higher per-meeting fee.
For companies that fall somewhere in the middle, a combination of retainers and meeting fees might make sense. Some companies with the potential for a flurry of meetings can stipulate that the basic retainer covers a certain number of meetings. If meetings are required above the number covered by the retainer, then meeting fees will be paid to directors.
In addition, the shareholders will need to decide whether to offer any sort of long-term incentive, such as phantom or real equity, for the directors. Companies that wish to reward directors for contributing to the company’s success and to align director interests with shareholder interests may want to consider providing directors with phantom or real equity stakes, or a multi-year performance bonus. However, according to the CAP-MLR Media survey, most private companies do not do this. However, the practice is common for start-up companies that are cash-constrained, and for private-equity owned companies. In both of those situations, stock options are a common vehicle.
Before implementing a new director pay program, companies should consider the prior year’s board schedule and workload, and calculate what the company’s board compensation expenses would have been last year using the proposed compensation program. This step is particularly important for companies that offer meeting fees. Modeling payouts under a new pay program will help validate the proposed program and flag any potential issues. The company should look at the modeled expenses of the new program relative to past spending on board of director compensation, and determine whether the new program’s costs are reasonable.
Conclusion
While private companies have historically had challenges with regard to competitive board compensation data, the CAP-MLR Media survey helps private companies address this issue. The survey shows that private companies have unique practices from public companies with regard to board of director compensation. Private companies are more likely to compensate a large group of directors, including those who would be considered “insiders” at public companies, and are more likely to use meeting fees. Only a small minority of private companies use long-term incentives, such as phantom and real equity, in their director pay programs. Companies can design an effective and competitive board compensation program by understanding the company’s and board’s unique situation, and by taking external market data into consideration.
Appendix A
Board Composition and Governance
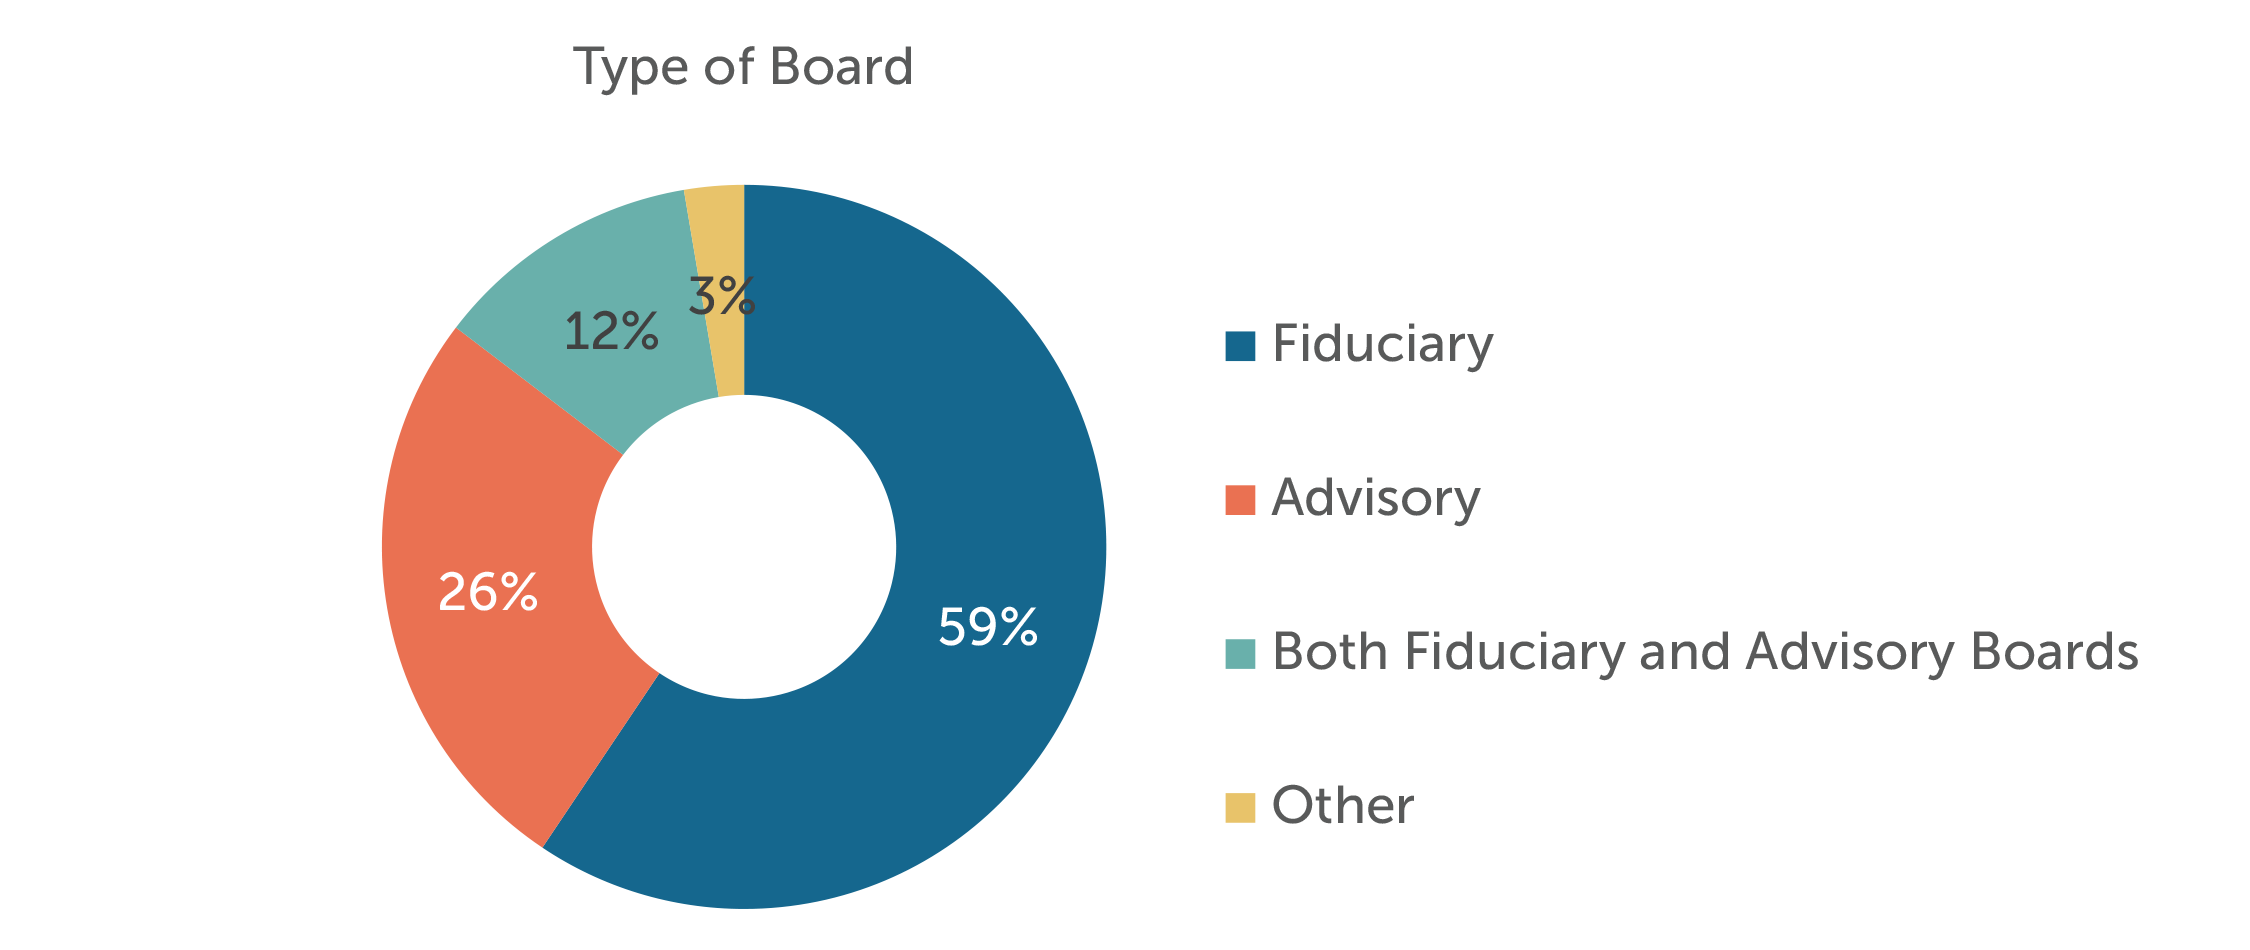
The CAP-MLR Media survey asked a number of questions about the board composition and governance. Almost 60 percent of the private companies surveyed have fiduciary boards. Another 26 percent of companies have advisory boards only, and 12 percent report having both fiduciary and advisory boards. (See Exhibit 6.)
Exhibit 6
According to the companies surveyed, the typical board has five to eight directors, with seven being the median. Inside directors outnumber outside, or independent, directors, with a median of four inside directors and three outside directors.
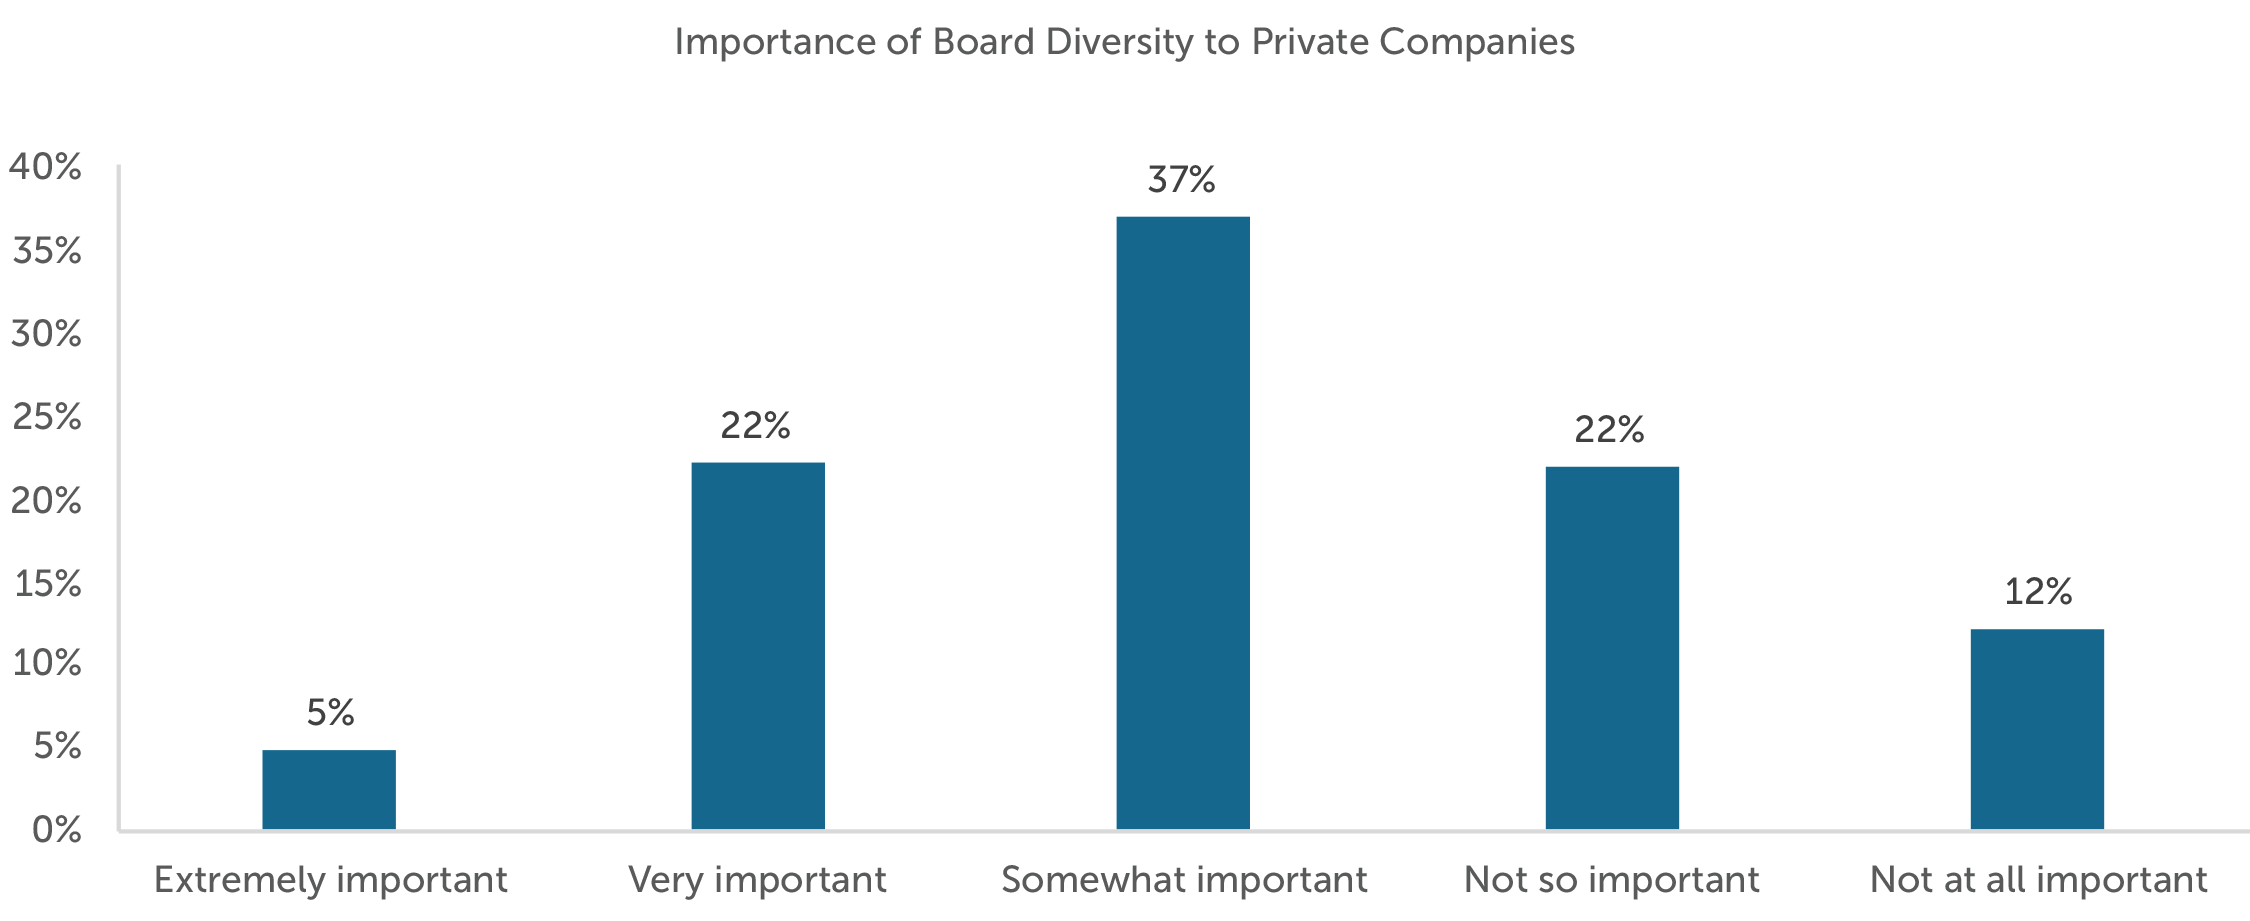
With regard to diversity, each private-company board typically has one female director and no minority directors. Diversity is becoming a bigger issue for public-company directors. Since private companies – especially those preparing for a value-realizing event – tend to follow public-company practices, CAP and MLR Media expect that diversity will become a more important issue for private-company boards going forward. The survey asked respondents about the importance of diversity to private-company boards, with most responding that diversity is moderately important. (See Exhibit 7.) Tracking this question over time will show whether public-company issues are making their way to private companies.
Exhibit 7
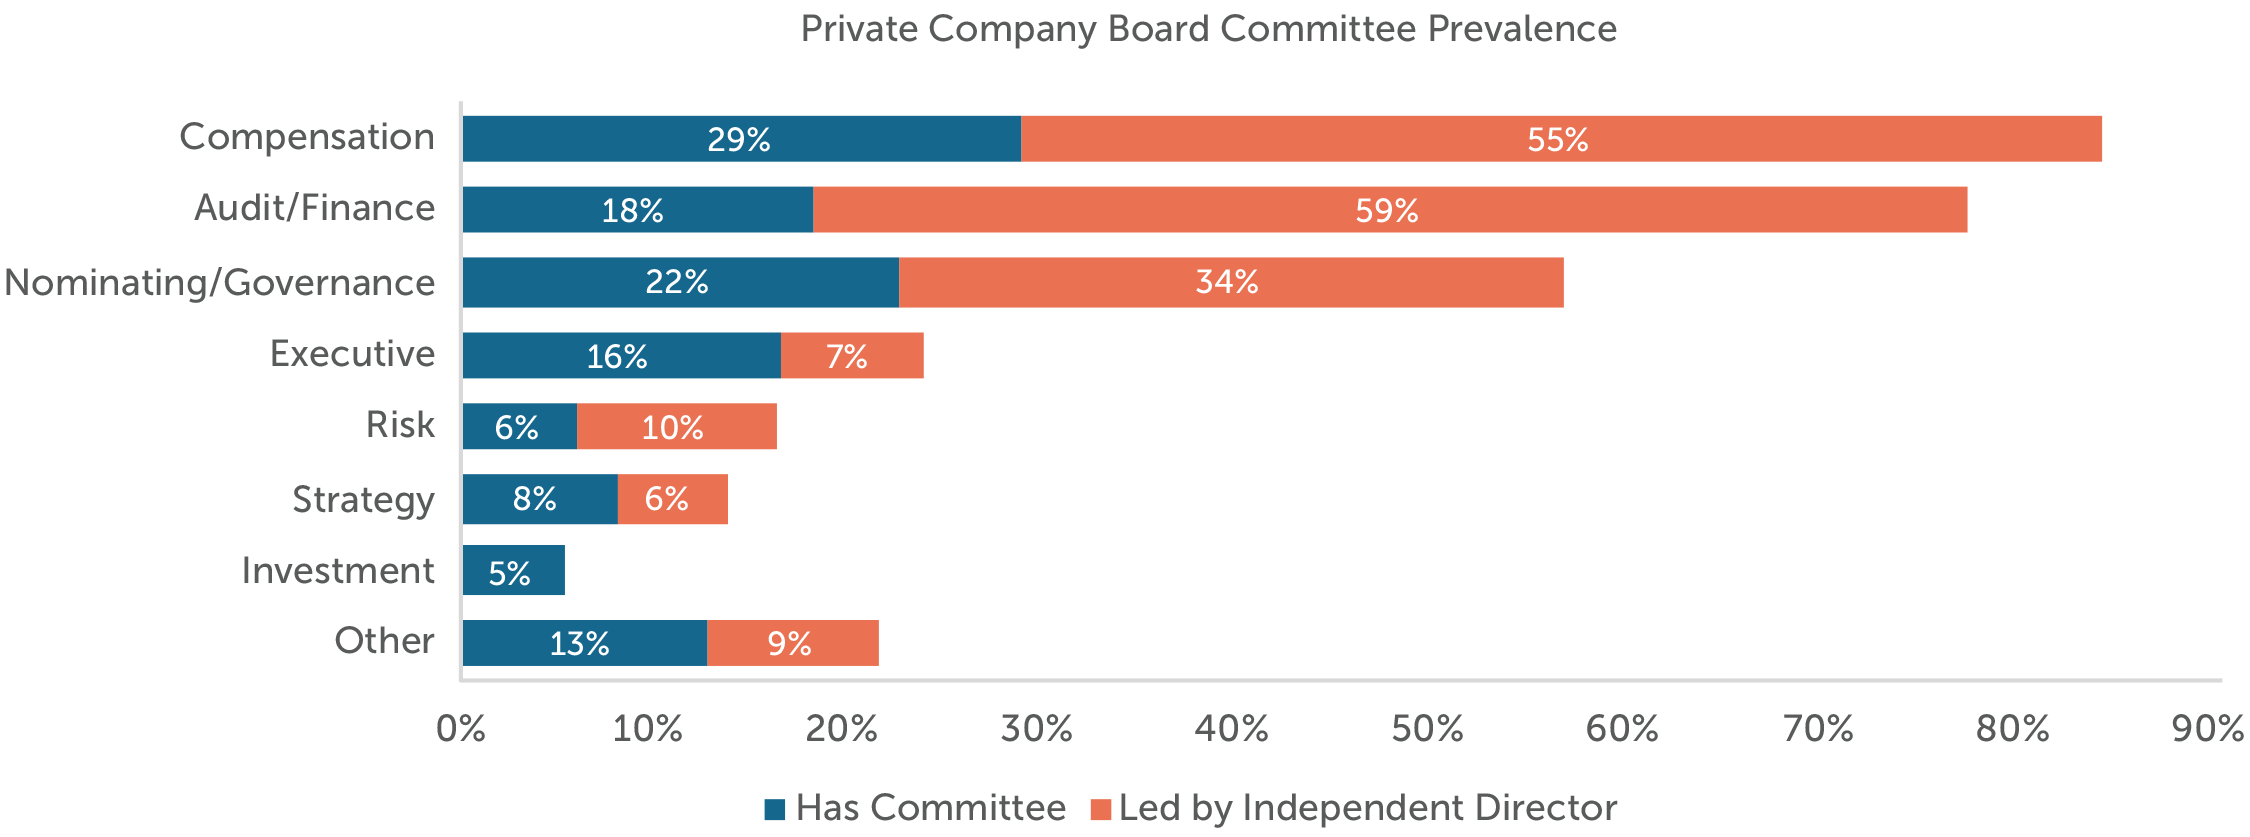
Slightly more than half of the survey participants have formal board committees. For companies that have committees, the committee structure of private-company boards follows that of public-company peers, with audit/finance, compensation and nominating/governance committees being prevalent. Most private-company boards are led by independent directors, with the exception of executive, strategy and other committees. (See Exhibit 8.)
Exhibit 8
Private-company boards typically meet four times per year, as do the committees. Respondents estimate that private-company board members spend 50 hours per year at median on board service and 20 hours per year at median on committee service.
Appendix B
Survey Methodology
MLR Media sent the survey to contacts in its Private Company Director and Family Business subscriber databases. Compensation Advisory Partners, a leading boutique executive compensation consulting firm, analyzed the unattributed data responses and produced the survey reports with the assistance of MLR Media.
For purposes of analyzing the compensation data elements, only companies that provide the compensation element were included. Some companies that do not offer a particular compensation element provided “zero” as the answer for that pay element. Zeros were omitted in the analysis.
The definitions of several terms used in the survey follow:
Advisory Board – A more informal board that provides guidance and advice to the company’s management team and shareholders, but the board has no legal obligations.
Fiduciary Board – A formal board with voting rights and legal obligations to a company. Fiduciary boards oversee the chief executive officer and management.
Independent or Outside Director – An individual on a company’s board who has no ties to the company through employment or family status, and who has no ownership other than compensatory stock provided for board service.
Inside Director – An individual on a company’s board who works at the company or who has ownership of the company, including through family status.
Median – The data point at which half of the responses are higher, and half of the responses are lower.
For questions or more information, please contact:
Bertha Masuda
Partner
Compensation Advisory Partners
[email protected]
310-541-6233
Bonnie Schindler
Principal
Compensation Advisory Partners
[email protected]
847-636-8919
David Shaw
Editor and Publishing Director
Private Company Board
[email protected]
301-963-6162
Each year CAP analyzes non-employee director compensation programs among the 100 largest companies. These companies generally provide early insights into potential trends in terms of compensation practices. This report focuses on a summary of pay levels and pay practices trends based on 2018 proxy disclosure.
CAP Findings
Board Compensation
pay levels increased modestly
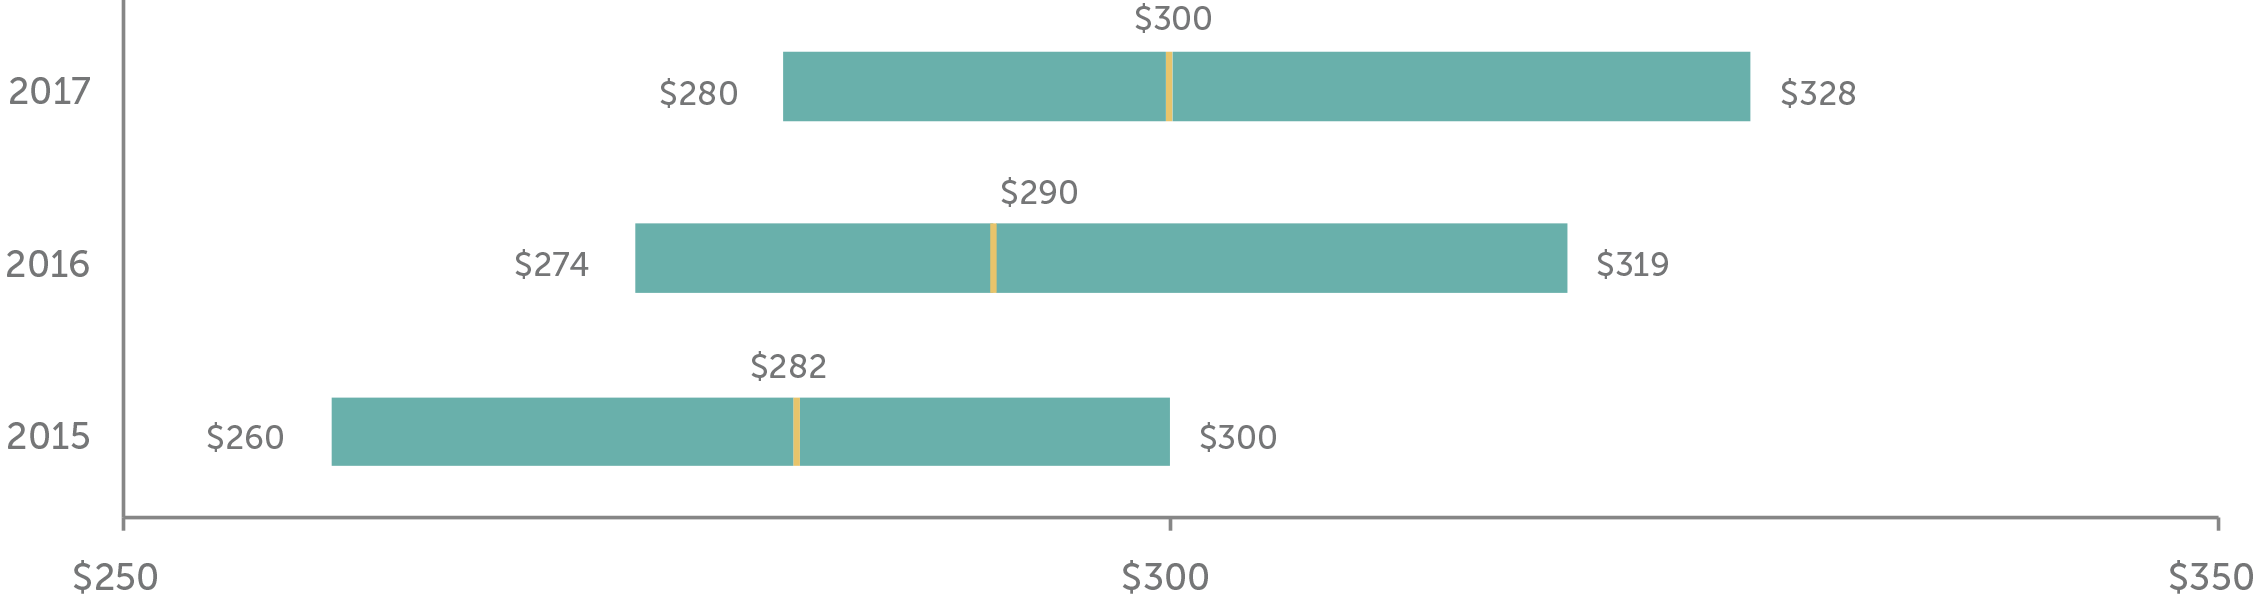
- Total Fees. Board compensation has been in a steady state with low single-digit annual increases – we expect this to continue to be the norm. Median is now $300K, up from $290K last year, a 3.4% increase.
- Retainers. Companies rely mainly on annual retainers (cash and equity) to compensate directors. Pay programs for large companies are simple and tend to rely less on meeting fees or committee member retainers.
- Meeting Fees. Paid by 12 of the 100 companies, consistent with prior years. Most companies have moved to a fixed retainer pay structure, with a component in cash and a component in equity. We support this approach as it simplifies administration and the need to define what counts as a meeting. However, companies may want to consider having a mechanism for paying meeting fees if the number of meetings in a single year far exceeds the norm (“hybrid approach”). Consistent with prior year, five companies in our dataset used this hybrid approach to meeting fees, with the threshold ranging between 6 and 10 meetings.
- Equity. 99 companies used full-value awards (shares/units) and only 6 used stock options (5 used both vehicles). Almost all companies denominated the equity awards in terms of a fixed value, versus a fixed number of shares, which is considered best practice as it manages the value awarded each year.
- Pay Mix. On average, total pay is comprised of 61% equity and 39% cash, consistent with as last year.
- Process: 24% of companies disclosed increases to board cash and/or equity retainers versus prior year.
Committee Member1 Compensation
prevalence continues to slowly decline
- Overall Prevalence. 44% of companies paid member fees for Audit Committee service, 31% paid member fees for Compensation Committee service, and 28% paid member fees for Nominating/Governance Committee service. Companies rely more on board-level compensation to recognize committee member (non-chair) service, with the general expectation that all independent directors contribute to committee service needs.
- Total Fees. Of the companies that paid committee member compensation, the median was $16K.
Committee Chair1 Compensation
no change
- Overall Prevalence. More than 90 percent of companies provided additional compensation to committee Chairs to recognize additional time requirements, responsibilities, and reputational risk.
- Fees. Median additional compensation remained $25K for Audit Committee Chairs, $20K for Compensation Committee Chairs, and $15K for Nominating/Governance Committee Chairs. Most often the extra fees were delivered through an additional cash retainer and not meeting fees.
Independent Board Leader Compensation
little/no change
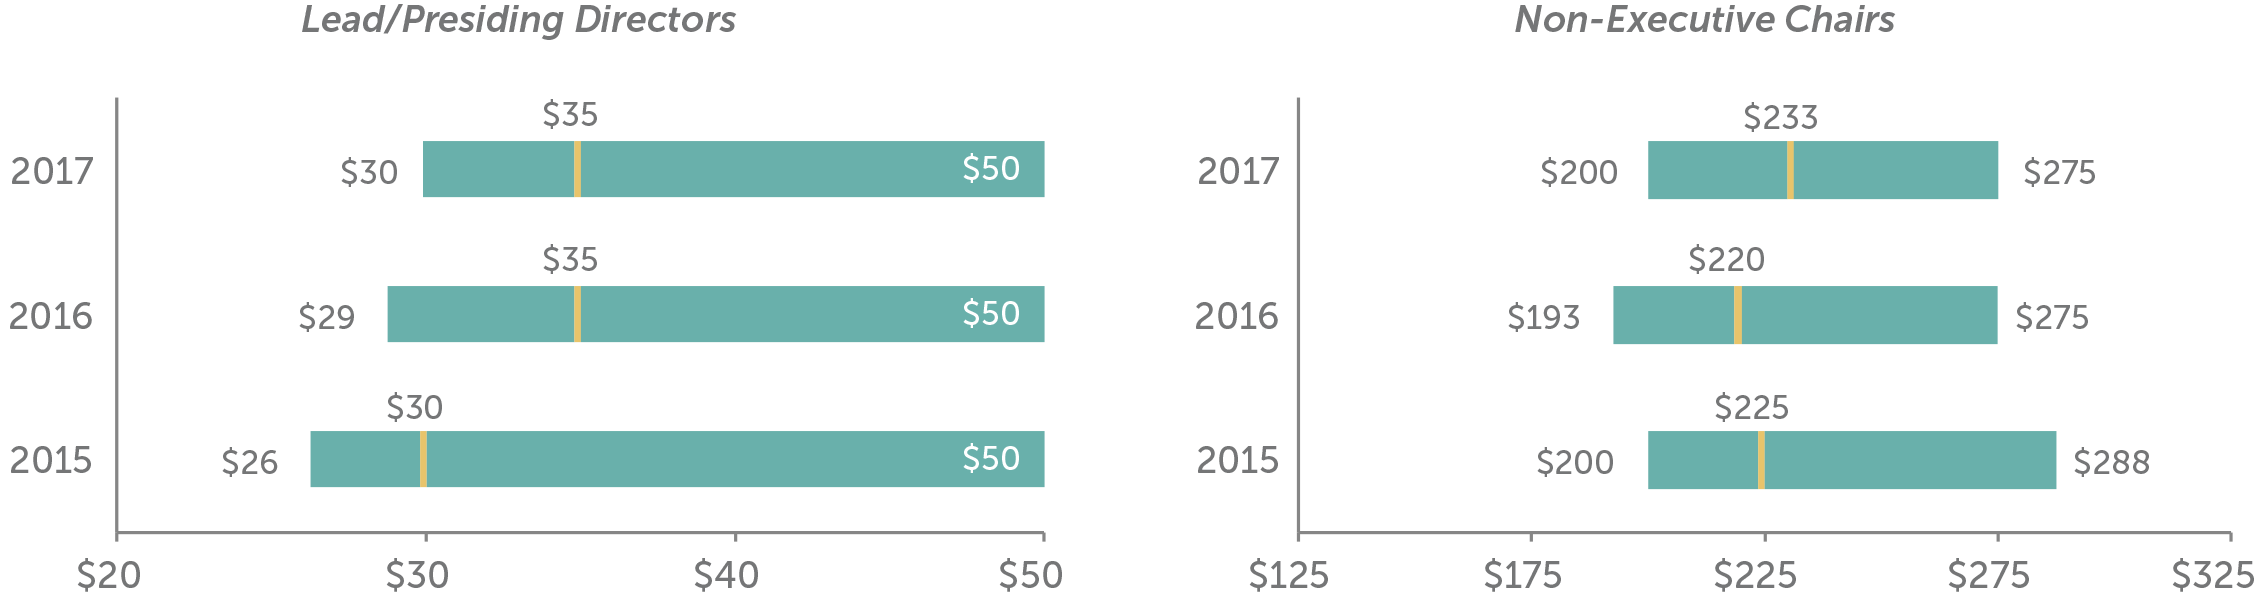
- Non-Exec Chair. Additional compensation is provided by nearly all companies with this role. Median additional compensation is $233K. As a multiple of total Board Compensation, total Board Chair pay is 1.8x a standard Board member, at median
- Lead Director. Median additional compensation is $35K, same as prior year. Additional compensation is provided by nearly all companies with this role2. The differential in pay versus non-executive Chairs is in line with typical differences in responsibilities.
Pay Limits
now majority practice
- As a result of litigation (e.g., Investors Bancorp), 54 percent of the largest 100 companies now have an award limit for director compensation, up from 47 percent in the prior year.
- The limits are largely due to advancement of litigation where the issue has been that directors approve their own annual compensation and are therefore deemed to be inherently conflicted.
- Limits range from $250K to $4.75 million, with a median limit of $750K. Companies that denominate the limit in shares tend to have a higher dollar-equivalent limit, with a median of $1.1M. The median for the companies with value-based limits is $600K.
Limit Range Prevalence <= $500,000 28% $500,001 – $1,000,000 48% $1,000,001 – $2,000,000 18% > $2,000,001 6% - The limits tend to be much higher than annual equity grants.
Limit Multiple Range Prevalence <= 3x annual equity 30% 3.01x – 5x annual equity 33% 5.01x – 7x annual equity 22% > 7x annual equity 15% - Limits typically apply to just equity-based compensation; however, some companies have applied the limits to both cash and equity-based compensation (i.e., total pay) and we anticipate the prevalence of this practice will increase. Other companies exclude initial at-election equity awards, committee Chair pay, and/or additional pay for Board leadership roles from the limit.
Appendix

Total Board Compensation ($000s)3
Additional Compensation for Independent Board Leaders ($000s)
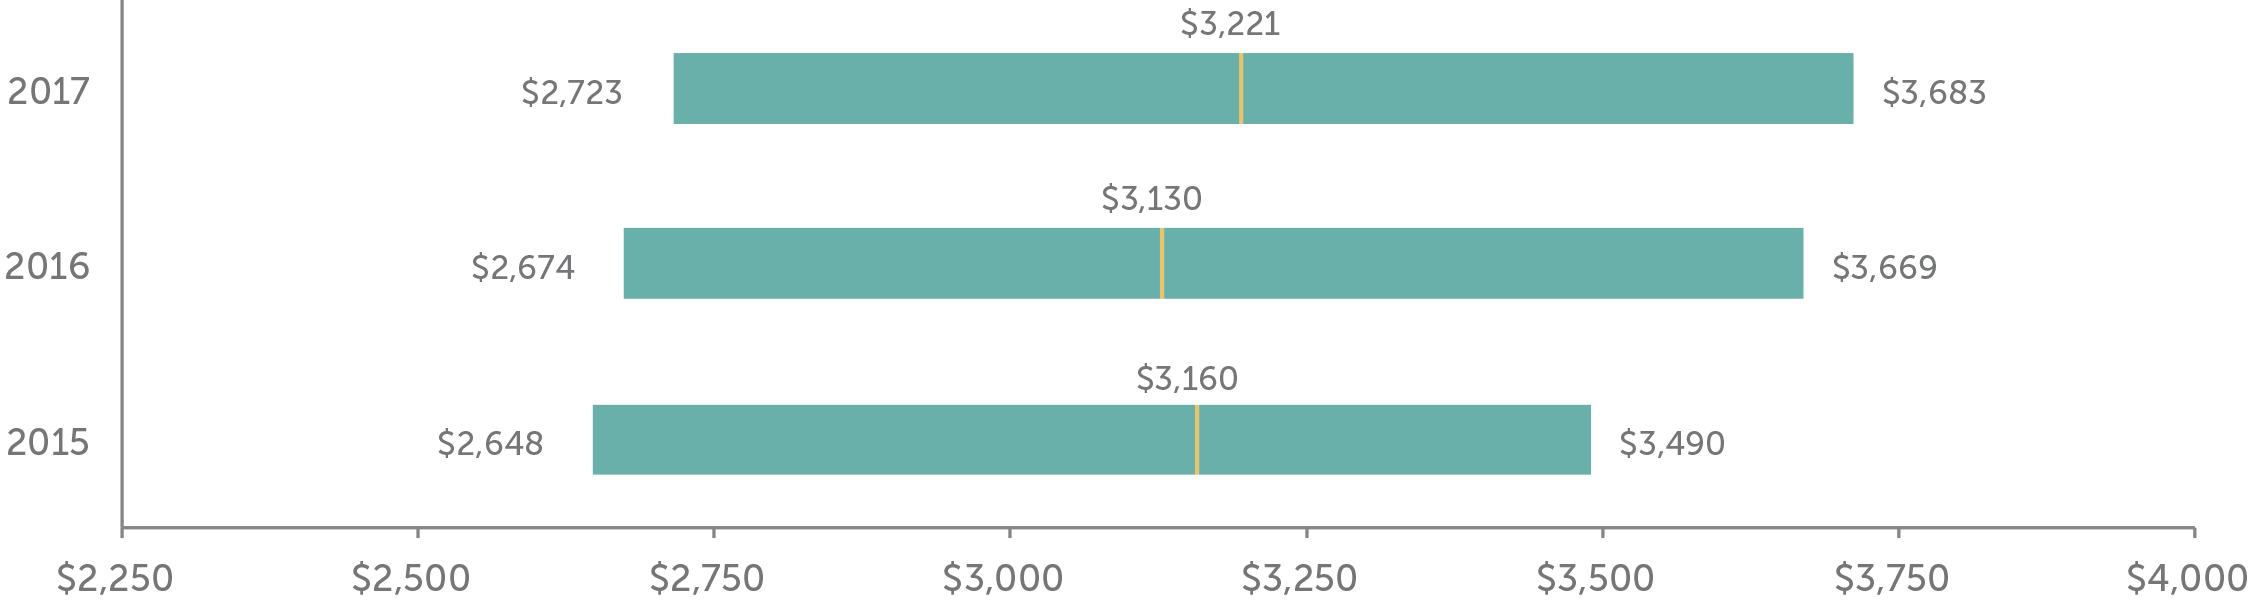
Total Company Cost for Board Service ($000s)
1 Audit, Compensation and/or Nominating and Governance committees.
2 Excludes controlled companies. Also excludes instances where Lead Director role is assumed by Chair of Nominating and Governance Committee, who receives compensation for the role.
3 Total Board Compensation reflects all cash and equity compensation for Board and committee service, excluding compensation for leadership roles such as committee Chair, Lead/Presiding Director, or non-executive Board Chair.
Nearly three months after President Trump signed the Tax Cuts and Jobs Act (“Tax Reform”) into law, company management, Compensation Committees, and outside advisors have been evaluating the impact the notable changes to Internal Revenue Code Section 162(m) (“Section 162(m)”) will have on executive compensation.
Tax Reform now eliminates the loophole of exceptions of performance-based pay and expands the list of “covered employees.” With these changes, companies face the challenge of understanding what impact this will have on their executive compensation programs, often specifically designed to qualify for the performance-based tax deduction, and the loss of tax deductibility.
Section 162(m) was first passed into law in 1993, with the intent to rein in executive compensation by eliminating the tax deductibility of executive compensation above $1 million for “covered employees”, effectively named executive officers (NEOs), unless the compensation was performance-based. The purpose of the tax law was to “punish” firms paying excessive executive compensation; however unforeseen was the performance-based loophole that has led to the unintended consequence of increased executive compensation post-1993.
Flash forward to 2018; 25 years later, Tax Reform now eliminates the loophole of exceptions of performance-based pay and expands the list of “covered employees.” With these changes, companies face the challenge of understanding what impact this will have on their executive compensation programs, often specifically designed to qualify for the performance-based tax deduction, and the loss of tax deductibility.
This article explores CAP’s perspective on the implications of these significant changes on compensation programs in 2018 and beyond.
Highlights of the Changes to Section 162(m)
Change: The new rule expands coverage to include any person serving as the Chief Executive Officer (CEO) and Chief Financial Officer (CFO) during the tax year, as well as the three highest paid executive officers other than the CEO and CFO (commonly referred to as NEOs). If a “covered employee” is paid $1 million a year in base salary, that is all the company will be able to deduct and annual performance-based bonuses, stock options, performance-based equity and deferred compensation will no longer be deductible.
Previously, a covered employee was an employee who, on the last day of the company’s fiscal year, was the CEO and the highest four paid executive officers. The CFO was excluded due to a change in the SEC’s definition of an NEO in 2006. Under the Tax Reform, CFO’s will be considered a covered employee as SEC and Section 162(m) rules now align.
CAP Perspective on Incentive Plan Design: We do not expect wholesale changes to compensation arrangements for executives.
The table below highlights the potential impact on the three major elements of pay for executives.
|
Pay Element |
Impact on Plan Design |
|
Salary |
|
|
Annual Incentive |
|
|
Long-Term Incentive (LTI) |
|
CAP Perspective on Administrative Requirements: Going forward, companies no longer need to follow certain administrative requirements around incentive plans and may need to revisit severance payment timing as certain practices were adopted based on the old tax code.
Additionally, once an executive is a covered employee, they will always be considered a covered employee, even if they appear in the proxy for just one year. Thus, compensation of covered employees for all future years of employment will be impacted, potentially creating an ever-growing group of covered employees subject to the $1 million cap.
The table below highlights the potential impact on these three key areas.
|
Administrative Requirements |
Impact on Plan Design |
|
Incentive Plans |
|
|
Severance Payments |
|
|
List of Covered Employees |
|
Change: Tax Reform included some transition relief. The elimination of the performance-based exception applies to taxable years beginning after December 31, 2017. However, the changes do not apply to compensation provided pursuant to a written binding contract in effect as of November 2, 2017, and are not “modified in any material respect” as of November 2, 2017.
CAP Perspective: Under the “transition rule,” deductibility is preserved for compensation provided under a written binding contract in effect as of November 2, 2017, as long as there is not a subsequent material modification. At this time, it is not clear how the transition rule will be interpreted and implemented. While we await further clarification, companies will have to evaluate if they plan to claim a tax deduction under the transition rule based on the limited guidance provided to date, and the specific facts related to the grants / award agreements. During this waiting period, companies should carefully consider any changes to existing arrangements, including outstanding long-term incentive grants, as they could disqualify those arrangements from being grandfathered under the transition rule.
Change: Prior to Tax Reform, under Section 162(m) the definition for “outside directors” was different than the stock exchange rules of “independent directors.” The difference is that a former officer could never be considered an outside director but can be independent.
CAP Perspective: The Compensation Committee can now include independent directors who are not “outside directors”. We are not seeing companies make changes at this time, as they still need to approve (outstanding) payouts that are grandfathered under annual incentive or performance-based plans. However, we still expect the Compensation Committee to be comprised of “outside directors” given the independence factors. Companies may want to amend Compensation Committee charters to remove any references to Section 162(m) outside director or procedural requirements.
Planning for 2018 and Beyond
Beginning in 2018 companies will lose the tax deduction on compensation over $1 million for covered employees; however, the reduced corporate tax rate will provide an offset to the lost deduction. As companies evaluate the effect of the lost tax deduction and full impact of Tax Reform on their compensation programs, we would recommend companies to work with outside advisors to determine the impact the changes will have their compensation program design, particularly grandfathered performance-based compensation arrangements.
Companies should await further guidance from the IRS, proxy advisory firms and stock exchanges before making substantial changes to their compensation programs. Any change should ensure the appropriate behaviors and results are being rewarded, performance targets are reflective of the long-term strategy, and incentive plan design supports current business needs, while considering good governance practices.
Compensation Advisory Partners (CAP) reviewed executive compensation pay levels and trends at 50 companies (Early Filers) that filed their most recent proxy statement between November 2017 and January 2018 (fiscal year ends from July 2017 to October 2017; 35 companies have September 30 fiscal year ends). Industry sectors reviewed include: Consumer Discretionary, Consumer Staples, Financials, Health Care, Industrials, Information Technology and Materials. Among these 50 companies, median Revenue was $7.5B, median Market Capitalization (based on each company’s fiscal year-end) was $13.0B and 1-year Total Shareholder Return, or TSR (based on each company’s fiscal year-end) was 19.3%.
Overall Findings
Performance: 2017 performance (based on Revenue growth, EBIT growth, EPS growth and 1-year TSR) was strong. Revenue and EBIT grew by approximately 6%, EPS was up 4% and TSR was up nearly 20% vs. prior year.
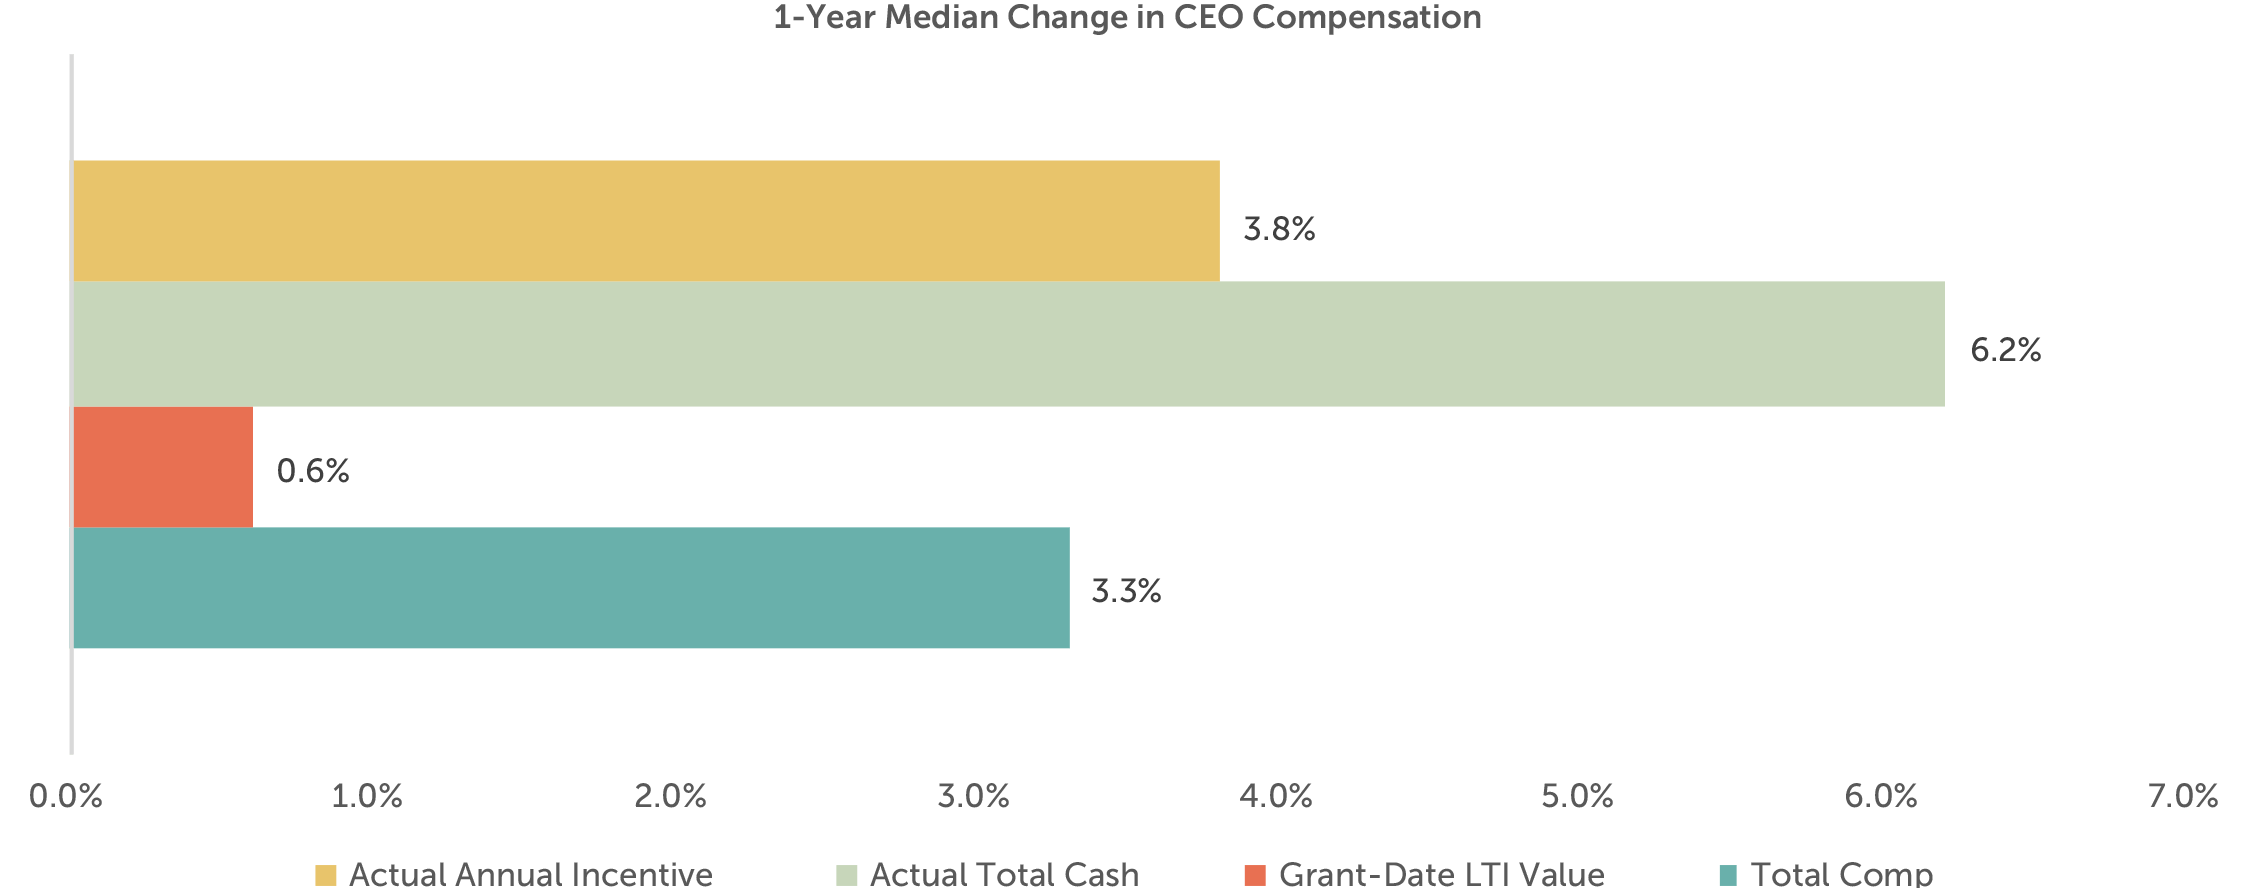
CEO Pay: Median CEO pay increased slightly by 3.3% mainly driven by actual annual incentive payouts. The grant date value of long-term incentives (LTI) was generally flat.
Annual Incentive Payout: Overall, the median 2017 annual incentive payout was 115% of target, reflective of strong financial performance.
2017 Performance
CAP reviewed Revenue growth, EBIT growth, EPS growth and TSR performance for the Early Filer and the S&P 500 companies. Overall, 2017 median performance for Early Filers was strong. Revenue and EBIT grew approximately 6%, EPS grew around 4% and TSR was up nearly 20%. TSR among the Early Filers showed double-digit growth for the second year in a row; this growth is due to strong financial performance as well as market expectations around tax reform in light of the current political climate.
| Financial Metric (1) | 2016 Median 1-year Performance | 2017 Median 1-year Performance | ||
| S&P 500 | Early Filers | S&P 500 | Early Filers | |
| Revenue Growth | 2.1% | 2.0% | 6.3% | 5.7% |
| EBIT Growth | 2.2% | 7.6% | 6.6% | 6.0% |
| EPS Growth | 4.2% | 5.2% | 9.9% | 3.9% |
| TSR | 3.3% | 18.4% | 17.0% | 19.3% |
(1) TSR and Financial performance for the S&P 500 is as of September 30, 2016 and September 30, 2017. Financial performance and TSR for Early Filers is as of each company’s fiscal year end.
CEO Total Direct Compensation
Among Early Filers with CEOs in their role for at least two years (n=39), median total direct compensation increased 3.3%. This increase was mainly due to higher actual annual incentive payouts in 2017; the grant-date value of LTI was generally flat year over year. Actual annual incentive payout was up nearly 4% reflective of strong financial performance while LTI, the largest component of CEO pay, was up only 1%. Median base salary for CEOs in our sample was unchanged from 2016.
Annual Incentive Plan Payout
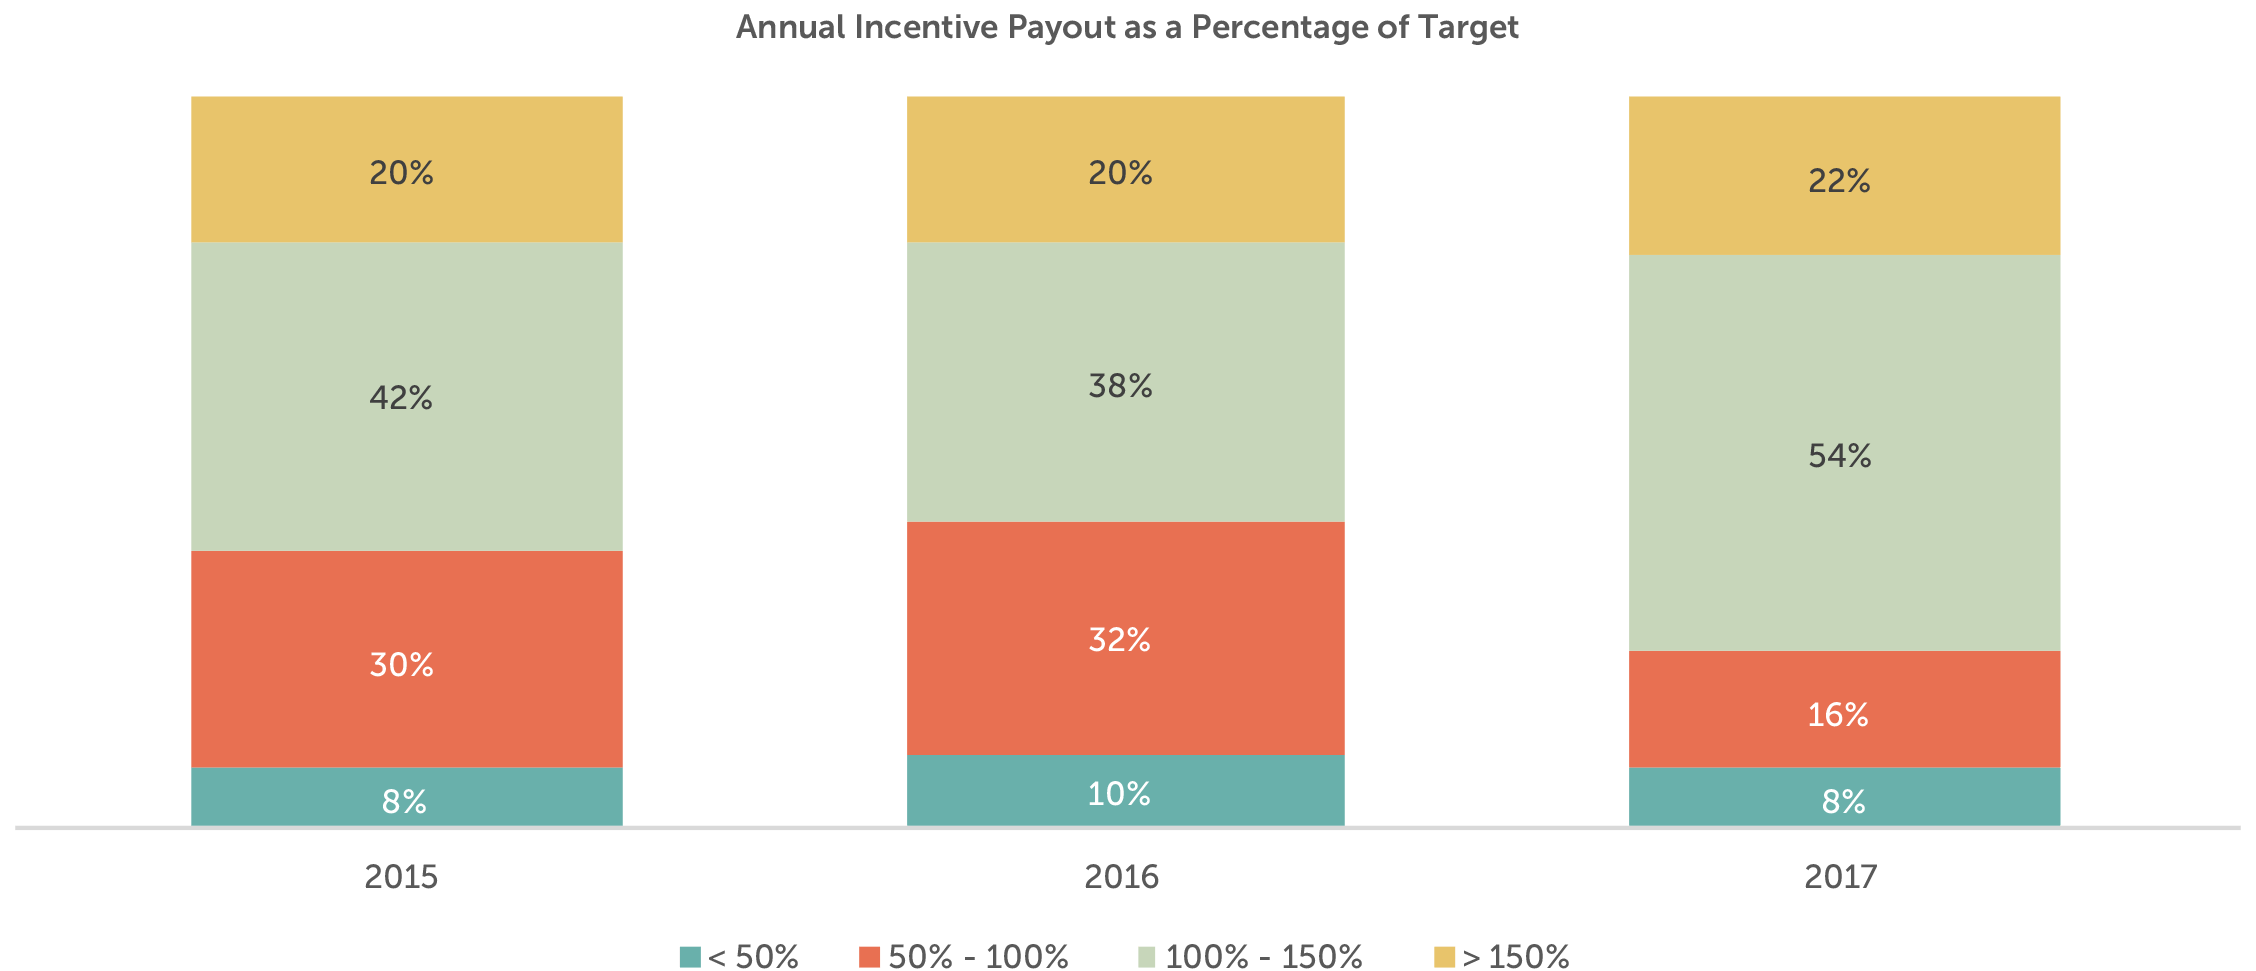
The median actual annual incentive payout in 2017 was 115% of target, higher than the median payout in 2016 of 106% of target. In fact, the 25th percentile bonus payout in 2017 was at target, noticeably higher than last year (86% of target).
| Summary Statistics | Annual Incentive Payout as a % of Target | ||
| 2015 | 2016 | 2017 | |
| 75th Percentile | 134% | 141% | 147% |
| Median | 106% | 106% | 115% |
| 25th Percentile | 97% | 86% | 100% |
Performance for companies with at or above target annual incentive payouts was substantially stronger than that of companies with below target payouts. Companies with payouts at or above target had strong EPS (10.9%) and TSR (23.2%) growth and solid Revenue (6.3%) and EBIT (7.2%) growth. Performance for companies with below target payouts was flat or declining from prior year.
| Financial Metric (1) | 2016 Median 1-year Performance | 2017 Median 1-year Performance | ||
| Below target payout (n=21) | At/above target payout (n=29) | Below target payout (n=12) | At/above target payout (n=38) | |
| Revenue Growth | (0.7%) | 3.0% | 2.1% | 6.3% |
| EBIT Growth | (2.8%) | 15.9% | 1.0% | 7.2% |
| EPS Growth | (3.9%) | 16.9% | (4.3%) | 10.9% |
| TSR | 16.9% | 19.6% | (3.9%) | 23.2% |
(1) Financial performance and TSR is as of each company’s fiscal year end.
76% of companies in 2017 provided a payout at or above target which is considerably higher than 2016 and 2015 (58% and 62%, respectively). In 2017, significantly more companies provided a payout between 100 – 150% of target than below target. This distribution is more evenly split in prior years. The distribution of payouts in 2017 aligns with stronger overall performance than 2016 and 2015.
Incentive Plan Design
Among Early Filers, 75% of companies use 2 – 3 financial metrics in the annual incentive plan and nearly 83% use 1 – 2 measures in the LTI plan. Metrics in the annual incentive plan typically focus on growth and profitability, while LTI plans are more likely to reward executives based on profits, return measures or stock price performance. A growing number of companies are beginning to use non-financial strategic goals, primarily diversity and inclusion and creating a more engaged workforce, in the annual incentive plan design. With the recent amendment to 162(m) due to the Tax Cuts and Jobs Act, we anticipate more companies will use strategic measures and individual objectives to reward executives in the future.
As performance-based compensation continues to be championed by both shareholders and proxy advisory firms, the use of performance-based LTI continues to be very prevalent. Performance plan usage remains high, at 90% of Early Filers. Option use declined among the Early Filers (54% down from 62%) and shifted to use of restricted stock.
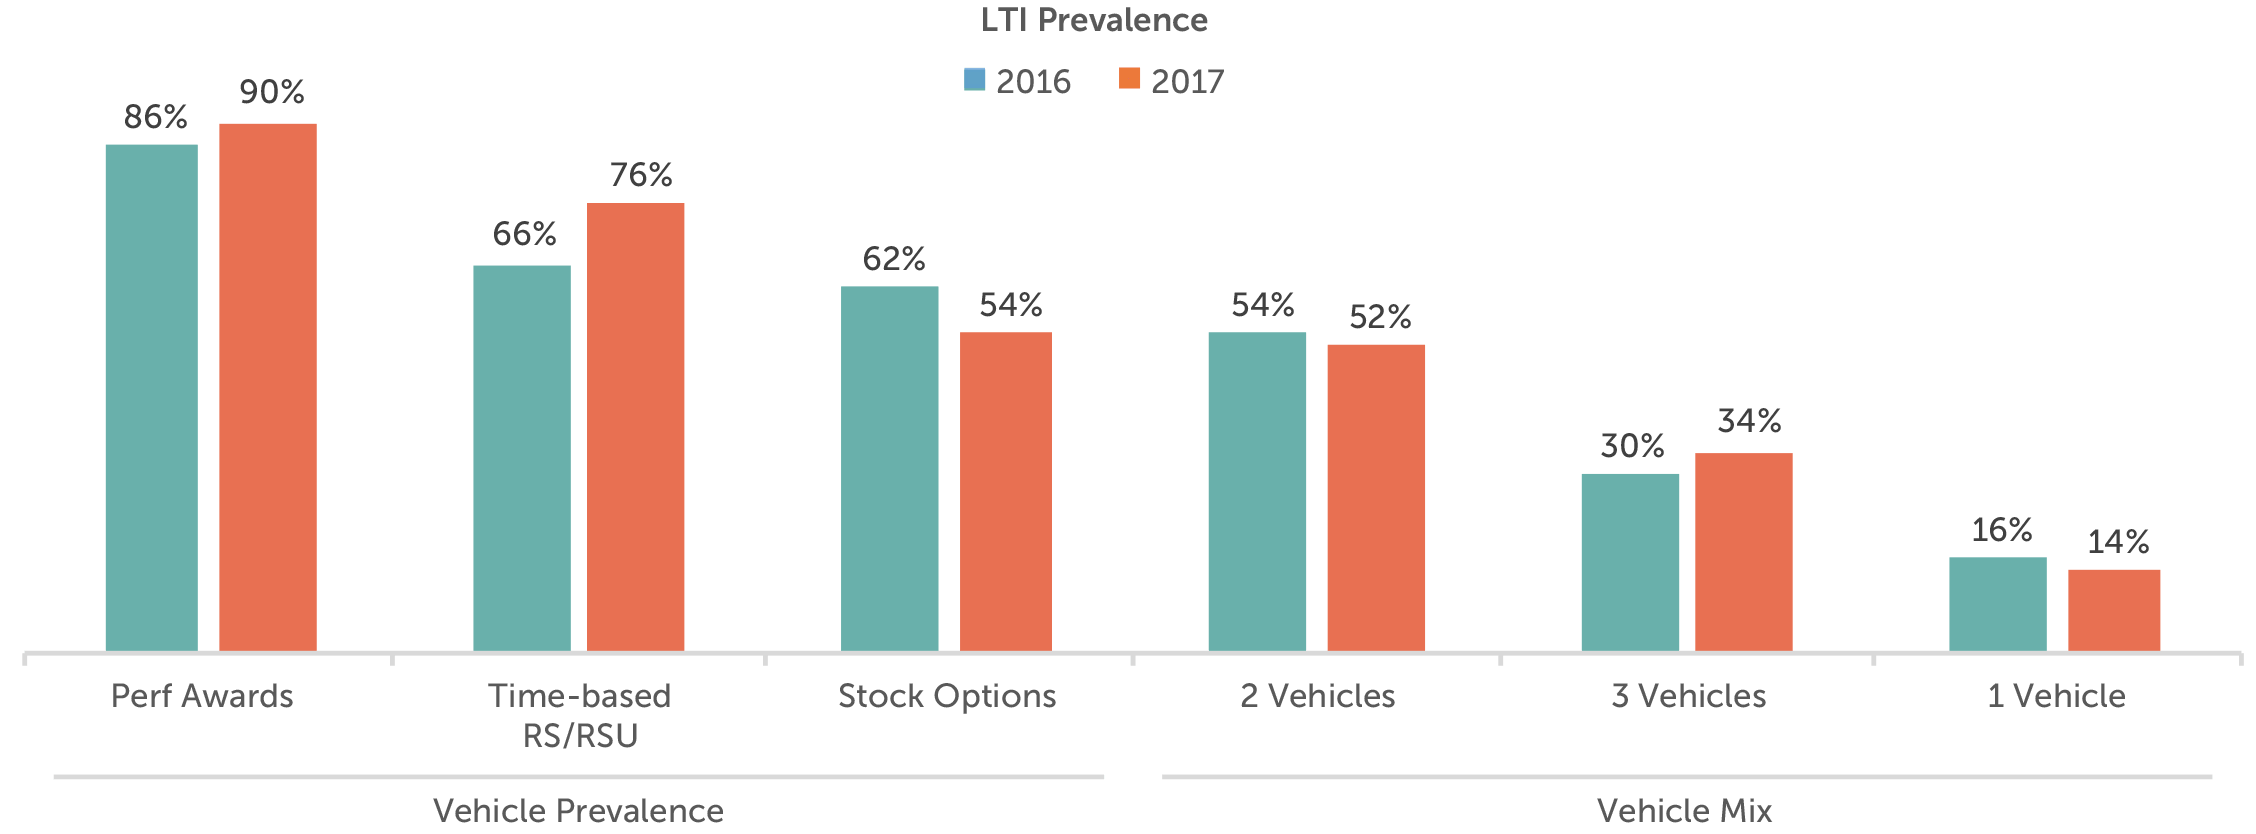
TSR continues to be the most prevalent LTI metric, with approximately 60% of companies using a performance-based plan with this metric. Of the companies that use TSR, 25% use it as a modifier, 50% use it as a stand-alone metric in conjunction with a financial measure and 25% use it as the sole measure. The prevalence of TSR as the sole measure has decreased somewhat over the last several years as companies use a balanced approach to reward executives for long-term financial and stock price results. We anticipate its usage as a sole measure to plateau or continue to decline particularly given ISS’ recent shift towards the use of other financial measures in its quantitative pay for performance assessment (ISS and Glass Lewis Policy for the 2018 Proxy Season).
Governance Practices
Over the last decade, many companies adopted good governance practices. Increased scrutiny from shareholders and proxy advisory firms has quickened the pace with which companies incorporated clawback, or recoupment, policies as well as hedging and pledging policies. It is no surprise that more than 90% of companies in our sample have a clawback policy in place. 85% of companies also have implemented hedging and pledging policies for their executives.
Nearly all companies (96%) in our sample have stock ownership guidelines in place; these guidelines encourage executives to hold a meaningful equity stake and align with shareholder interests. The guideline is most commonly expressed as a multiple of salary, with a median CEO multiple of 5x base salary and other NEOs with a multiple of 3x base salary. About one-third of companies also require executives to hold stock (typically 50 – 100% of net shares received) until stock ownership guidelines are met. It is less common for companies to require executives to hold shares for a period of time (e.g., 1 year) in lieu of stock ownership guidelines. Good governance practices continue to be a focus of shareholders, and companies are routinely implementing and updating policies as appropriate in the current regulatory environment.
Conclusion
2017 was a year of strong financial performance for the Early Filers, which resulted in above target annual incentive payouts for approximately 75% of companies. CEO actual total cash compensation increased by 6%, and when combined with generally flat LTI award values, total pay increased by 3%.
2018 will be the first performance year after the passage of tax reform. We do not expect companies to unwind their use of performance-based pay and good governance practices, yet we foresee greater use of individual and strategic performance measures, along with increased use of discretionary pay decisions, in moderation.
For questions or more information, please contact:
Lauren Peek Principal
[email protected] 212-921-9374
Joanna Czyzewski Associate
[email protected] 646-486-9746
Melissa Burek Partner
[email protected] 212-921-9354
Each year CAP analyzes non-employee director compensation programs among the 100 largest companies. We believe these companies provide insight into where the market will be going in terms of practices. This report is a summary of trends – for pay levels and pay practices – based on 2017 proxy filings.
CAP Findings
Board Compensation pay levels increased modestly
- Total Fees. Increased 3 percent (median is $290K, versus $282K in prior year); board compensation has reached a steady state, and low single digit increases have been and are expected to continue to be the norm.
- Retainers. Large companies rely on annual retainers (cash and equity) to compensate directors. Pay programs are typically simple and tend to rely less on meeting fees or committee member retainers.
- Meeting Fees. Paid by only 11 percent of companies, consistent with prior year. In general, companies have moved to a fixed retainer pay structure, with a component in cash and a component in equity. We support this approach as it simplifies administration and eliminates the need to define “what counts as a meeting.” However, companies may want to consider having a mechanism for paying meeting fees if the number of meetings in a single year far exceeds the norm (“hybrid approach”). Five companies in our dataset used this approach to meeting fees, with the threshold ranging between 6 and 10 meetings.
- Equity. Full-value awards (shares/units) are most common; only 7 percent of companies used stock options. 97 percent of companies denominated equity awards as a fixed value, versus a fixed number of shares, which is considered best practice as it manages the value awarded each year. Approximately two-thirds of equity awards vest within 1 year of grant (either immediately or cliff vest after 1 year).
- Pay Mix. On average, 61 percent equity-based and 39 percent cash-based, consistent with prior year. Alignment with long-term shareholders is reinforced by delivering a majority of board compensation in equity.
Committee Member Compensation little/no change
- Overall Prevalence. Half of companies paid committee-specific member fees for Audit Committee service and approximately one-third of companies paid member fees for Compensation or Nominating/Governance Committee service. The majority of companies rely on board-level compensation to recognize committee service, with the general expectation that all independent directors contribute to committee service needs1.
- Total Fees. Of the companies that paid committee member compensation, the median was $17.8K.
Committee Chair Compensation higher Audit Chair premium
- Overall Prevalence. More than 90 percent of companies provided additional compensation to committee Chairs, typically through an additional retainer and not meeting fees, to recognize additional time requirements, responsibilities, and reputational risk.
- Fees. Median additional compensation for Audit Committee Chairs increased to $25K from $20K last year. Median additional compensation for Compensation and Nominating/Governance Committee Chairs was $20K and $15K, respectively, consistent with prior year.
Independent Board Leader Compensation higher Lead Director premiums
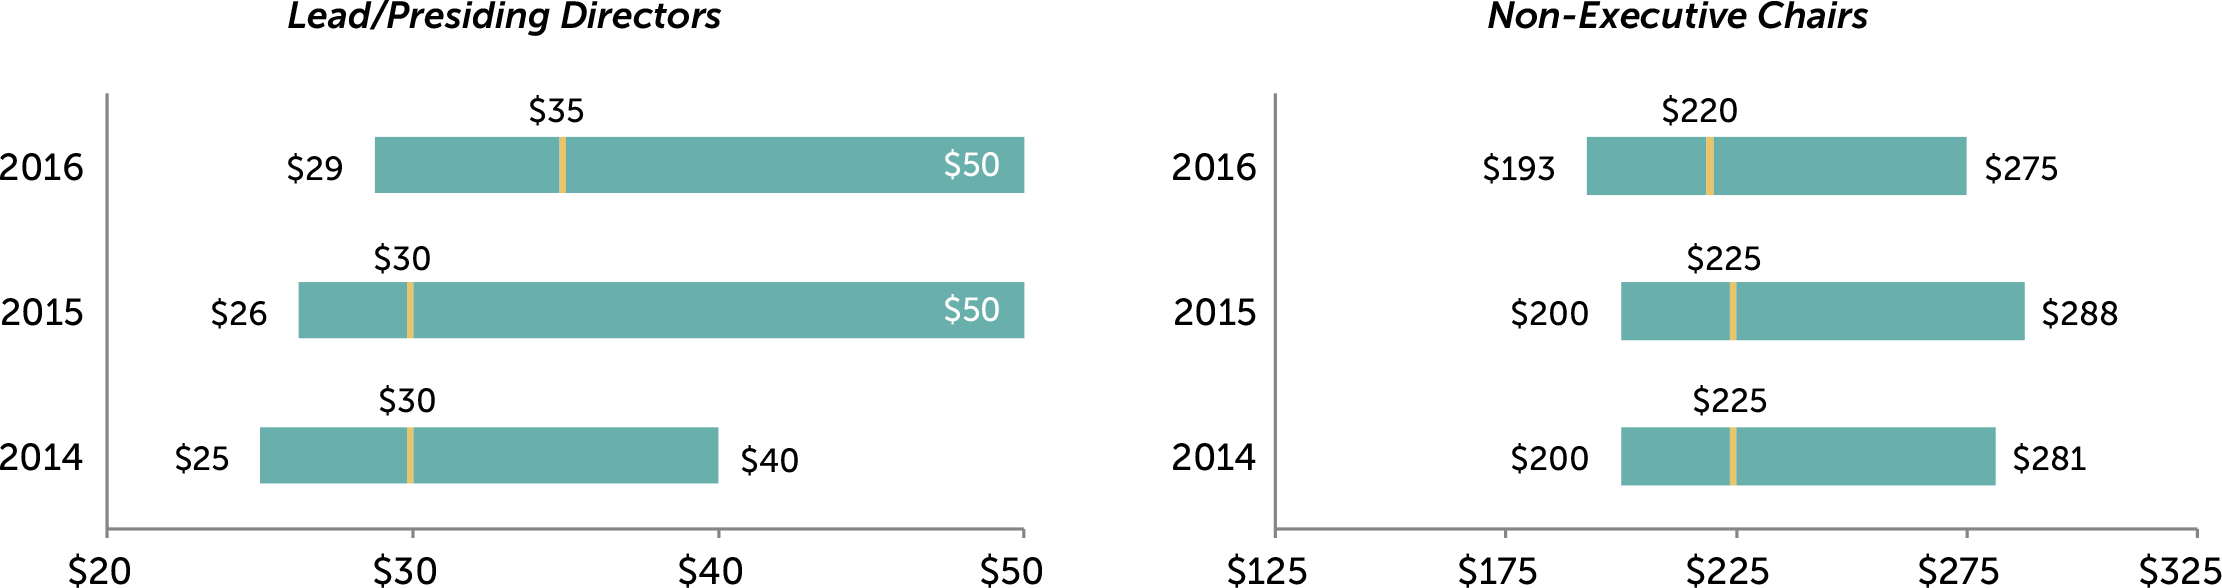
- Non-Exec Chair. Additional compensation is provided by all companies with this role, $220K at median. As a multiple of total Board Compensation, total Board Chair pay is 1.83x a standard Board member, at median.
- Lead Director. Median additional compensation increased to $35K, up from $30K in the prior year. Additional compensation is provided by nearly all companies with this role2. The differential in pay versus non-executive Chairs is in line with typical differences in responsibilities.
Pay Limits prevalence of limits continues to go up
- Similar to last year, a majority of companies (55%) that amended or adopted an equity plan in 2017 – that did not already have a limit in place – implemented an award limit for director compensation.
- In total, 47 percent of the largest 100 companies now have such limits, up from 39 percent in the prior year.
- Limits range from $250K to $4.7 million, with the median limit being at $750K. Companies that denominate the limit in shares tend to have a higher dollar-equivalent limit, with a median of $1M. The median for the companies with value-based limits is $600K.
Limit Range Prevalence <= $500,000 28% $500,001 – $1,000,000 55% $1,000,001 – $2,000,000 13% > $2,000,001 4% - The limits tend to be much higher than annual equity grants. Approximately 72% of limits are greater than 3x the annual equity grants.
Limit Multiple Range Prevalence <= 3x annual equity 28% 3.01x – 5x annual equity 36% 5.01x – 7x annual equity 25% > 5x annual equity 11% - Limits typically apply to just equity-based compensation; however, some companies have applied the limits to both cash and equity-based compensation (i.e., total pay) and we anticipate the prevalence of this practice will increase further. Other companies exclude initial at-election equity awards, committee Chair pay, and/or additional pay for Board leadership roles from the limit.
- The limits are largely due to advancement of litigation where the issue has been that directors approve their own annual compensation and are therefore deemed to be inherently conflicted.
Appendix
Total Board Compensation ($000s)3

Additional Compensation for Independent Board Leaders ($000s)
Total Company Cost for Board Service ($000s)

1 Audit, Compensation and/or Nominating and Governance committees.
2 Excludes controlled companies. Also excludes instances where Lead Director role is assumed by Chair of Nominating and Governance Committee, who receives compensation for the role.
3 Total Board Compensation reflects all cash and equity compensation for Board and committee service, excluding compensation for leadership roles such as committee Chair, Lead/Presiding Director, or non-executive Board Chair.
On a panel of leading executive compensation experts, Margaret Engel discusses some of the top executive compensation issues and trends including: the current public mistrust of executive compensation programs, the importance and the rigorous process of target goal setting, the challenges that many companies face with long-term performance awards, and the likely increase in the use of performance-based stock options in the future.


